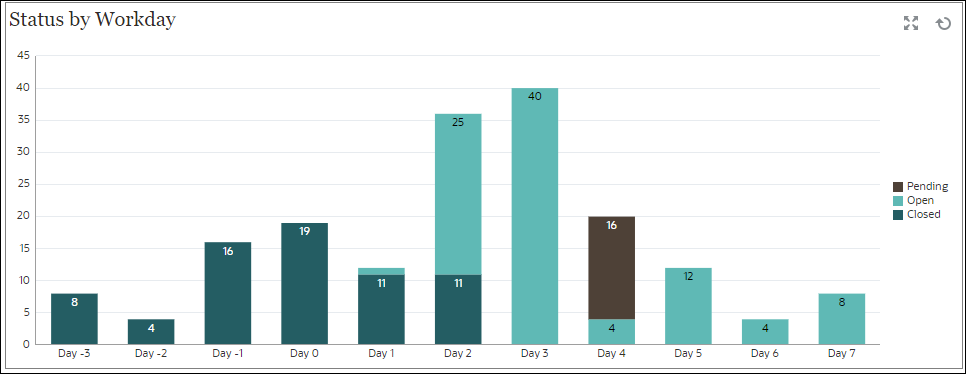
Chart View: Status by Workday
This example chart shows task completion based on a custom Workday attribute.
In this example, the custom attribute was added previously and defined with values for days -15 through 35. All tasks were then assigned a work day based on their planned completion.

Within the dashboard, bottom left view:
- Click the Object Type icon and select Tasks.
- Click the View Selector icon and select Chart View.
- Click the Settings icon and specify the following:
- On the Properties tab:
-
Title: Status by Workday
- Type: Column
- Background: No fill
- Label Position: Inside Edge
- Orientation: Vertical
- Grid Lines: Select this check box
- Period: Selection
-
- On the Layout tab:
- X-Axis:
- Type: Attribute
- Attribute 1: Workday (This custom attribute must have been added previously for it to display in the list.)
- Sort: Workday from the first drop-down menu and Ascending from the second drop-down menu.
- Legend (Series): In first row, add:
- Value: Task
- Aggregation: Count
- Categories: Status
-
Y Axis: Select this check box.
- Minimum: Auto
- Maximum: Auto
-
Major Unit: Auto
- Minor Unit: Auto
- X-Axis:
- On the Legend tab:
- Legend Position: Right
- Palette: Redwood
- Select the default labels for each series: Closed, Error, Open, and Pending.
- Select the default colors for each series.
- On the Properties tab:
- Click OK.