Working With Gantt Chart Views
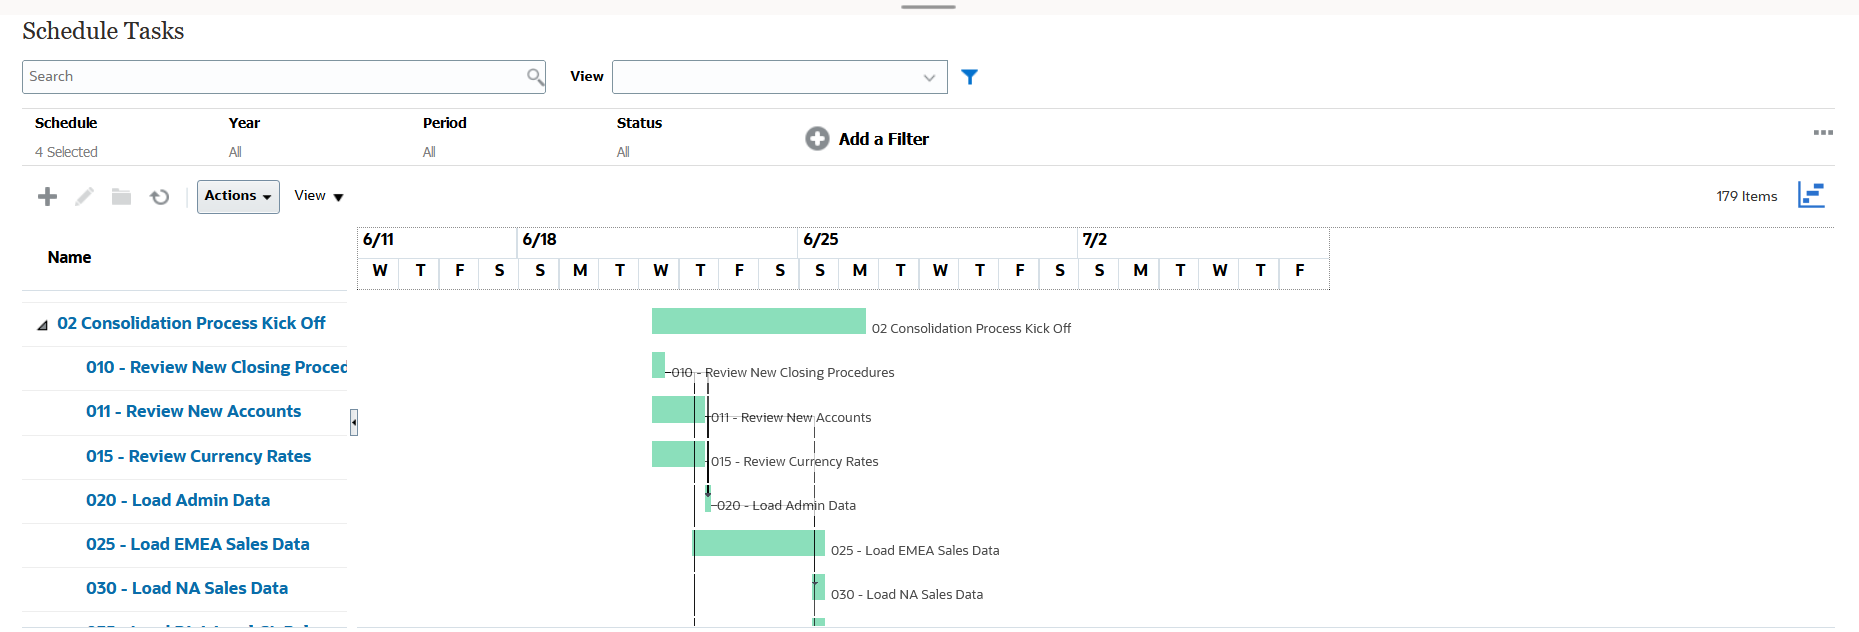
Gantt charts displays a timeline for a schedule that graphically represents the duration of tasks and the dependencies between them. You can view the predecessor relationships between tasks. Bars represent duration, and arrows represent dependencies. You can also see the parent-child task relationships in the hierarchy.
You might choose to use the Gantt Chart view when you create a template to see the predecessor relationships between the tasks, or to verify the precedence order after adding tasks to a schedule.
Gantt Chart view is available for Scheduled Tasks.
To view the data in a Gantt Chart:
- On the Home page, click Tasks, and then click Schedule Tasks.
- Click the View Selector icon and choose Gantt Chart.
The schedule tasks data is displayed in the Gantt Chart view as shown.
