9.2 About Data Flow Editor
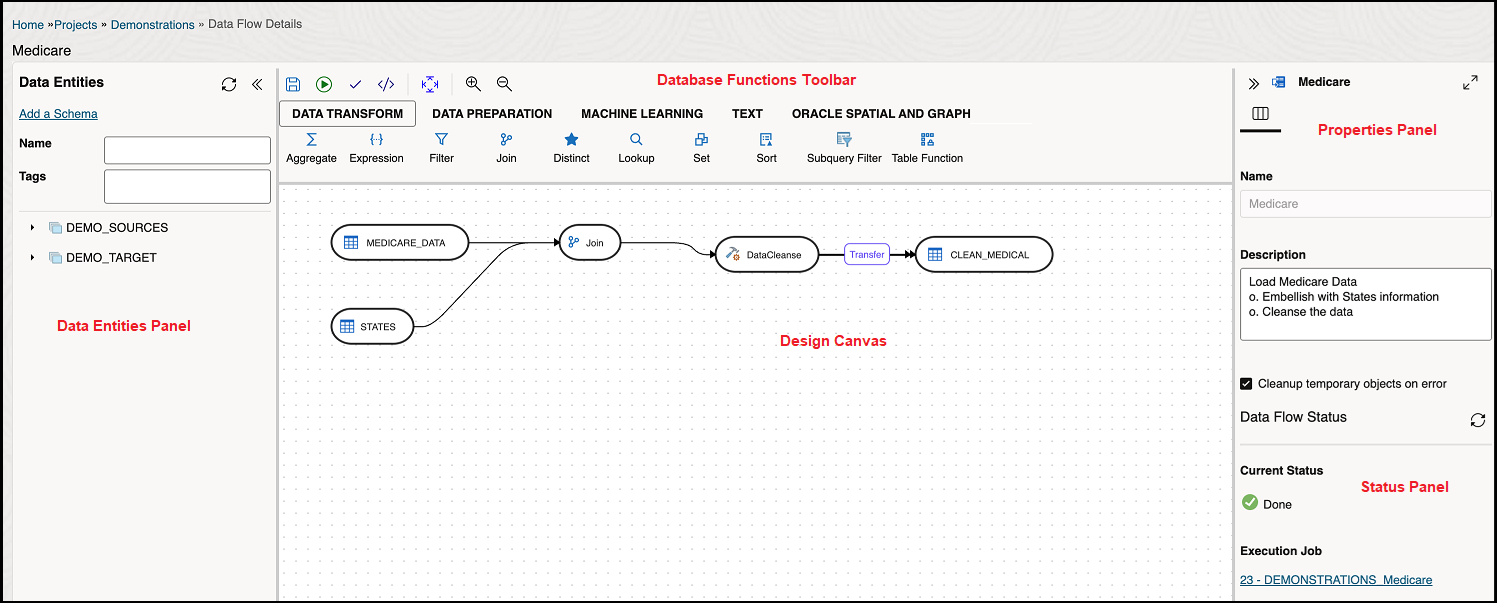
The Data flow editor is divided into five parts, the Data Entity Panel, the Database Functions Toolbar, the Design Canvas, the Properties Panel, and the Status Panel.
- Data Entities Panel: The data entity panel displays the Data Entities that
are available to use in your Data flows. The displayed list can be filtered using
the Name and Tags fields. The panel includes options that let you add schemas,
import data entities, remove any of the schemas that are associated with the data
flow, and refresh data entities. See Add Components for information about how to use these options.
This panel also includes the following controls:
 : Saves the data flow.
-
 : Executes the data flow.
 : Allows you to schedule the data flow to run at a specified time
interval.
 : Validates the data flow.
 : Allows you to check the code that will run when you execute the
data flow job.
-
 : Aligns the nodes of the data flow.
-
 : Maximizes or minimizes the data flow diagram in the design
canvas.
 : Allows you to use SQL queries to create a data flow. See Generate Data Flow From SQL Statements.
 : Synchronizes any updates made to the data entities within the data
flow.
- Database Functions Toolbar: The Database Functions toolbar display the database functions that can be used in your data flows. Just like Data Entities, you can drag and drop the Database tools you want to use on the design canvas. See Supported Database Functions for more information.
- Design Canvas: The design canvas is where you build your transformation logic. After adding the Data Entities and Database Functions to the design canvas, you can connect them in a logical order to complete your data flows.
- Properties Panel: The properties panel displays the properties of the selected object on the design canvas. The Properties Panel is grouped into four Tabs. General, Attributes, Preview Data, Column Mapping, and Options. Not all tabs are available as they vary based on the selected object. See Component Properties to know more about these options.
- Status Panel: When you run a data flow, the Status Panel shows the status of the job that is running in the background to complete the request. You can see the status of the job that is currently running or the status of the last job. For more information about the Status panel, see Monitor Status of Data Loads, Data Flows, and Workflows.
Parent topic: Data Flows
