8.7.6 Editing a Faceted Search Page

Learn about how attributes can change faceted search page behavior.

Tip:

Many examples in this section are built on the EBA_PROJECT_TASKS table available in the sample dataset, Project Data, or the EMP table available in the sample dataset, EMP / DEPT. To install a sample dataset, see Using Sample Datasets in Oracle APEX SQL Workshop Guide.

8.7.6.1 Reviewing Faceted Search Page Components

Review the components that comprise a faceted search page by viewing attributes in Page Designer.

A faceted search page features a faceted region that enables users to narrow down the search results and displays the results in either a report or cards view.

To review the components of a faceted search page:

  1. View the page in Page Designer:
    1. On the Workspace home page, click the App Builder icon.
    2. Select an application.
    3. Select a page.
    Page Designer appears.
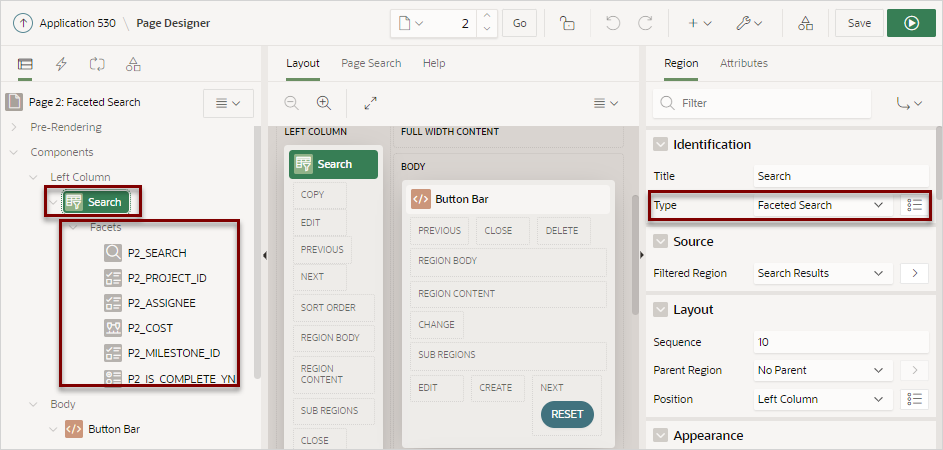
  2. Review the Search region. In the Rendering tab under Left Column, locate and select the Search region.
    Description of faceted_search_facets.png follows
    Description of the illustration faceted_search_facets.png

    Note the Search region Type is Faceted Search. The search fields display under Facets. Facets are similar to items but feature the following unique characteristics:

    • Naming Conventions - Facets use the same naming convention as items. By default, wizards prefix facet names with P<page no>_<item name> (for example, P2_SEARCH).

    • Filtering on More Than One Column - Search facet type can filter based on more than one column and, when not external, is always at the top of the facets region.

    • Associated with a Column - Facets are associated with a column from the report region.

    • Differences with Checkbox or Select List Facets - The facet types such as Checkbox or Select List specify the UI for selecting or entering the facet values. They are not implemented the same as page items even if they have the same type name. For this reason, most dynamic actions do not apply to facets.

  3. Select a facet and explore the configurable options.
    To view Help, select the attribute and click the Help tab.
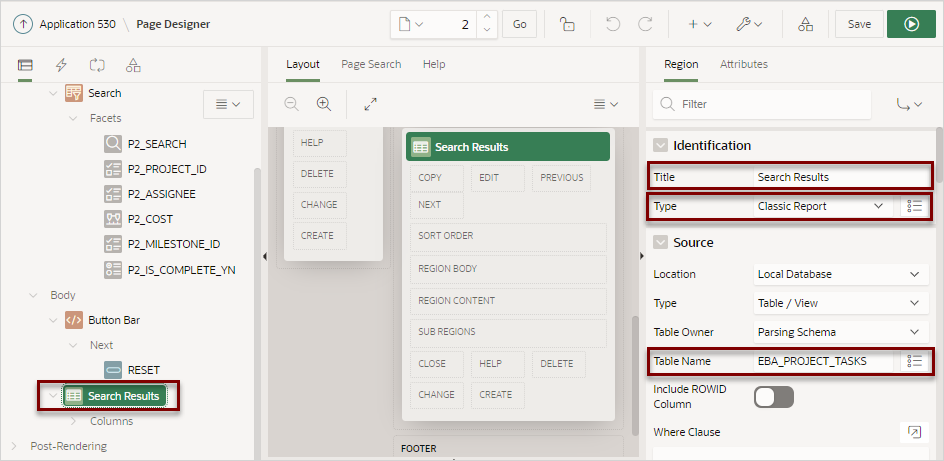
  4. Review the report region. In the Rendering tab, locate and select the report region (for example, Search Results).
    Description of faceted_report_region.png follows
    Description of the illustration faceted_report_region.png

    In the previous example, note that the attributes indicate the report Type is a Classic Report built on the EBA_PROJECT_TASKS table in a local database.

8.7.6.2 Understanding a Faceted Search Page

Learn about the regions that comprise a faceted search page.

About the Search Region

A faceted search page features a Search region which enables users to narrow down the search result and a Search Results region which displays as either a classic report or cards report.

The Search region displays in the left pane or Rendering tab. Selecting the Search region displays attributes in the Property Editor. In the following image, the Search region Type is defined as Faceted Search. The Filtered Region attribute identifies the Search Results region. In this example, Filtered Region is as a classic report named Search Results.

Tip:

Remember that each attribute in the Property Editor has associated Help. To view Help, select the attribute in the Property Editor and then click the Help tab in the central pane. Help describing the attribute appears in the central pane.

About Facets

Search facets display under Facets in the Rendering tab. When you select a facet, the associated attributes display in the Property Editor. Facets use the same naming convention as items. By default, wizards prefix facet names using the following convention: P<page no>_<item name>. For example, in the previous example, the first facet is named P2_SEARCH).

Facets are similar to items but feature the following unique characteristics:

  • Filtering on More Than One Column - The facet of type Search, generally called Search, can filter based on more than one column and, when not external always displays at the top of the facets region.

  • Associated with a Column - The facets are associated with a column from the report region.

  • Differences with Checkbox or Select List Facets - The facet types, such as Checkbox or Select List, indicate how UI enables the user to select or filter data. Facets are not implemented the same as page items even if they have a similar naming convention. For this reason, most dynamic actions do not apply to facets.

About the Search Results

A faceted search page includes a Search Results region which displays as either a classic report or cards report. In the following example, Search Results is a Classic Report built on the EBA_PROJECT_TASKS table.

About Cards Page Search Results

The Search Results in a faceted search page can display as a cards report. A cards page functions as a colorful way to display a subset of information and then enable the user to link to more detail. To create a link from a cards page, you create an action and then select an action type. You can create an action to link from a full card, a title, a subtitle, media, or a button. To see an example, see Using Actions to Link from a Cards Page.

8.7.6.3 Editing Faceted Search Region Attributes

Edit region Attributes to change general search facet region behavior.

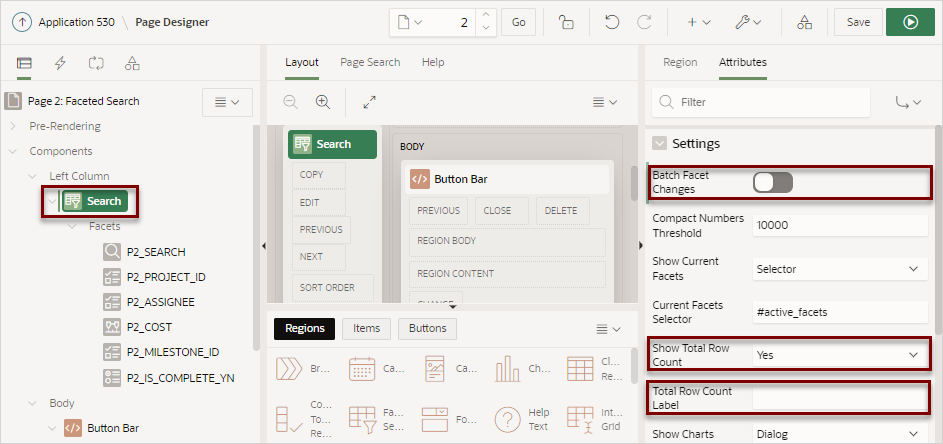
The following example demonstrates how to review and edit the region Attributes Batch Facet Changes and Show Total Row Count. Batch Facet Changes controls whether the report filtering executes as soon as a facet value changes, or individually by clicking an Apply button. Show Total Row Count determines if a row count value displays on the page. The following example built on the EBA_PROJECT_TASKS table available in the sample dataset, Project Data.

Tip:

To view help for an attribute, select the attribute in the Property Editor and click the Help tab in the central pane.

To edit Search facet region Attributes:

  1. View the faceted search page in Page Designer.
  2. View the Search region Attributes:
    1. In the Rendering tab (or left pane), select the Search region.
    2. In the Property Editor, select the Attributes tab.
  3. Enable Batch Facet Changes:

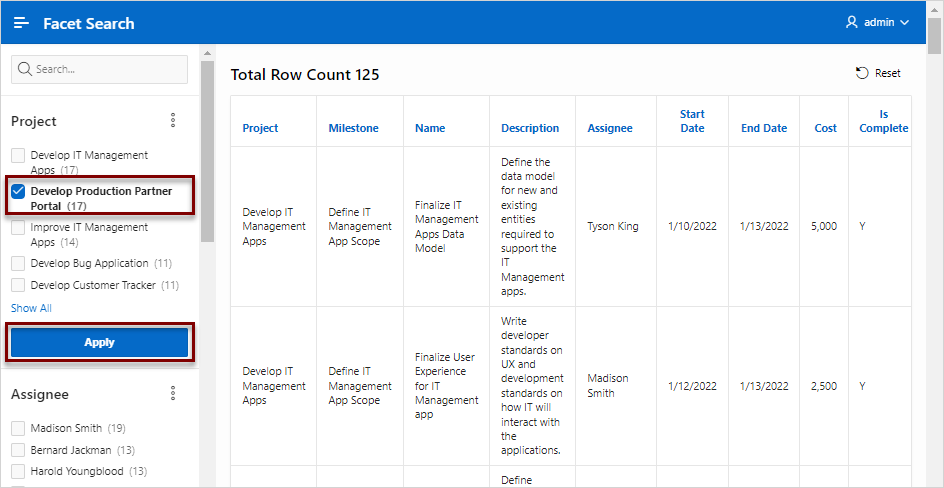
    Batch Facet Changes controls how report filtering executes. When enabled and a user selects a facet, an Apply button appears under the facet. The user must click the Apply button to apply the facet and filter the report. When disabled, the report filtering executes as soon as the facet value changes.

    1. In the Rendering tab (or left pane), select the Search region.
    2. In the Property Editor, select the Attributes tab.
    3. Under Settings, enable Batch Facet Changes.
    4. Click Save and Run Page.

      A rendered version of the application appears.

      Description of batch_facet_changes1.png follows
      Description of the illustration batch_facet_changes1.png
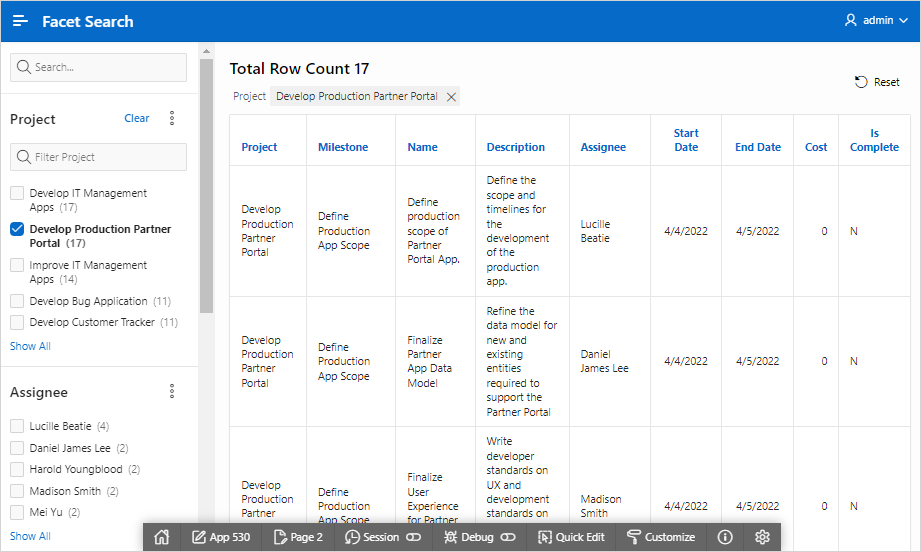
    5. In the Search region, select a project, such as Develop Production Partner Portal.
    6. Click Apply.

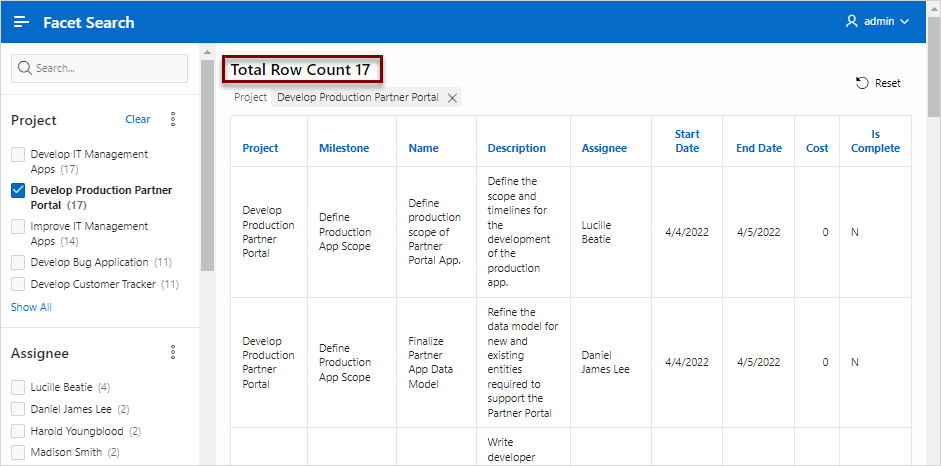
      A revised report appears and a filter displays above report.

    7. Return to Page Designer by clicking Page XX on the Runtime Developer Toolbar.
  4. Review the Show Total Row Count attribute.

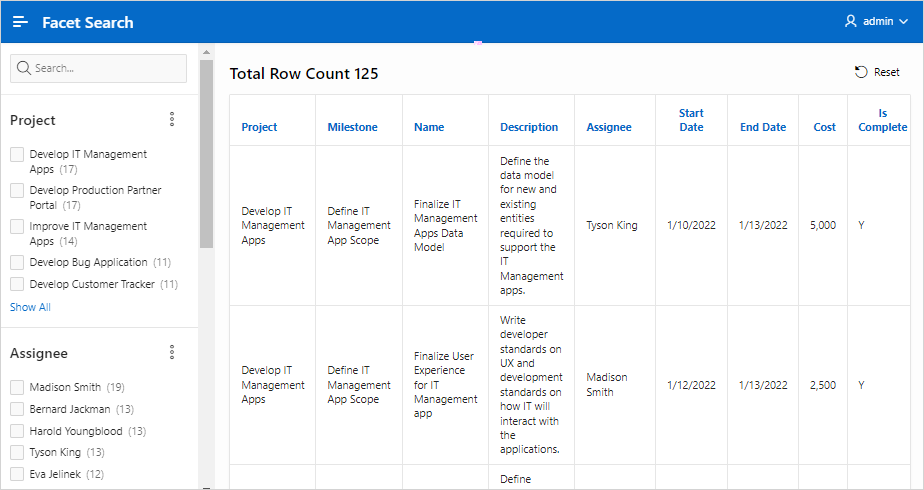
    When set to Yes, the total row count displays above the report. In the prevous illustration, this displays as Total Row Count 17.

    1. In the Rendering tab (or left pane), select the Search region.
    2. In the Property Editor, select the Attributes tab.
    3. Find Settings, Show Total Row Count. Options include:
      • No - If No, the total row count does not display.

      • Yes - If Yes, the total row count displays at the top of the current facets as shown in the previous illustration.

        If Show Current Facets is a selector, the total row count displays whereever that selector is defined. The wizards by default create an element on the page called active_facets and that is above the report. If Show Current Facets is No and Show Total Row Count is Yes, the total row count displays at the top of the facets region.

      • Selector - If Selector, the total row count displays wherever the selector is defined. This option enables you to place the total row count anywhere on the page.

  5. Click Save or Save and Run Page.

8.7.6.4 Editing Facet Attributes

Edit facet attributes to change facet behavior.

The following example demonstrates how to review and edit the Display Filter Initially and Depending On attributes to change facet behavior. Enabling Client-Side Filtering adds a search field which enables users to filter the facet list. Depending On makes the display of one facet dependent upon another. The following example is also built on the EBA_PROJECT_TASKS table available in the sample dataset, Project Data.

Tip:

To view help for an attribute, select the attribute in the Property Editor and click the Help tab in the central pane.

To view and edit facet attributes:

  1. View the faceted search page in Page Designer.
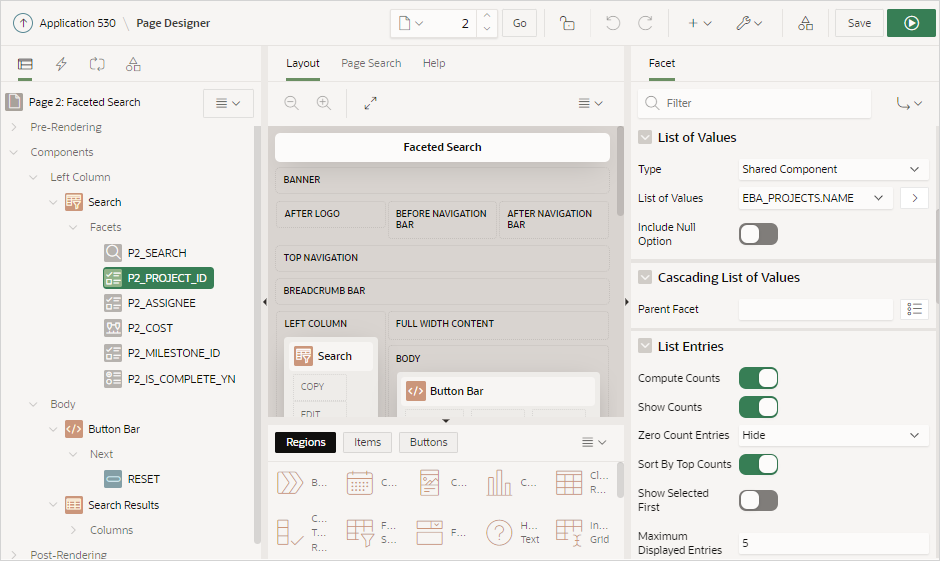
  2. View the facet attributes for the facet, P2_PROJECT_ID:
    1. In the Rendering tab (or left pane) locate the Search region and select the facet, P2_PROJECT_ID.
    2. In the Property Editor (or right pane) find the List of Values group.

      The List of Values group indicates that the P2_PROJECT_ID facet is a List of Values created as a Shared Component.

      Tip:

      The maximum amount of items which can be returned by an LOV, or by Distinct Values, is 5,000. If an LOV returns more than 5,000 items, faceted search cuts the LOV silently at 5,000 values. When logged in as a developer, Oracle APEX raises a runtime error once more than 2,000 LOV items are returned. These errors indicate that the LOV returns too many values for a useful faceted search UI.
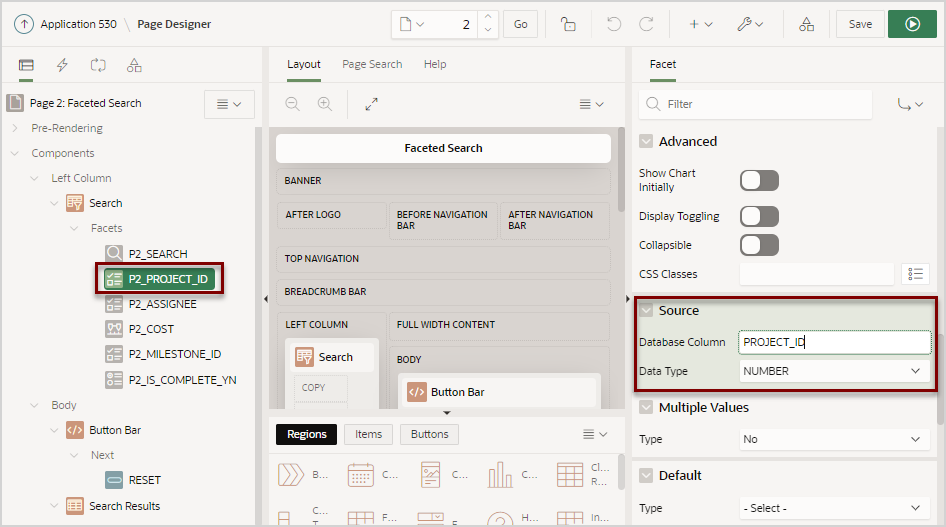
    3. In the Property Editor, find the Source group.

      The Source group indicates that the P2_PROJECT_ID facet is based on the PROJECT_ID column which has a data type of Number.

  3. Update P2_PROJECT_ID and enable the Display Filter Initially attribute:
    1. In the Rendering tab, select the P2_PROJECT_ID facet (if not already selected).
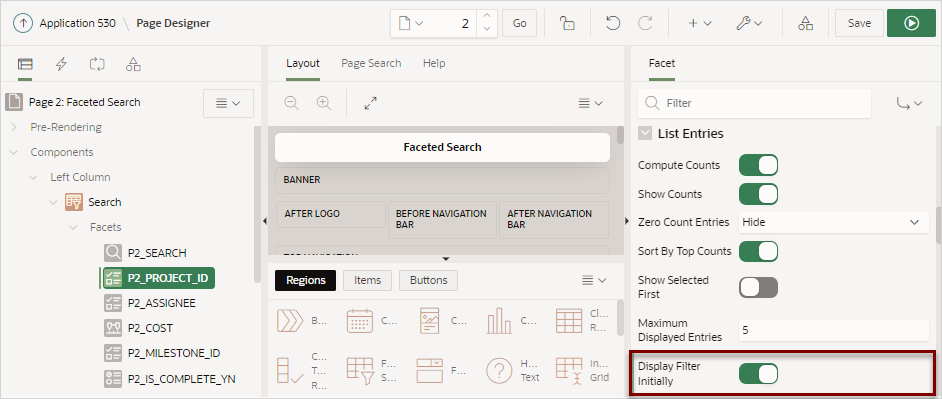
    2. In the Property Editor, find List Entries and enable Display Filter Initially.

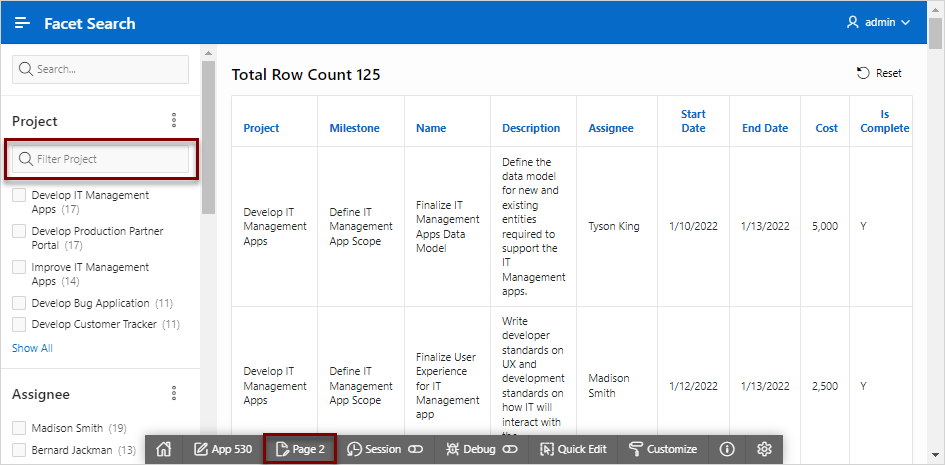
      When Display Filter Initially is enabled, a filter field displays above the list entries. If the number of entries in the facet is less than the value on Maximum Displayed Entries, the filter field will not display.

    3. Review your changes. Click Save and Run Page.

      The faceted search page appears and a new Filter Project field appears.

    4. Test the new Filter Project field. For example, entering the keyword "develop" will update the Project list to only include search facets containing that phrase.
    5. Click Page XX on the Runtime Developer Toolbar to return to Page Designer, where XX is the page number.
  4. Only show Assignees for the selected Project by enabling the Depending On attribute.
    1. In the Rendering tab locate the Search region and select the P2_ASSIGNEE facet.
    2. In the Property Editor, find Depending On, Facet and select P2_PROJECT_ID.
    3. Review your changes. Click Save and Run Page.

      The faceted search page appears. Note that the Assingee list no longer displays.

    4. Select a project such as Develop Production Partner Portal.

      Note that the Assignee list now appears but only displays assignees associated with the Develop Production Partner Portal project.

8.7.6.5 Adding a New Facet

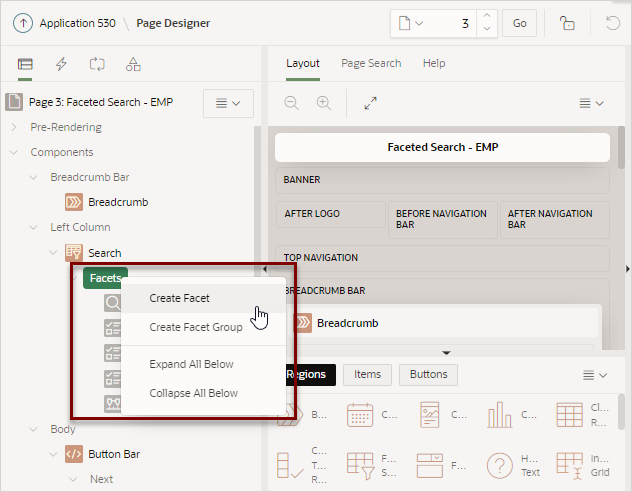
Add new facets in Page Designer by right-clicking Facet and selecting Create Facet from the context menu.

Facets map to specific database columns. When creating a new facet, you can create the following types: Checkbox Group, Input Field, Radio Group, Range, Search field, or Select List.

You can control the facet order in the UI by reordering the facets in the Rendering tab. Note there can be at most one Search type facet and if present it displays at the top of the faceted search region no matter where it resides in the Rendering tab.

The following example demonstrates how to create Input Field facet to filter employee salary that is less than or equal to the provided dollar amount. In this example, the Input Field facet maps to the SAL column in the EMP table available in the sample dataset, EMP / DEPT.

To create an Input Field facet:

  1. View the faceted search page in Page Designer.
  2. Create the new facet:
    1. In the Rendering tab (or left pane), find the Search region.
    2. Right-click Facets and select Create Facet from the context menu.

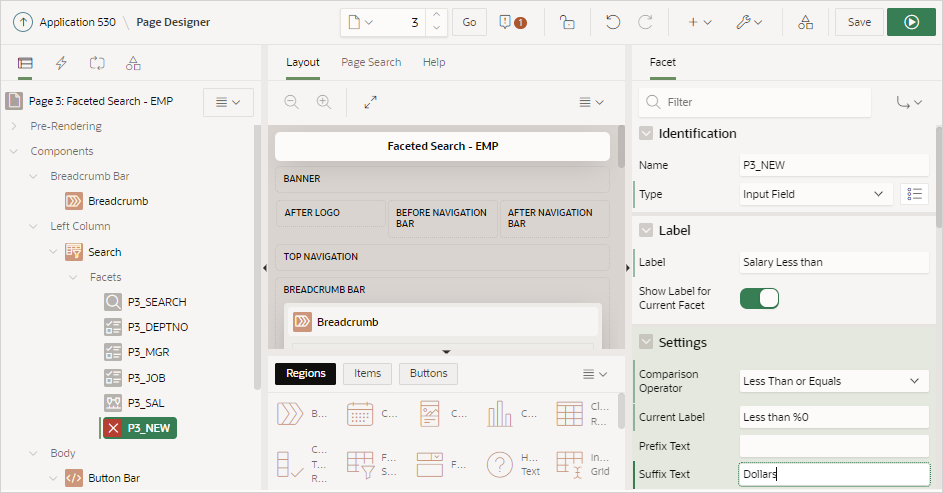
      A new facet appears in the Rendering tab. In this example, the facet is named P3_NEW.

  3. In the Rendering tab, select the new facet and then update the following attributes in the Property Editor (right pane):
    1. Identification, Type - Specify how this item is rendered. Select Input Field.
    2. Label, Label - Enter the label for the facet. The label displays on the page only if the facet displays. Enter:
      Salary Less than
    3. Settings, Comparison Operator - Select a comparison operation. Select Less Than or Equals.
    4. Settings, Current Label - Provide the text to be displayed for this facet in the current facets area. The current value must be referenced with the %0 placeholder. Enter:
      Less than %0
    5. Settings, Suffix Text - Provide text to be displayed after the input field. Enter:
      Dollars
  4. Map the facet to the appropriate database column.
    • Source, Database Column - Enter the case sensitive database column name used as the source for this facet. Since this facet maps to the SAL column, enter: SAL
    • Source, Data Type - Select NUMBER.
  5. Change the facet position so it displays after the Search facet.
    • Layout, Sequence - Enter: 20

    Tip:

    You can also drag and drop the P3_NEW facet in the Rendering tab to the appropriate location.
  6. Review your changes. Click Save and Run Page.

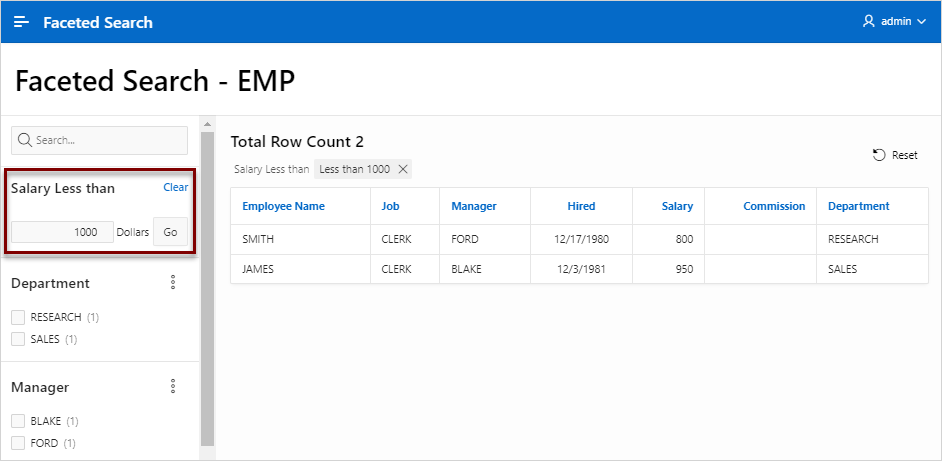
    The following example shows the new Input Facet in the Search region. In this example, the value 1000 is entered in the Salary Less than facet. The report in the Search Results region displays two employees that have a salary of less than $1000.

8.7.6.6 Adding a Facet on a Column Containing Multiple Values

Add a facet to filter a column storing multiple values.

Note:

Creating a facet on a column containing multiple values requires Oracle Database release 12.2 or later. Using an earlier release raises an error.

Faceted Search supports the ability to filter columns storing multiple values as one string.

The following example demonstrates how to create a Checkbox Group facet which filters a column containing employee skills. The following example includes a Faceted Search page built on a table named EMP_SKILLS. This example demonstrates how to create a Checkbox Group facet that maps to the SKILLS column which contains multiple values using a colon separator (for example, PLSQL:Spatial).

To add facet to filter a column storing multiple values:

  1. View the faceted search page in Page Designer.
  2. Create the new facet:
    1. In the Rendering tab (or left pane), find the Search region.
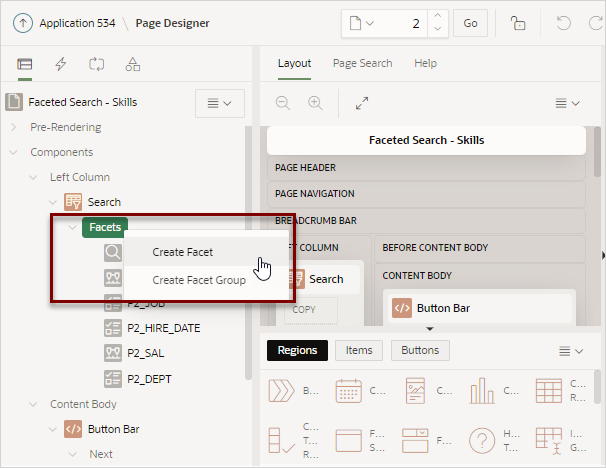
    2. Right-click Facets and select Create Facet from the context menu.

      A new facet appears in the Rendering tab. In this example, the facet is named P2_NEW.

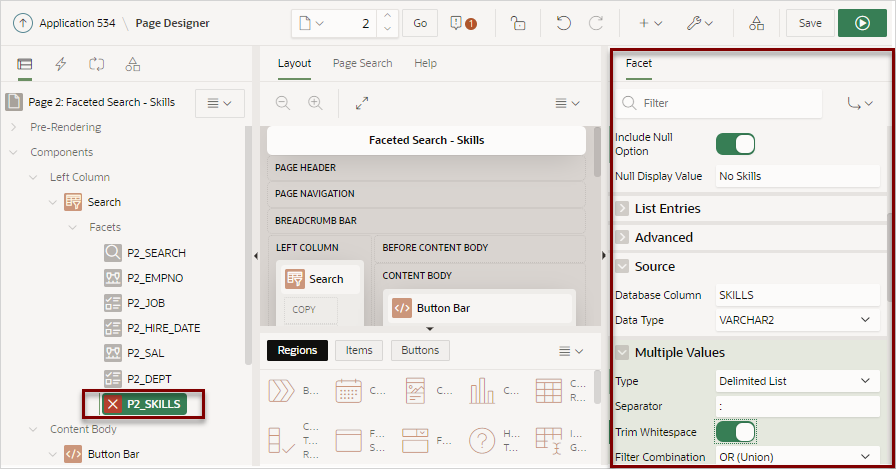
  3. In the Rendering tab, select the new facet and then update the Identification and Label attributes in the Property Editor (right pane):
    1. Identification, Name - Enter the name of this item (for example, P2_SKILLS).
      Item names must be valid Oracle identifiers. Oracle recommends that item names be no longer then 30 bytes so they can be used as bind variables in SQL Queries.
    2. Identification, Type - Specify how this item is rendered. Select Checkbox Group.
    3. Label, Label - Enter the label for the facet. The label displays on the page only if the facet displays. Enter:
      Skills
  4. Update List of Values attributes:
    1. List of Values, Type - Select Distinct Values.
      Distinct Values creates a list of values is based on an automatically generated query that selects the distinct column values.
    2. List of Values, Include Null Option - Enable this option to include a NULL option at the top of the list.
    3. List of Values, Null Display Value - Enter:
      No Skills
  5. Update the Multiple Values attributes:
    1. Multiple Values, Type - Determines whether the Source Column contains multiple values, and how these are encoded. For this example, select Delimited List.
      Options include:
      • No - Column does not contain multiple values.
      • Delimited List - Column contains values as a delimited list. Example:

        APEX,SQL,PL/SQL

      • JSON Array - The Source column contains a JSON array of scalar values. APEX will raise error messages if the column contains invalid JSON syntax. Example:

        APEX,SQL,PL/SQL

    2. Multiple Values, Separator - Identifies the character which separates values from each other, such as a colon (:).

      Double-quote (") and backslash (\ ) characters are not supported as a Value Separator.

    3. Multiple Values, Trim Whitespace - Specify whether to trim leading and trailing whitespace from individual values after splitting.
      Enabling Trim Whitespace increases the parsing effort and results in slower performance. Oracle recommends disabling this option. For larger data sets, consider data cleansing instead.
    4. Multiple Values, Filter Combination - Specify how to combine individual values when filtering. For this example, select OR (Union).
  6. Source, Database Column - Verify the case sensitive database column name used as the source for this facet. Since this facet maps to the SKILLS column, this attribute should display:
    SKILLS
  7. Change the facet position so it displays after the P2_SEARCH facet.
    • Layout, Sequence - Enter: 20

    Tip:

    You can also drag and drop the P2_SKILLS facet in the Rendering tab to the appropriate location.
  8. Review your changes. Click Save and Run Page.

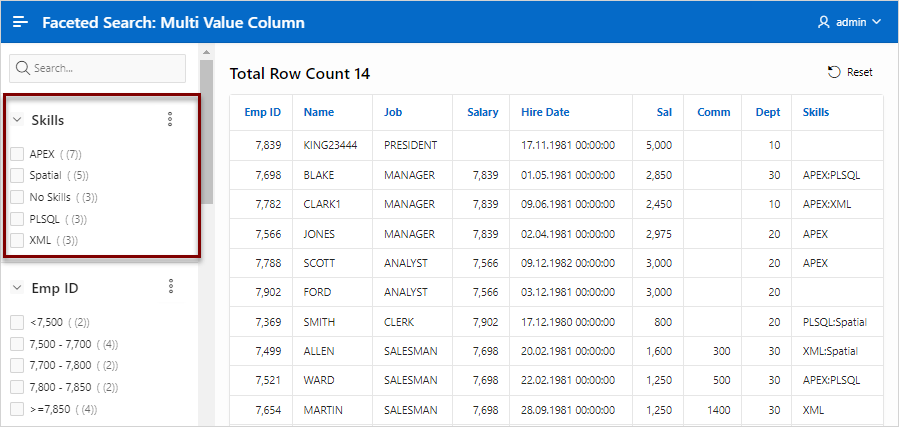
    The following example shows a new facet labeled Skills which contains five checkboxes. Clicking a checkbox filters the report to only display only employees having the selected skill. In this example, no skills are selected.

8.7.6.7 Creating Facet Groups

Create facet groups for data models having multiple flag columns.

Data models having multiple flag columns can result in a busy faceted search UI. Flag columns typically display two values such as Yes or No (for example, In Stock, Orderable, and so on). To streamline your faceted search UI, you can create a facet group which displays one facet that contains multiple checkboxes.

To create a facet group:

  1. View the faceted search page in Page Designer.
  2. In the Rendering tab (or left pane), find the Search region.
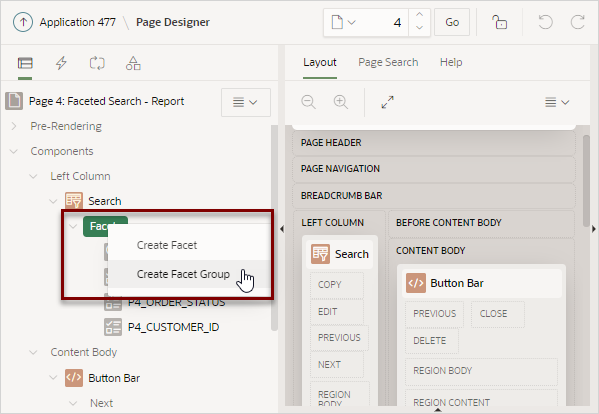
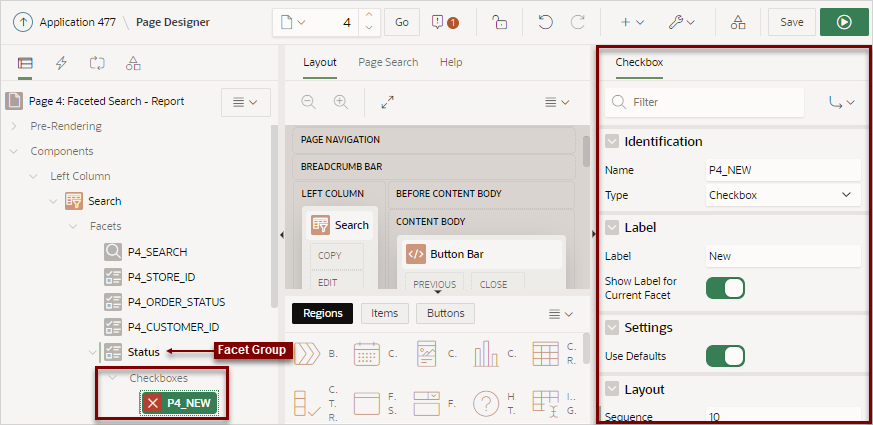
  3. In the Rendering tab (or left pane), right-click Facets and select Create Facet Group from the context menu.

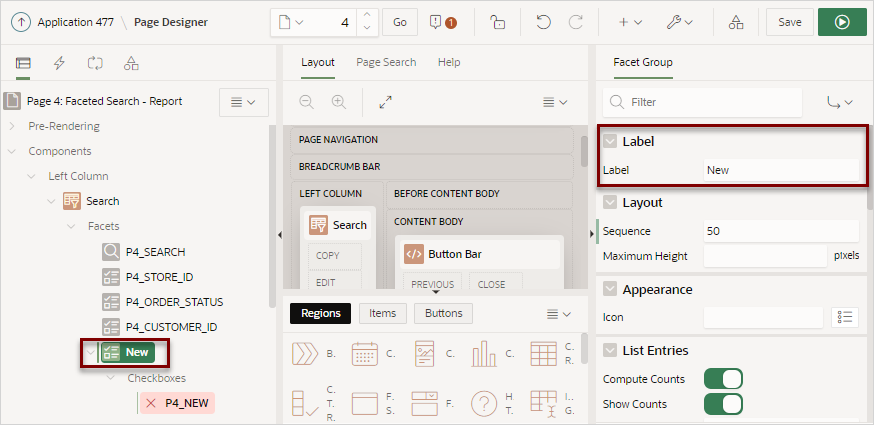
    A Facet Group appears in the Rendering tab and a new checkbox named PX_NEW.

  4. Update the label for the new facet group:
    1. In the Rendering tab, select the new facet group, New (if not already selected).
    2. In the Property Editor, edit the Label attribute.
  5. Edit the checkbox, PX_NEW
    1. In the Rendering tab, select the checkbox facet, PX_NEW.
    2. In the Property Editor, edit the following Checkbox attributes:
      • Identification, Name - Update the name of this item.

      • Settings, Use Defaults - Disable Use Defaults.

        The Checked Value attribute appears.

      • Settings, Checked Value - Enter the value stored in the page item if the user checks the checkbox. The value can be up to 255 characters long.

      • Source, Database Column - Enter the case sensitive database column name used as the source for this facet.

      • Source, Data Type - Select the data type of the underlying database column.

  6. Add more facet checkboxes:
    1. In the Rendering tab (or left pane), right-click Checkboxes and select Create Checkbox.
      A new checkbox named PX_NEW appears.
    2. In the Property Editor (or right pane), edit the following Checkbox attributes:
      • Identification, Name - Update the name of this item.

      • Settings, Settings - Select Custom.

      • Settings, Checked Value - Enter the value stored in the page item if the user checks the checkbox. The value can be up to 255 characters long.

      • Database Column - Enter the case sensitive database column name used as the source for this facet.

      • Data Type - Select the data type of the underlying database column.

  7. Repeat the previous step until all facet checkboxes have been added.
  8. Review your changes. Click Save and Run Page.

8.7.6.8 Configuring Single Facet Charts

Configure region and facet attributes to declaratively control how and if single facet charts display in the facet search region.

By default, when you create a facet that computes counts with a wizard, each facet that computes counts includes a chart based on the facet counts. When users click the three dots context menu on the facet and then Show Chart, a chart displays in a popup dialog. Users can toggle between a bar chart and pie chart by clicking the chart icon on the right side of the dialog. You can configure region and facet attributes to control if these charts appears.

Note:

To view an example of a single chart based on the facet counts, see Example Faceted Search.

To configure region and facet attributes to control facet charts:

  1. Edit faceted search region attributes:
    1. In the Rendering tab (or left pane), select the Search region.
    2. In the Property Editor (right pane), select the Attributes tab.
    3. Settings, Show Charts - Specifies where facet value charts are shown.Options include:
      • Dialog - Facet value charts are shown in a non-modal dialog. Adds the Show Chart action on the Facet Context Menu in the facet header. When the user clicks the Show Chart action, a popup dialog displays the chart.

      • No - The Show Chart action is not displayed on Facet Context Menu in the facet header.

        Also, when this attribute is set to No, the facet attributes Chart and Show Chart Initially are not applicable.

      • Selector - Specify the selector for an element you place somewhere on the page. When the user clicks the Show Chart action, the chart is added to this element. This option enables you to place the charts in a dashboard like area just about anywhere on the page.

        For example, suppose you added a static content region somewhere on the page and added a <div> with an id like this:

        <div id='facetDashboardArea'></div>

        Then in the Charts Selector attribute you would enter:

        #facetDashboardArea

    4. Settings, Display Chart for Top N Values - Use this attribute to control the maximum number of values to display in the chart for each facet. A value of 10 means that the facet charts will show at most the first 10 items. If the facet has the Sort By Top Counts attribute On then this will be the 10 largest count values.

      Tip:

      You may need to reset the region before changes to Display Chart for Top N Values appear because the current set of visible charts is stored in browser session storage.

  2. Configure facet attributes.
    1. In the Rendering tab locate the Search region and select a facet.
    2. In the Property Editor, review the following facet attributes:
      • List Entries, Compute Counts - Single facet charts are based on facet counts. Note that Compute Counts must be enabled for the Show Chart action to display on the facet context menu in the facet header.
      • List Entries, Show Chart - Enable or disable this option to show or hide the Show Chart action in the facet context menu.
      • List Entries, Show Chart Initially - Enable this option to have the chart display initially. Charts can only display initially if the Show Charts attribute is set to Selector.

      Tip:

      You may need to reset the region before changes to Show Chart Initially appear because the current set of visible charts is stored in browser session storage.

  3. Click Save or Save and Run Page.

8.7.6.9 Editing the Static List of Values for a Range Facet

Edit a range facet that displays as a static list of values.

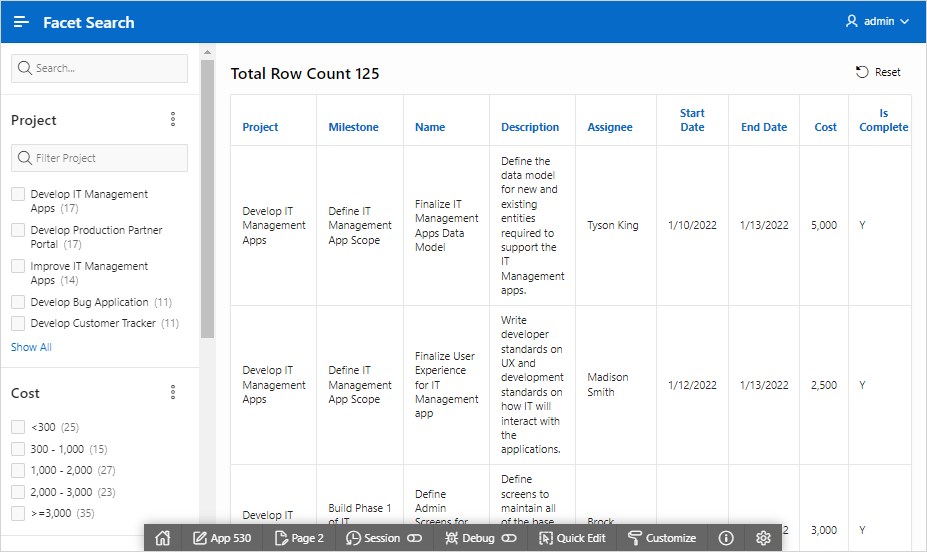
The following example demonstrates how to edit a facet that renders as a static list of values. The following example is built on the COST column of the EBA_PROJECT_TASKS table available in the sample dataset, Project Data. This example demonstrates how to update the Cost list shown in the following illustration so that the first two rows display in increments of 500 instead of 300.
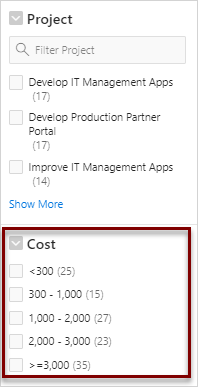
Description of cost_list.png follows
Description of the illustration cost_list.png

To edit a facet that displays as a static list of values:

  1. View the faceted search page in Page Designer.
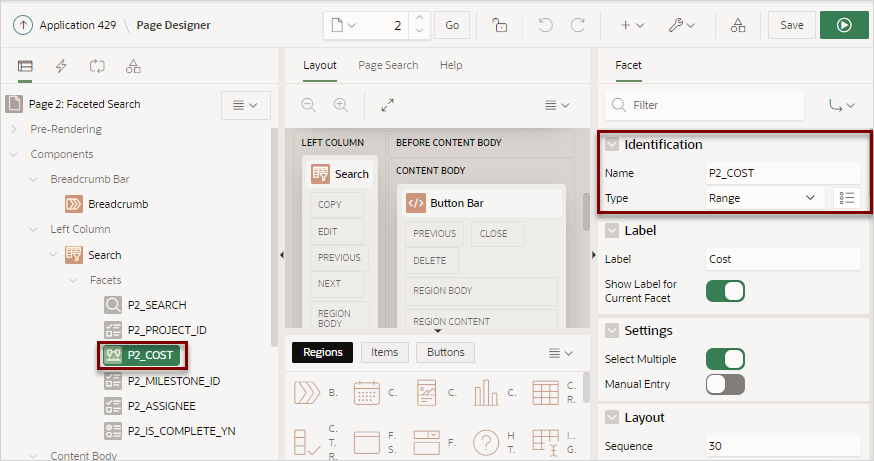
  2. In the Rendering tab (or left pane) locate the Search region and select the facet, for example P2_COST.

    In the Property Editor (or right pane) note that the Type attribute indicates that P2_COST is defined as a Range.

    Description of cost_facet.png follows
    Description of the illustration cost_facet.png
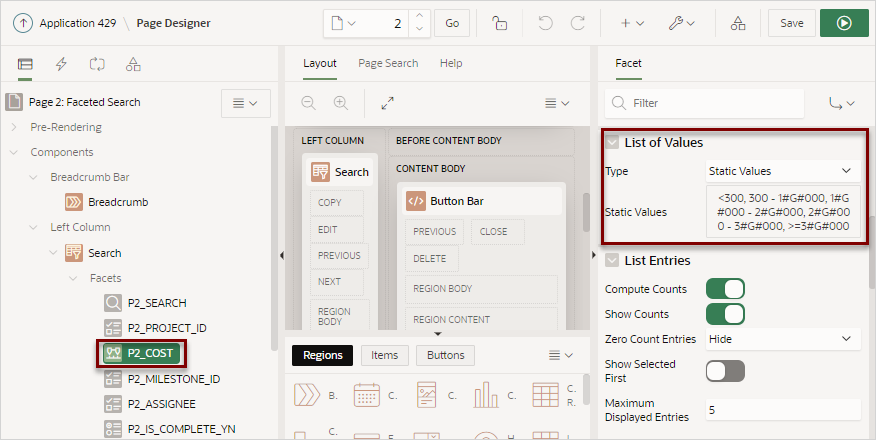
  3. Edit the List of Values:
    1. Find the List of Values group.
    2. Click Static Values.
      Description of select_static_values.png follows
      Description of the illustration select_static_values.png

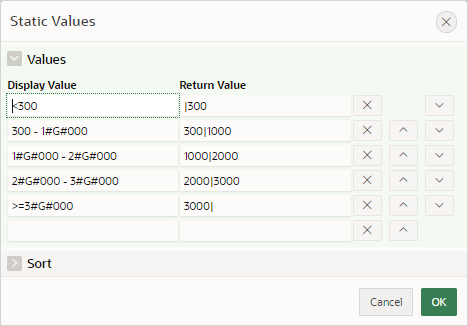
      The Static Values dialog appear.

      Description of static_values_dialog.png follows
      Description of the illustration static_values_dialog.png

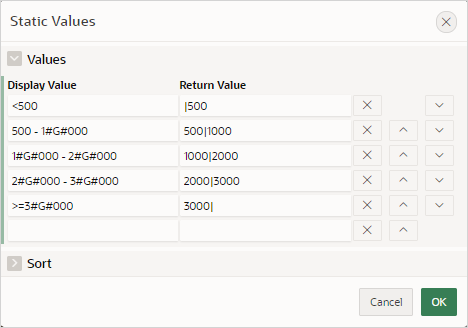
      To avoid hard-coding a specific separator in the Display Value, the Static Values dialog uses substitution strings which are replaced with the appropriate NLS separator at runtime.

      In this example, the substitution string #G# is replaced with the NLS Group Separator, comma (,). Other lists can include a #D# substitution string which is replaced at runtime with the NLS Decimal Separator.

      Therefore, in this example 1#G#000 - 2#G#000 displays at runtime as 1,000 – 2,000.

    3. Update the Display Values and Return Values of the first two facets to use increments of 500:
      • Row 1:

        • Display Value - Update <300 to <500

        • Return Value - Update |300 to |500

      • Row 2:

        • Display Value - Update 300 - 1#G#000 to 500 - 1#G#000

        • Return Value: Update 300|1000 to 500|1000

      Description of static_values_dialog_new.png follows
      Description of the illustration static_values_dialog_new.png
    4. Click Ok to accept the changes.
  4. Review your changes. Click Save and Run Page.

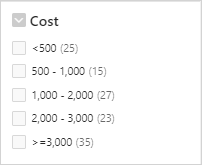
    The revised facets search page displays. Note the first two facets in the Cost list display as <500 and 500 - 1,000.

    Description of cost_list_new.png follows
    Description of the illustration cost_list_new.png