6 Developing the Milestones Page

Use the Create Page Wizard and Page Designer to add an interactive grid page to the application so that users can manage project Milestones.

In this lesson, you use the Create Page Wizard to add a new interactive grid page. Similar to the older interactive report, interactive grids do not require a paired form page to change the content displayed on the page.

In addition to the DEMO_PROJECTS table, the app also contains the DEMO_MILESTONES and DEMO_TASKS tables. These two tables contain data for incremental milestones and tasks that help to track the progress of an entire project more precisely.

Currently, your app only supports changes to the status of entire projects. Develop the Milestones interactive grid so that your users can view and change the status of these tasks and milestones.

Add and configure a Milestones entry in the Desktop Navigation Menu so it displays across the entire app.

Use Dynamic LOVs (or lookups) to intelligently substitute information from another table by checking against the ID of the content in the original table.

Repeat some familiar tasks to clean up both the report and form in Page Designer and in the runtime.

Starting from here:

6 - Milestones.sql

If you have not completed the previous lessons, you can use the appendix "Importing an Application into a Workspace" to import the above SQL script into your workspace and continue working from this lesson forward. You can find this script in the /files subdirectory of where you unzipped the .zip file accompanying this tutorial.

6.1 Creating an Interactive Grid Page

Start by using the Create Page Wizard to add a new page.

To add an interactive grid page to the application:

  1. On the Application home page, click Create Page.

    The Create Page Wizard displays.

  2. Click Report.
  3. Click Interactive Grid.
  4. Enter the following:
    1. Page Number - enter 5
    2. Page Name - enter Milestones
    3. Click Next.
  5. For Navigation Menu, click Create a new navigation menu entry.
  6. Use the default settings and click Next.
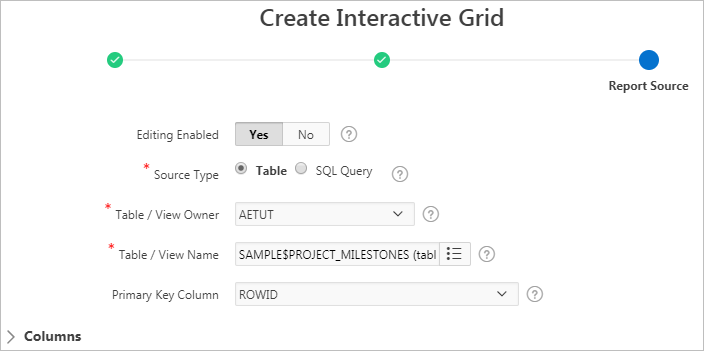
  7. For Report Source, enter the following:
    1. Editing Enabled - select Yes
    2. Table / View Name - click the LOV icon and select SAMPLE$PROJECT_MILESTONES (table)
    3. Click Create.

    The new Milestones page loads in Page Designer.

  8. Click Save and Run Page.
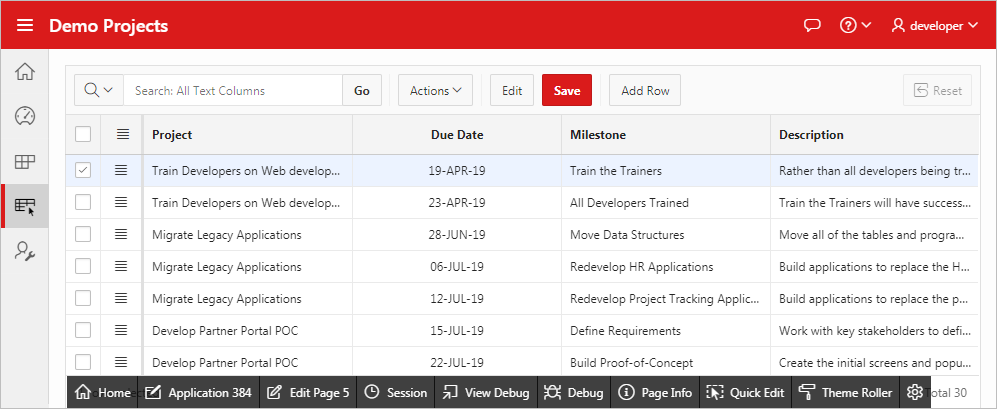
The Milestones report displays in the runtime.

6.2 Updating the Navigation Menu for Milestones

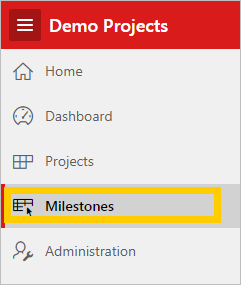
On the Milestones page in the runtime, examine the Milestones entry in the navigation sidebar. Note that the icon is blank and that it is listed below Administration.

Elements that appear on all pages (such as the Navigation Menu) are controlled in Shared Components.

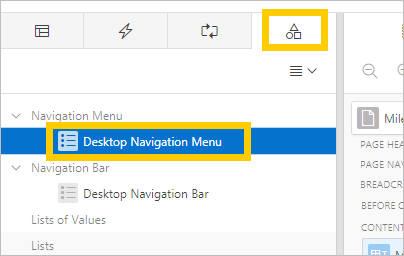
To view the Navigation Menu in Shared Components:

  1. Click Edit Page 5 on the Runtime Developer toolbar to return to Page Designer.
  2. Do one of the following:

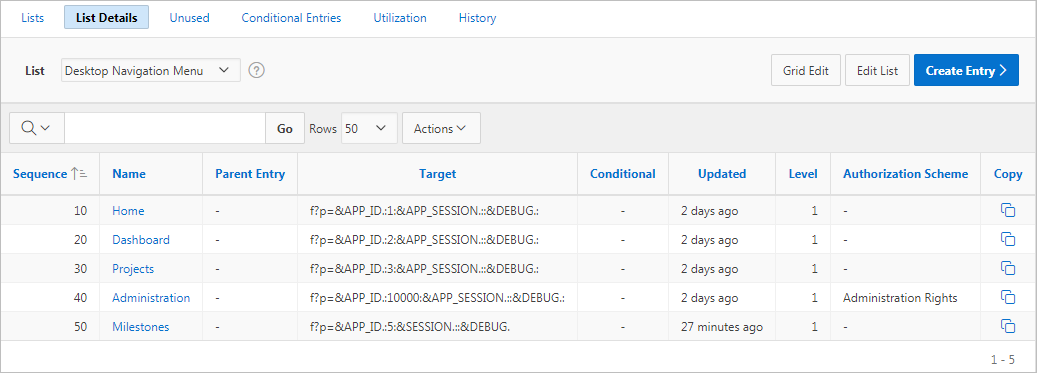
Since the Milestones page was created after the application, it is automatically added to the bottom of the list. As a best practice, you should separate developer-only pages from the other pages rather than mix them together. Update the sequence for both Administration and Milestones for them to appear in the right order.

To update the sequence for the Administration list entry:

  1. Click Administration.
  2. Enter the following:
    1. Sequence - enter 999

      Setting the sequence to such a high number helps ensure Administration always appears at the bottom of the list when adding pages in the future.

    2. Click Apply Changes.

Next, update the sequence and the icon from the blank default for Milestones.

To update the Milestones list entry:

  1. Click Milestones.
  2. Enter the following:
    1. Sequence - enter 50

      Use 50 to stay in sync with the page number (5).

    2. Image/Class - click the LOV icon and select fa-table-pointer

      Tip:

      Use the search function in your browser to find the icon easily (Ctrl + F or Cmd + F).

    3. Click Apply Changes.
  3. Click the Run icon (Run icon) in the top-right corner to run the app. Note the changes to the navigation sidebar.

6.3 Hiding Columns in the Application Runtime

Develop the Milestones interactive grid on page 5 in the application runtime by hiding several columns from view and moving the Due Date column.

Tip:

Oracle recommends hiding columns rather than deleting them in case you need them in the future.

In the runtime, you can hide columns using the Column Heading menu or the Actions menu.

To quickly hide a column in an interactive grid:

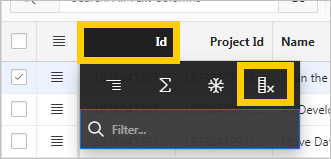
  1. Click the Id column heading and select Hide.

To hide multiple columns in an interactive grid:

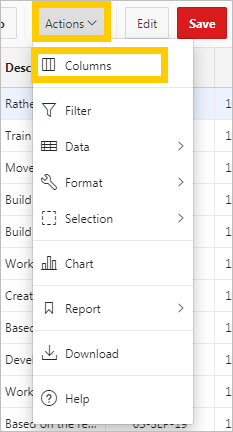
  1. Click the Actions menu and select Columns.
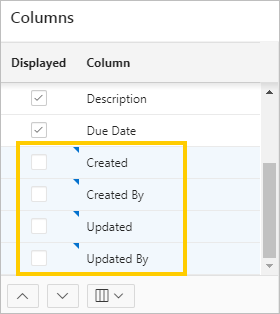
  2. In the list of columns on the left, click the check boxes adjacent to the following columns to deselect them:
  3. Click Save.
  4. To move a column, do one of the following:
    • Drag and Drop Column Heading

      1. Hover the mouse over the Due Date column heading. Note the thin dotted columns that display at the start of the heading. These are the grip handle.

      2. Click and hold the grip handle and drag and drop the Due Date column between Project Id and Name.

    • Columns Dialog in Actions Menu

      1. Click the Actions menu and select Columns.

      2. Click the Due Date column to select it. (Do not click the check box.)

      3. Use the Move Up and Move Down buttons below the list to move Due Date below Project Id.

      4. Click Save.

To save your changes to the report:

  1. Click Actions, select Report, and click Save.

6.4 Adding Project Names to the Milestones Interactive Grid

While the Milestones interactive grid is based on SAMPLE$PROJECT_MILESTONES, note that none of the columns provide alphabetical names for the projects. Project names are stored in another table: the NAME column in SAMPLE$PROJECTS. Report regions can query other tables with a Dynamic LOV. This is also called a lookup.

First, create the Dynamic LOV in Shared Components and configure it to query SAMPLE$PROJECTS.

Then use Page Designer to convert the PROJECT_ID column to a Select List, and choose the Dynamic LOV / lookup to display the alphanumerical name of the referenced project instead of the numerical ID.

To return to Page Designer:

  1. Click Edit Page 5 on the Runtime Developer Toolbar.

To create a new Dynamic LOV lookup:

  1. Click the Shared Components icon (Shared Components).
  2. Under Other Components, click List of Values.
  3. Click Create.
  4. Select From Scratch and click Next.
  5. For Name and Type:
    1. Name - enter Project Name
    2. Type - select Dynamic
    3. Click Next.
  6. Delete the Query contents then copy and paste the following code:
    select NAME d, ID r
    from SAMPLE$PROJECTS
    order by NAME
  7. Click Create List of Values.

    The Lists of Values screen redisplays with the Project Name item.

  8. Click the Edit Page 5 icon in the top-right to return to the Milestones page in Page Designer.
    Edit Page 5

To convert a column to a Select List:

  1. In the Rendering tab, under Milestones, expand Columns and select PROJECT_ID.
  2. In Property Editor:
    1. Identification: Type - select Select List
    2. Heading: Heading - enter Project
    3. List of Values: Type - select Shared Component
    4. List of Values: List of Values - select Project Name
    5. List of Values: Display Extra Values - check No
    6. List of Values: Null Display Value - enter the following:
      - Select Project -
  3. Click Save and Run Page.
  4. Review your changes to the Project column in the Runtime. When finished, click Edit Page 5 to return to Page Designer.

6.5 Changing the Appearance of an Interactive Grid in Page Designer

Perform some routine clean-up tasks to make the interactive grid more user-friendly:

  • Change the heading of the Name column to instead refer specifically to Milestones.

  • Convert the audit columns to Display Only to prevent end users from changing the contents.

  • Change the Appearance Template of the interactive grid to the template for interactive reports. This removes the header and some UI decorations to simplify the look.

To change a column heading:

  1. In the Rendering tab, under Milestones, expand Columns.
  2. Select NAME.
  3. In Property Editor:
    1. Identification: Type - select Text Field
    2. Heading: Heading - enter Milestone

To change multiple columns to Display Only:

  1. Hold Ctrl and select the following items:
    1. CREATED
    2. CREATED_BY
    3. UPDATED
    4. UPDATED_BY
  2. In Property Editor:
    1. Identification: Type - select Display Only

To change the Appearance Template for a region:

  1. In the Rendering tab, under Content Body, select the Milestones region.
  2. In Property Editor:
    1. Appearance: Template - select Interactive Report
  3. Click Save and Run Page to enter the runtime.

6.6 Finalizing the Milestones Interactive Grid in the Runtime

Perform some routine clean-up tasks to complete the default Milestones report:

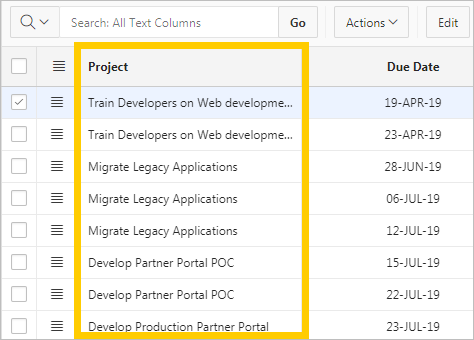
  • Sort the report so that it displays projects alphabetically.

  • Save your changes to the report layout as the new default.

To set multiple columns to sort ascending:

  1. Hover over the Project column heading and click the Sort Ascending icon (up arrow).
  2. Hold the Shift key, hover over the Due Date column heading, and click the Sort Ascending icon (up arrow).

    Icons display next to the Project and Due Date column names indicating their sort order.


To save the report layout as the new default:

  1. Click the Actions menu, select Report, and select Save.

    You cannot use the Save button at the top of the report for this step because it does not overwrite the report default.

  2. Click Application ##### on the Runtime Developer toolbar to return to the Application home page.

The Milestones page is complete. Proceed to the next lesson.