8.7.5 Managing Interactive Grid Attributes

Edit interactive grid Attributes to control how an interactive grid works.

8.7.5.1 Editing Interactive Grid Attributes

To edit interactive grid Attributes:

  1. View the page in Page Designer:
    1. On the Workspace home page, click the App Builder icon.
    2. Select an application.
    3. Select a page.
    Page Designer appears.
  2. In the Rendering tab, select the region containing the interactive grid.
  3. In the Property Editor, select the Attributes tab.

    The Property Editor displays the attributes. Attributes are organized in groups.

    Tip:

    To find a group or attribute, enter keywords in the Filter Properties field. The Property Editor displays the group or attributes. Or, you can click Go to Group and select the group.

  4. Edit the appropriate attributes.

    Tip:

    To view help for an attribute, select the attribute in the Property Editor and click the Help tab in the central pane.

  5. To save your changes click Save. To save and run the page, click Save and Run Page.

8.7.5.2 Making an Existing Interactive Grid Editable

End users can alter the report layout of an interactive grid using Column menus and sort options, rearrange columns by dragging and dropping, and change how data displays using options on the Actions menu. However, developers determine whether the underlying data is read-only or editable by users. When an interactive grid is editable, end users can edit the underlying data, add rows, delete rows, and refresh rows. By default, editable interactive grids include a Save button on the toolbar.

To make an interactive grid editable:

  1. View the page in Page Designer:
    Page Designer appears.
  2. In the Rendering tab, select the region containing the interactive grid.
  3. In the Property Editor, select the Attributes tab.
    The Property Editor displays the attributes. Attributes are organized in groups
  4. In the Property Editor Attributes tab, find the Edit group and update the following attributes:
    1. Enabled - Select On.
      Selecting On automatically creates a process to process the records.
    2. Allowed Operations - Select supported data manipulation operations. Options include: Add Row, Update Row, Delete Row
    3. Allowed Row Operations Column - Select a column where the column value indicates if the row can be updated and/or deleted.
    4. Lost Update Type - Select how to protect data against lost updates.

      Lost updates occur when two or more users try to update the same data, and the last update overwrites updates made by the previous user. To prevent this, updates can check the existing column value(s) in the database with the value(s) retrieved when the record was originally queried. For an example, see Page Designer Help.

      Lost Update Type options include:

      • Row Values - A checksum value is calculated for each row, when initially querying the data. The checksum is calculated by concatenating all of the updateable columns into a string and then generating a unique value. When committing the updated record, this checksum is compared to the checksum value.

      • Row Version Column - If your database table includes a column which is incremented every time a record is updated, preferably by a database trigger, then this column can be used instead of calculating checksums. Oracle does not recommend this option if your interactive grid updates data in multiple tables.

    5. Add Row If Empty - Specify whether to add a new row if the interactive grid currently has no records returned. When enabled, the No Data Found message never displays since there will always be at least one record.  If no updates are made to the record that was added it will not be inserted when the region is saved.
  5. To save your changes click Save. To save and run the page, click Save and Run Page.

8.7.5.3 Controlling Interactive Grid Pagination

Pagination provides the end user with information about the number of rows displayed and the current position within the result set.

To change interactive grid pagination:

  1. View the page in Page Designer:
    1. On the Workspace home page, click the App Builder icon.
    2. Select an application.
    3. Select a page.
    Page Designer appears.
  2. In the Rendering tab, locate the region containing the interactive grid.
  3. Under the region, select the Attributes node.

    The Property Editor displays the attributes. Attributes are organized in groups.

    Tip:

    To find a group or attribute, enter keywords in the Filter Properties field. The Property Editor displays the group or attributes. Or, click Go to Group and select the group.

  4. Find Pagination.

    Pagination attributes provide the end user with information about the number of rows displayed and the current position within the result set.

    Tip:

    To view help for an attribute, select the attribute in the Property Editor and click the Help tab in the central pane.

  5. Under Pagination, edit the following attributes:
    1. Type - Select an option:
      • Page - Rows display based on what the end users select in the Actions menu, Format, Rows per Page option. If there are additional rows, controls are added to the report footer which enables users to navigate forwards and backwards between row sets.

      • Scroll - Rows display to fill the height of the interactive grid. As the end user scrolls, additional rows display as needed.

    2. Show Total Row Count - Select Yes or No.
      Selecting Yes displays the total row count in the report footer. Enabling this option requires an additional query which may hinder performance on very large data sets
  6. To save your changes click Save. To save and run the page, click Save and Run Page.

8.7.5.4 Customizing the Interactive Grid Toolbar

All interactive grids include a toolbar at the top of the page. Developers can customize what controls display on the toolbar or remove it.

Note:

Some of the options described in this procedure only apply if the interactive grid is editable. See "Making an Existing Interactive Grid Editable".

To customize the interactive grid toolbar:

  1. View the page in Page Designer:
    1. On the Workspace home page, click the App Builder icon.
    2. Select an application.
    3. Select a page.
    Page Designer appears.
  2. In the Rendering tab, locate the region containing the interactive grid.
  3. Under the region, select the Attributes node.

    The Property Editor displays the attributes. Attributes are organized in groups.

    Tip:

    To find a group or attribute, enter keywords in the Filter Properties field. The Property Editor displays the group or attributes. Or, click Go to Group and select the group.

  4. In the Property Editor, find the Toolbar group and edit the following:
    1. Show - Select Yes or No to determine if a toolbar displays above the report.
    2. Controls - Configure the following:
      • Search Column Selection - Enables search for the selected colum.
      • Search Field - Enables search for the selected field.
      • Actions Menu - Select this option to include the Actions menu in the report.
      • Reset - Removes any customizations (such as filters, column width, ordering, and so on) and reloads the report definition from the server.
      • Save Button - Saves changes made to the interactive grid, without needing to save the whole page. The Save button only displays when an interactive grid is editable and the end user has authorization to add, update or delete.
    3. Add Button Label only displays when the interactive grid is editable. For Add Button Label, enter an alternative label for the Add button. The default label is Add Row.
  5. To save your changes click Save. To save and run the page, click Save and Run Page.

8.7.5.5 Enabling Users to Save Interactive Grid Public Reports

Users can save an interactive grid as a Public report if the report developer enables that capability. Public reports display in a select list of available reports on the toolbar and are available to all users. However, only the user who creates a Public report can save, rename, or delete it. You can further restrict who can save Public repots by selecting an authorization scheme.

Tip:

The Save Public Report attribute is only available to authenticated users and can be further restricted by the defined Authorization scheme. See "Establishing User Identity Through Authentication."

To enable end users to save Public reports:

  1. View the page in Page Designer:
    Page Designer appears.
  2. In the Rendering tab, select the region containing the interactive grid.
  3. In the Property Editor, select the Attributes tab.
    The Property Editor displays the attributes. Attributes are organized in groups
  4. In the Property Editor, find the Enable Users To group and edit the following:
    1. Save Public Report - Select On. Selecting Off enables users to save the current report as a Public report.
    2. Save Public Report Authorization - Only displays if Save Public Report is set to On. Select an authorization scheme to restrict who can save public report definitions. To enable an end user to save a public report, this authorization scheme must evaluate to TRUE for that user. If you do not select an authorization scheme, then any user may save public reports.
  5. To save your changes click Save. To save and run the page, click Save and Run Page.

8.7.5.6 Enabling Flashback and Charts

Developers can enable flashback queries and support for Chart view by editing the interactive grid Attributes, Flashback and Defiine Chart View

To enable Flashback or Define Chart View:

  1. View the page in Page Designer:
    Page Designer appears.
  2. In the Rendering tab, select the region containing the interactive grid.
  3. In the Property Editor, select the Attributes tab.
    The Property Editor displays the attributes. Attributes are organized in groups
  4. In the Property Editor, find the Enable Users To group and edit the following:
    1. Flashback - Specify whether end users can utilize flashback queries for this interactive grid.

      Flashback queries utilize the Oracle Flashback Technology and Database Point-in-Time Recovery to view data as it existed at a previous point in time. Users can only query this data, but can not rewind any data changes. How far back in time they can successfully perform a flashback query is determined by when the redo log files were last switched within the Oracle database, as this technology utilizes the RMAN backup.

    2. Define Chart View - Specify whether end users can define a chart for this interactive grid.
  5. To save your changes click Save. To save and run the page, click Save and Run Page.

8.7.5.7 Configuring Interactive Grid Download Formats

To configure interactive grid download formats:

  1. View the page in Page Designer:
    Page Designer appears.
  2. In the Rendering tab, select the region containing the interactive grid.
  3. In the Property Editor, select the Attributes tab.
    The Property Editor displays the attributes. Attributes are organized in groups
  4. In the Property Editor Attributes tab, find Enable User To and edit the following:
    • Download - Select On.

    Tip:

    Setting Download to Off prevents the Download menu from displaying on the Actions menu. To fully prevent users from downloading data, deselect all Download Formats described in the next step.

  5. Find Download and edit the following:
    1. Authorization - Select an authorization scheme to restrict who can download. To enable an end user to download, this authorization scheme must evaluate to TRUE for that user.
    2. Download Formats - Select download formats:
      • CSV

      • HTML

      • PDF

      • Excel

    3. Send as Email - Specify whether end users can send an email, with the report download included as a HTML attachment.

      Email is only available to authenticated users, and requires the SMTP to be configured within Application Express Administration Services application (Administration Services), by an Instance Administrator.

    4. CSV Separator - (CSV only) Define the column separator. If no value is entered, a comma or semicolon is used depending on your current NLS settings.
    5. CSV Enclosed By - (CSV only) Enter a delimiter character. This character delineates the starting and ending boundary of a data value. Default delimiter is double quotation marks (" ").
    6. Filename - Enter a name for the downloaded document. Do not specify a file extension, the extension is added automatically. If you leave this blank, the region name is used as the file name.
    7. Supplemental Text - Enter text that displays at the top of the download file. Use this attribute to for data classification, legal, or warning messages about the data in the file.

      WARNING:

      Do not use the Supplemental Text attribute with CSV download. If you enable CSV download, the defined text will invalidate the CSV file format.

  6. To save your changes click Save. To save and run the page, click Save and Run Page.

8.7.5.8 Enabling Icon View in an Interactive Grid

Interactive grids support different views of data. By default, interactive grids display data in a Grid view. Developers can optionally display data as icons. Enabling Icon view adds an Icon button to the select view button group.

8.7.5.8.1 About Icon View in an Interactive Grid

Interactive grids support different views of data. Users can switch between these views by clicking the buttons in the select view button group. The following illustration shows an interactive grid with Icon view enabled and the Icon button selected. To enable Icon view, you must identify the columns used to identify the icon, the label, and the target (that is, the link).

Description of ig_icon_view.png follows
Description of the illustration ig_icon_view.png

Viewing a Working Example of Icon View

To see a working example of this Icon view, install the sample application, Sample Interactive Grids and review Reporting, Icon and Detail Views .

8.7.5.8.2 Adding Icon View to an Interactive Grid

An important requirement of icon view is that each item in the view must have the same width and height and the item content must not overflow. The width and height are set with CSS rules on elements with a class of a-IconList-item.

To add an Icon view to an interactive grid:

  1. View the page in Page Designer:
    Page Designer appears.
  2. In the Rendering tab, select the region containing the interactive grid.
  3. In the Property Editor, select the Attributes tab.
    The Property Editor displays the attributes. Attributes are organized in groups
  4. In the Property Editor Attributes tab, find the Icon View group and edit the following:
    1. Show - Specify whether the Icon View is enabled. Select On.
    2. Custom - Select On. Selecting On provides full control over the icon view item markup but also requires a full understanding of HTML markup.
    3. Icon Type - Select the column type that holds the icon image source. Select Icon CSS Classes. You must also add a column to your SQL statement that has a value that is a CSS class for an icon (for example, a Font APEX icon class name). As an alternative, you can also select Image in URL and then specify the column that contains the URL and Icon Attributes.
    4. Icon - Select the interactive grid column that returns the CSS classes for the icon image source.
    5. Link Target - Click No Link Defined to display the Link Builder - Link Target dialog. The link target defined is followed when the user activates the icon link with mouse or keyboard.
    6. Link Attributes - Enter HTML attributes that are associated with the display of each Link Target.
    7. Label Column - Select the report column that returns the image label.
  5. To save your changes click Save. To save and run the page, click Save and Run Page.

8.7.5.8.3 Adding a Custom Icon View Link to an Interactive Grid

A custom Icon View link provides greater flexibility in defining the content of the Icon View, including the ability to utilize more than one column.

To add custom Icon View link to an interactive grid:

  1. View the page in Page Designer:
    Page Designer appears.
  2. In the Rendering tab, select the region containing the interactive grid.
  3. In the Property Editor, select the Attributes tab.
    The Property Editor displays the attributes. Attributes are organized in groups
  4. In the Property Editor Attributes tab, find the Icon View group and edit the following:
    1. Show - Select On.
    2. Custom - Select Off. Selecting On provides full control over the icon view item markup but also requires a full understanding of HTML markup..
    3. Icon Type - Select the column type that holds the icon image source. Select Icon CSS Classes. You must also add a column to your SQL statement that has a value that is a CSS class for an icon (for example, a Font APEX icon class name). As an alternative, you can also select Image in URL and then specify the column that contains the URL and Icon Attributes.
    4. Icon - Select the interactive grid column that returns the CSS classes for the icon image source.
    5. Link Target - Click No Link Defined to display the Link Builder - Link Target dialog. The link target defined is followed when the user activates the icon link with mouse or keyboard.
    6. Link Attributes - Enter HTML attributes that are associated with the display of each Link Target.
    7. Label Column - Select the report column that returns the image label.
  5. To save your changes click Save. To save and run the page, click Save and Run Page.

8.7.5.9 Enabling Detail View in an Interactive Grid

Interactive grids support different views of data. By default, interactive grids display data in a Grid view. Developers can optionally display data as in a Detail view. Enabling Detail view adds an Detail button to the select view button group.

8.7.5.9.1 About Detail View in an Interactive Grid

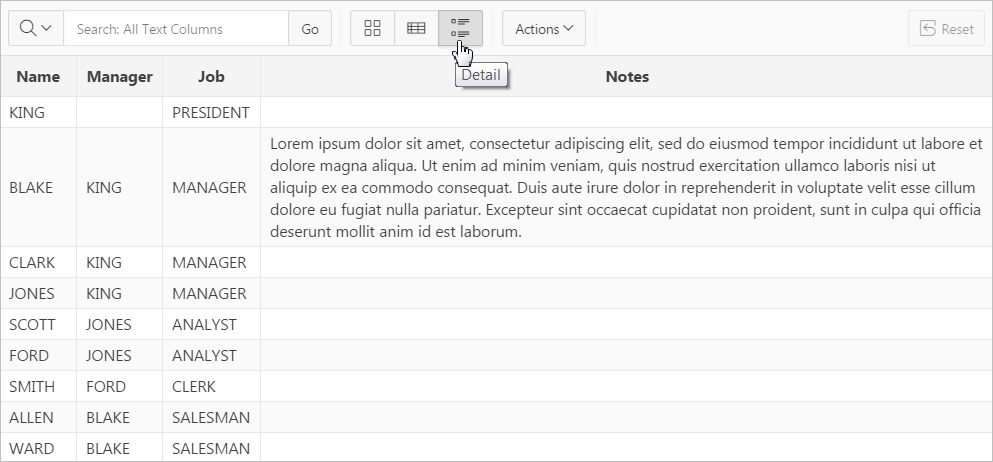
Interactive grids support different views of data. Users can switch between these views by clicking the buttons in the select view button group. The following illustration shows an interactive grid with Detail view enabled and the Detail button selected. Detail view displays column values using developer defined HTML markup as shown in the following illustration.
Description of ig_detail_view.png follows
Description of the illustration ig_detail_view.png

8.7.5.9.2 Adding a Detail View to an Interactive Grid

To add a Detail view to an interactive grid:

  1. View the page in Page Designer:
    Page Designer appears.
  2. In the Rendering tab, select the region containing the interactive grid.
  3. In the Property Editor, select the Attributes tab.
    The Property Editor displays the attributes. Attributes are organized in groups
  4. In the Property Editor Attributes tab, find the Detail View group and edit the following:
    1. Show - Select On.
    2. Before Rows - Enter the HTML to be displayed before report rows.
    3. For Each Row - Enter the HTML template to use for each report row in the Detail View. Use #COLUMN_NAME# substitution strings for column names and column labels.

      The following substitution strings are available:

      • &COLUMN_NAME. - substitution strings for column labels and names.

      • &APEX$ROW_ID. - the record identifier for the row.

      • &APEX$ROW_INDEX. - the record display sequence number.

      Example:

      <tr><td align="right">&ENAME_LABEL.:</td><td>&ENAME.</td></tr> <tr><td align="right">&JOB_LABEL.:</td><td>&JOB.</td></tr>
    4. After Rows - Enter the HTML to be displayed after report rows.
  5. To save your changes click Save. To save and run the page, click Save and Run Page.