Oracle Performance Analyzer
Oracle Performance Analyzer examines the use of an Oracle database over a specified period of time and provides recommendations to improve the performance of the database applications used during that time frame. In some cases, the recommendations can be automatically implemented by clicking a button.
Requirements for setting up Oracle Performance Analyzer and a walkthrough showing how to use it are located in the Performance Tuning section. See: About Oracle Performance Analyzer and Using the Oracle Performance Analyzer.
Starting the Oracle Performance Analyzer
From Server Explorer, select a SYSDBA database connection that represents the database to be tuned. Right-click, and from the menu, select the Oracle Performance Analyzer to launch the designer.
The analyzer appears as follows:
The top of the designer contains the following controls:
| Control | Description |
|---|---|
|
Connection name |
Displays the connection that the analyzer was launched from. |
|
Run for (hrs:min) |
Enter the hours and minutes that the analyzer is to run. The analyzer requires least 5 minutes of run time to generate any results. |
|
Start |
Starts the analyzer. |
|
Performance Analysis Tab |
Displays the performance analysis tree on the left and performance analysis summary on the right after the analyzer completes. |
Performance Analysis Tab
The performance analysis tab has a tree control and an informational section on the right that displays either a summary or details depending on what section of the tree you select.
The performance analysis tree appears similar to the following:
Performance Analysis Summary
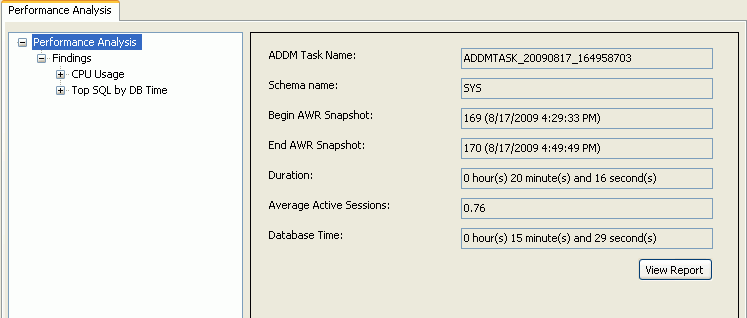
When the root of the Performance Analyzer tree is selected, the completed Performance Analysis summary appears on the right, similar to the following:
The performance analysis summary controls are as follows:
| Control | Description |
|---|---|
|
ADDM Task Name |
Displays the ADDM Task Name. |
|
Schema Name |
Displays the schema. |
|
Begin AWR Snapshot: |
Displays the period start time. |
|
End AWR Snapshot: |
Displays the period end time |
|
Duration (min) |
Displays the length of time the analyzer has run, in minutes. |
|
Average Active Session |
Displays the average of active database sessions during this period. |
|
Database Time |
Database time is a indicator of the total database workload. It represents the total time spent in database calls. |
|
View Report |
Opens the ADDM Advisor report in a text editor which can then be modified and saved to a text file, if desired. |
Findings Node
The Findings Node is a collection of nodes about findings that the Oracle Performance Analyzer generates.
For more information about ADDM findings, see section 6.1.1 ADDM Analysis, in Oracle Database Performance Tuning Guide.
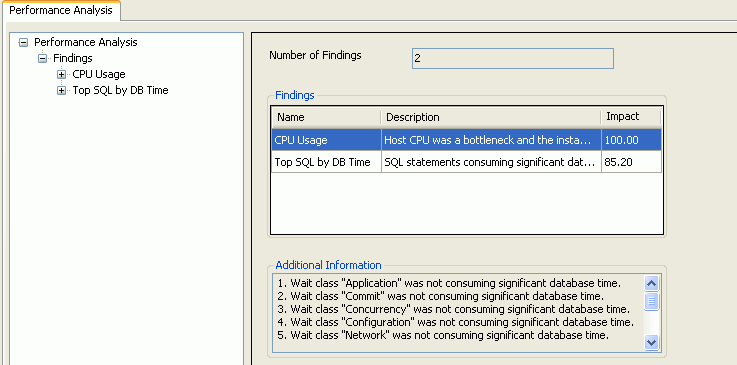
When the Findings Node of the tree is selected, the Findings details appears similar to the following:
The Findings node controls are as follows:
| Control | Description |
|---|---|
|
Number of Findings |
Displays the number of findings. |
|
Findings |
Lists the findings, their descriptions, and impact as a percent. |
|
Additional Information |
Contains general information and warnings pertaining to the findings. If there is insufficient database activity to successfully analyze performance, a message appears in the Additional Information section indicating this. Repeat the test with greater database activity and/or longer run time. |
Individual Findings Node
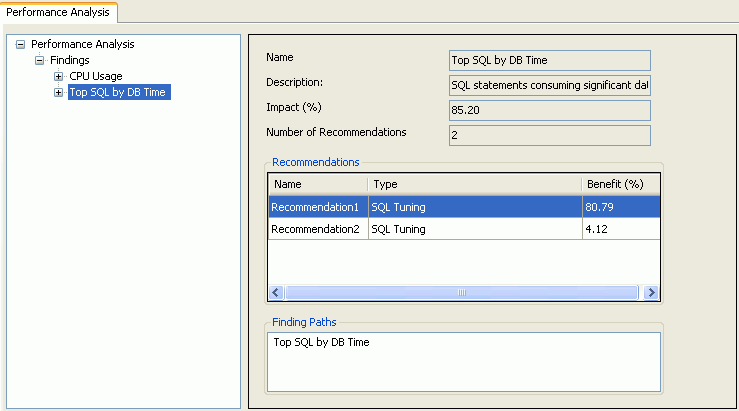
When you select an individual finding node of the tree, the finding node details appear similar to the following:
The individual findings node controls are as follows:
| Control | Description |
|---|---|
|
Name |
Displays name of the finding selected in the Findings node of the tree. |
|
Description |
Describes the finding selected. |
|
Impact (%) |
Displays the impact of the finding selected as a percent. |
|
Number of Recommendations |
Indicates the number of recommendations for the finding selected. |
|
Recommendations |
Lists the recommendations, their types, and the estimated benefit, as a percent of |
|
Finding Paths |
Displays the path that the Performance Analyzer used to arrive at this finding. |
Recommendation Node
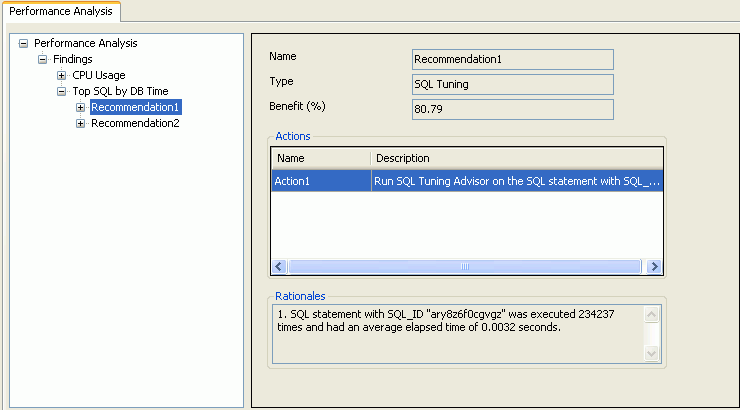
When the Recommendations node of the tree is selected, the Recommendation node details appears similar to the following:
| Control | Description |
|---|---|
|
Name |
Lists name of the recommendation. |
|
Type |
Lists recommendation type, such as SQL Tuning. |
|
Benefit (%) |
Lists the expected benefit as a percent. |
|
Actions |
Lists the potential actions with their descriptions. |
|
Rationales |
Lists the rationales for the recommendation. Rationales explain why the set of actions are recommended and provides additional information to implement the suggested recommendation. |
Action Node
The Action node provides recommendations on how to correct a performance problem. When an Action node of the tree is selected, the following two tabs may appear, in certain scenarios.
-
The SQL tab
-
The Tune SQL tab
For example, an Action node for a SQL Tuning recommendation may initially appear as follows:
If Tune SQL button appears as part of a recommendation and is clicked, the Tune SQL tab appears similar to the following:
The Action node controls are as follows:
| Control | Description |
|---|---|
|
Action Name |
Displays the name of the action selected in the tree. |
|
Description |
Displays a description of the action. |
|
Tune SQL Button |
Runs the SQL Tuning Advisor. This control only appears if there is a recommendation to tune the SQL. SQL Tuning may take some time to complete and during this time the button changes to Cancel. The Cancel button can be clicked to stop the tuning. You may continue to use Visual Studio or switch to other pages in the Performance Analysis tree, however, you will not be able to tune another SQL until the first one is complete or cancelled. Please note that the Cancel operation does not abort the SQL tuning right away, instead it interrupts the process and any recommendations gathered so far will be displayed in the grid. |
|
SQL Tab |
Lists the SQL ID and SQL text of the SQL statement if there is an associated SQL. |
|
Tune SQL Tab |
Lists the recommendations for the action selected. If there are no recommendations to tune the SQL, a message appears indicating this. This is a grid that contains columns for:
|
|
Implement Recommendation |
Implements the highlighted action. If the recommendation Type is SQL Profile and there are existing SQL Profiles, you asked to OK implementing a new SQL profile that overwrites an existing one. Implement Recommendation only appears if you select a Recommendation Type of |
|
Preview SQL |
Displays SQL for the highlighted action. Preview SQL only appears if you select a Recommendation Type of |
|
View Report |
Opens the SQL Tuning Advisor report in a text editor which can then be modified and saved to a text file, if desired. |


