2.7 Data Monitoring
Data Monitoring evaluates how your data evolves over time. It helps you with insights on trends and multivariate dependencies in the data. It also gives you an early warning about data drift.
Data drift occurs when data diverges from the original baseline data over time. Data drift can happen for a variety of reasons, such as a changing business environment, evolving user behavior and interest, data modifications from third-party sources, data quality issues, or issues with upstream data processing pipelines.
The key to accurately interpret your models and to ensure that the models are able to solve business problems is to understand how data evolves over time. Data monitoring is complementary to successful model monitoring, as understanding the changes in data is critical in understanding the changes in the efficacy of the models. The ability to quickly and reliably detect changes in the statistical properties of your data ensures that your machine learning models are able to meet business objectives.
- Create: Create a data monitor.
Note:
The supported data types for data monitoring are NUMERIC and CATEGORICAL. - Edit: Select a data monitor and click Edit to edit a data monitor.
- Duplicate: Select a data monitor and click Duplicate to create a copy of the monitor.
- Delete: Select a data monitor and click Delete to delete a data monitor.
- History: Select a data monitor and click History to view the runtime details. Click Back to Monitors to go back to the Data Monitoring page.
- Start: Start a data monitor.
- Stop: Stop a data monitor that is running.
- More: Click More for additional
options to:
Figure 6-18 More option under Data Monitors
- Enable: Select a data monitor and
click Enable to enable a monitor that is
disabled. By default, a data monitor is enabled. The status is displayed
as
SCHEDULED. - Disable: Select a data monitor and
click Disable to disable a data monitor. The
status is displayed as
DISABLED. - Show Managed Monitors: Click this
option to view the data monitors that are created and managed by OML
Services REST API and Model Monitors in Oracle Machine Learning UI. The
data monitors that are managed by these two components have a system
generated name, and are indicated by specific icons against its name.
- Click on the link icon against a managed data
monitor name to view the details of the associated model
monitor. The associated model monitor details are displayed on a
separate pane that slides in. The slide-in pane displays the
model monitor name with links to view the model monitor results
and settings. Clicking on the link icon also displays the data
drift details on the lower pane of the Data Monitors page. Click
on the X on the top left corner to close the pane.
Figure 6-19 Data Monitors page displaying the associated model monitor results and settings
In this example, the slide-in pane displays the details of the model monitor Power Consumption. On the slide-in pane:
- Click Model Monitor Results to view the results computed by the model monitor — settings, models, model drift, metric, and prediction statistics. Click Monitors to return to the Data Monitors page. See View Model Monitor Results.
- Click Model Monitor Settings to view and edit the settings, details, and models monitored by the model monitor on the Edit Model Monitor page. Click Cancel to return to the Data Monitors page. Click Save to save any changes.
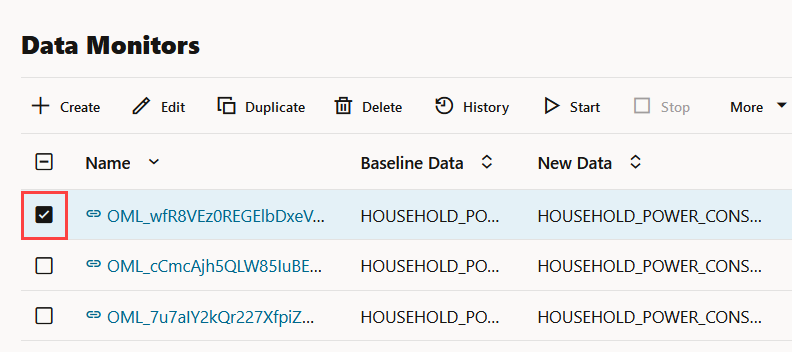
- Click on the check box against the data monitor name to view the data drift values on the lower pane.
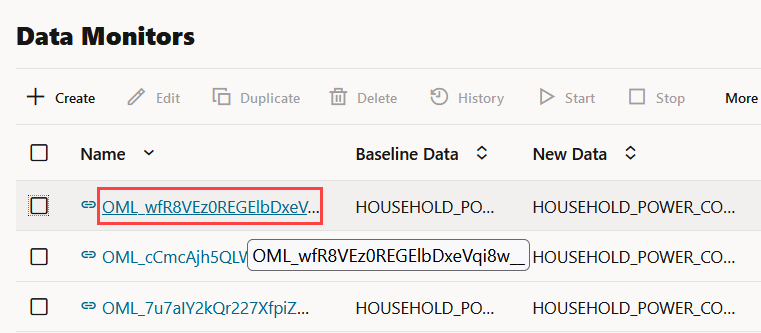
- Click on the data monitor name to view the details of the data monitor — settings, data drift values and monitored features.
- Click on the link icon against a managed data
monitor name to view the details of the associated model
monitor. The associated model monitor details are displayed on a
separate pane that slides in. The slide-in pane displays the
model monitor name with links to view the model monitor results
and settings. Clicking on the link icon also displays the data
drift details on the lower pane of the Data Monitors page. Click
on the X on the top left corner to close the pane.
- Enable: Select a data monitor and
click Enable to enable a monitor that is
disabled. By default, a data monitor is enabled. The status is displayed
as
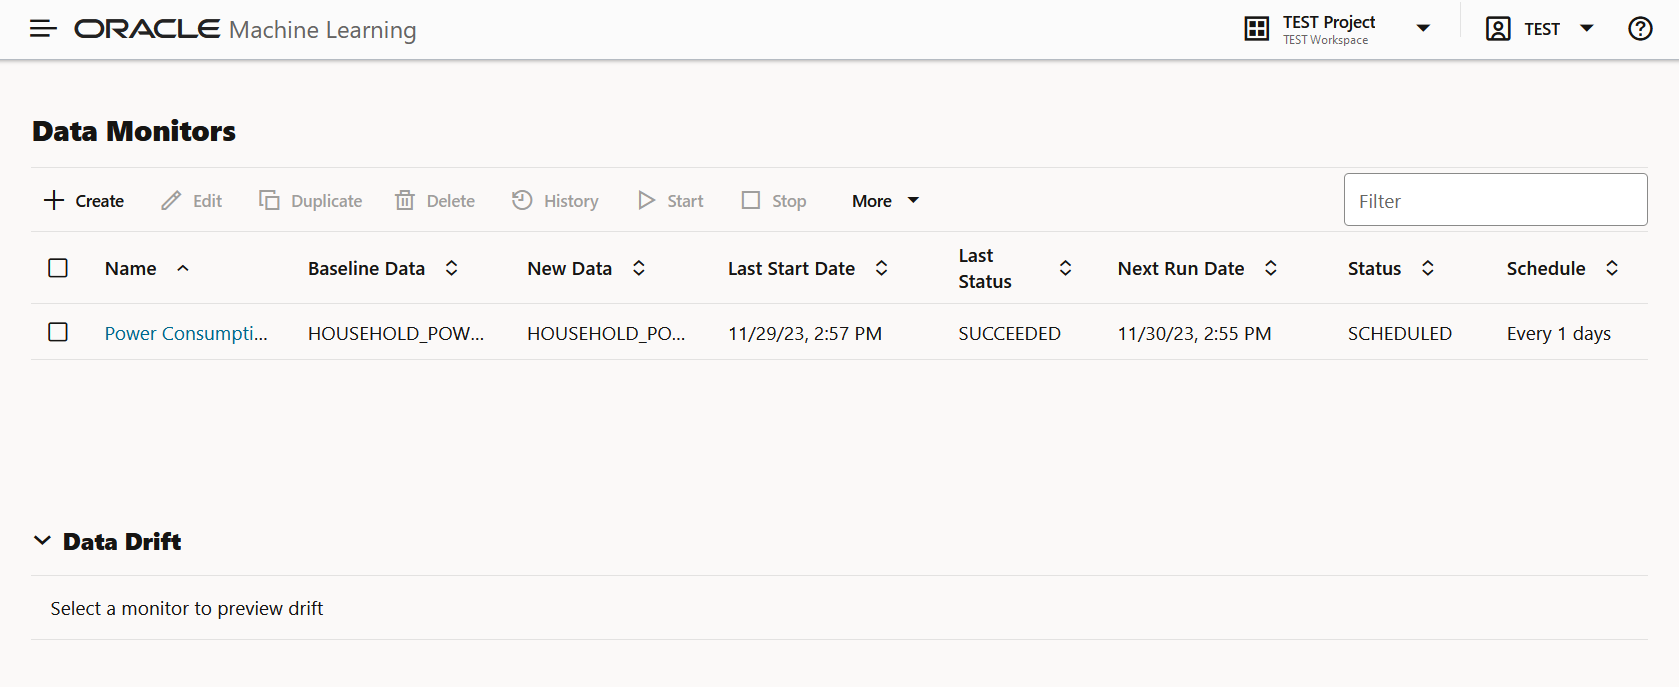
The Data Monitors page displays the information about the selected monitor: Monitor name, Baseline Data, New Data, Last Start Date, Last Status, Next Run Data, Status, and Schedule. The page also displays the data drift, if the data monitor has run successfully. To view data drift:
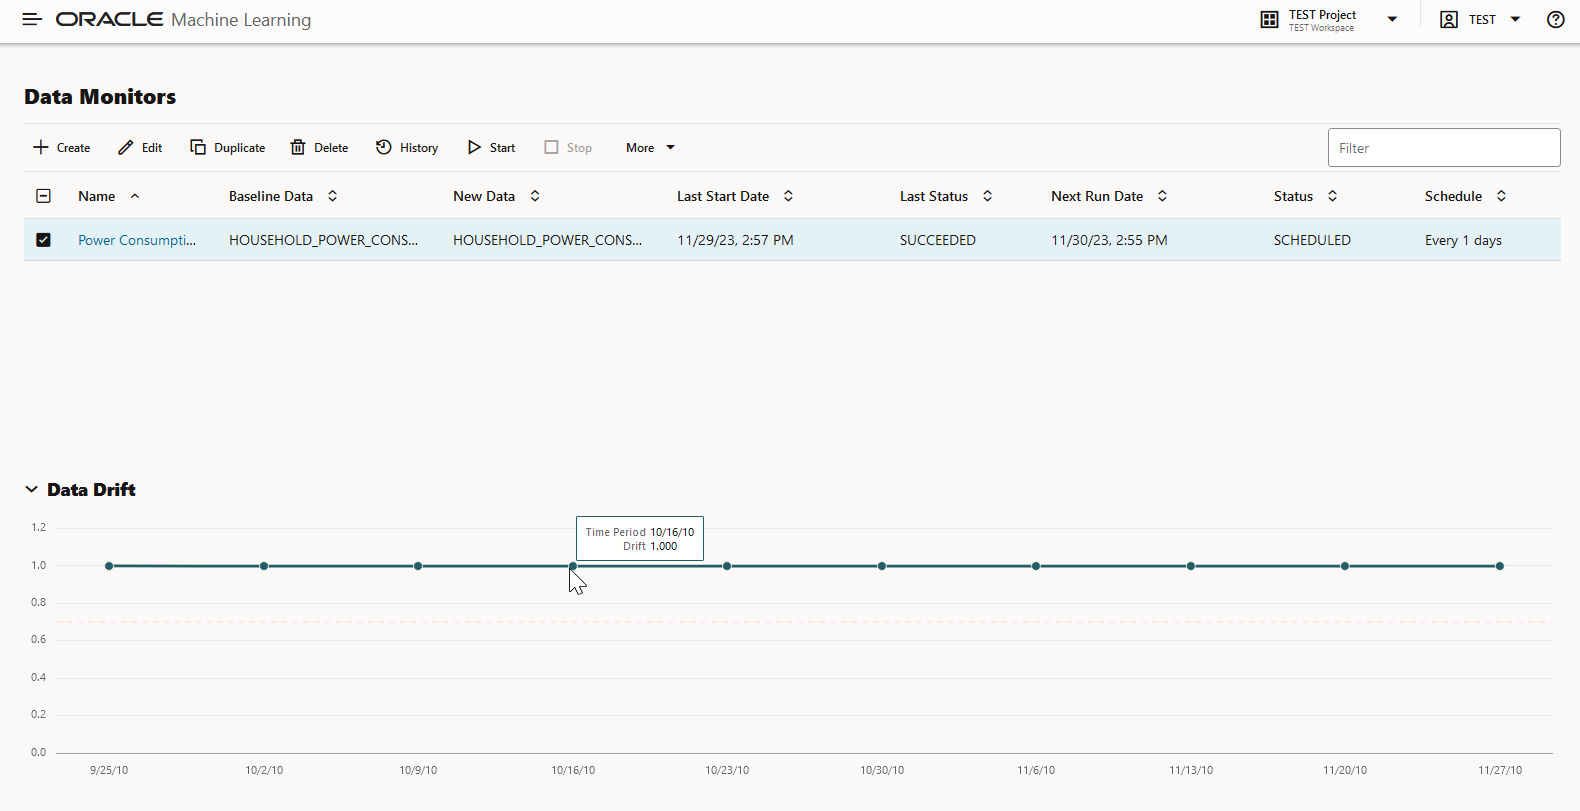
Figure 6-22 Data Drift preview on Data Monitors page
Select a data monitor that has run successfully, as shown in the screenshot. On the lower pane, the data drift of the selected monitor is displayed. The X axis depicts the analysis period, and the Y axis depicts the data drift values. The horizontal dotted line is the threshold value, and the line depicts the drift value for each point in time for the analysis period. Hover your mouse over the line to view the drift values. For more information on this example, see View Data Monitor Results.
- Create a Data Monitor
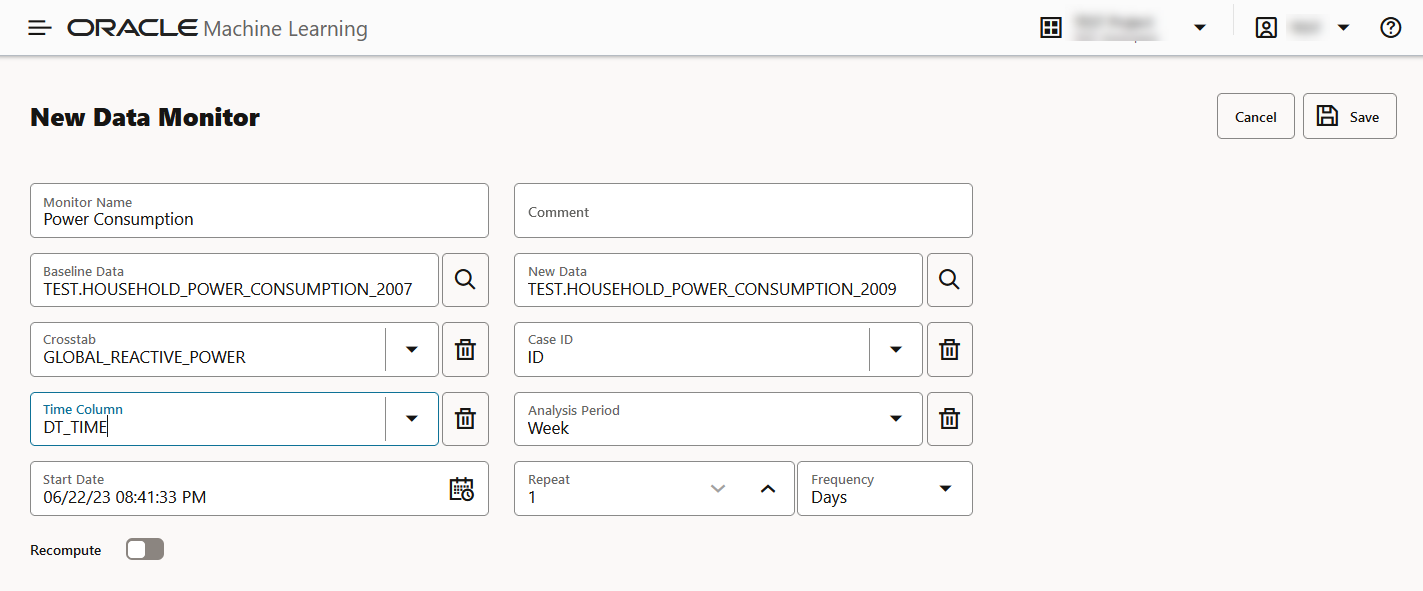
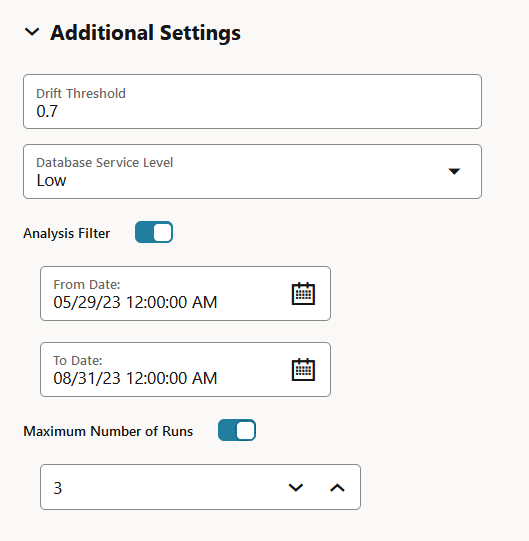
Data Monitoring allows you to detect data drift over time and the potentially negative impact on the performance of your machine learning models. On the Data Monitor page, you can create, run, and track data monitors and the results. - View Data Monitor Results
The Data Monitor Results page displays the information on the selected data monitor that have run successfully, along with data drift details for each monitored feature. - View History
The History page displays the runtime details of data monitors.
Related Topics
Parent topic: Get Started
2.7 Create a Data Monitor
Data Monitoring allows you to detect data drift over time and the potentially negative impact on the performance of your machine learning models. On the Data Monitor page, you can create, run, and track data monitors and the results.
Parent topic: Data Monitoring
2.7 View Data Monitor Results
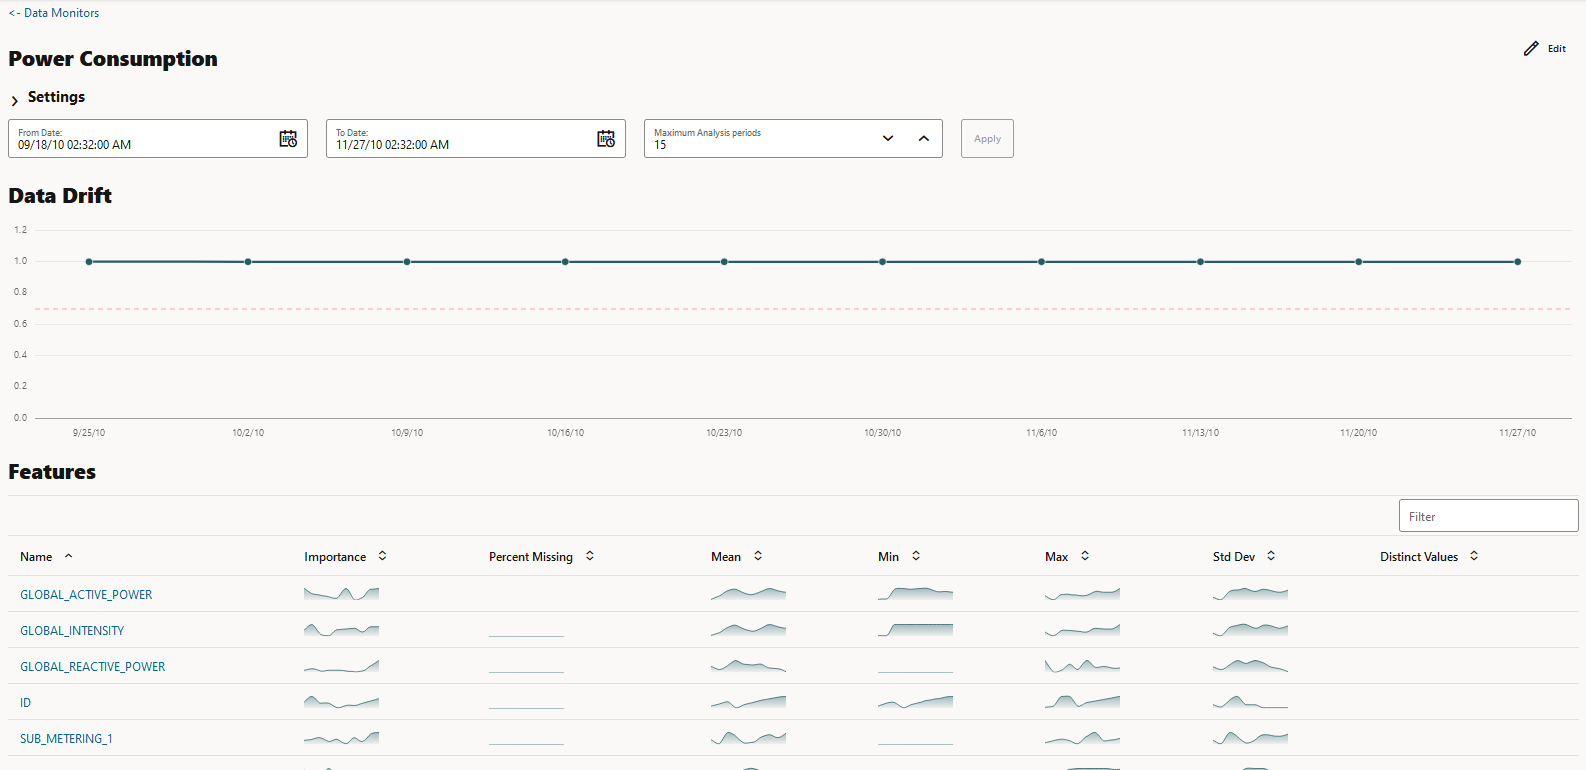
The Data Monitor Results page displays the information on the selected data monitor that have run successfully, along with data drift details for each monitored feature.
- Settings: The Settings section displays the data monitor
settings. Click on the arrow against Settings to expand
this section. You have the option to edit the data monitor settings by clicking
Edit on the top right corner of the page. In this
screenshot, the settings for the data monitor Power
Consumption is seen.
Figure 6-26 Settings section on the Data Monitor Results page
- Drift: The Drift section displays the details of data drift
for each monitored feature. In this example, the data monitor Power
consumption data monitor is selected. The X axis depicts the
analysis period, and the Y axis depicts the data drift values. The horizontal
dotted line is the threshold value, and the line depicts the drift value for
each point in time for the analysis period. Hover your mouse over the line to
view the drift values.
Figure 6-27 Data Drift section on the Data Monitor Results page
-
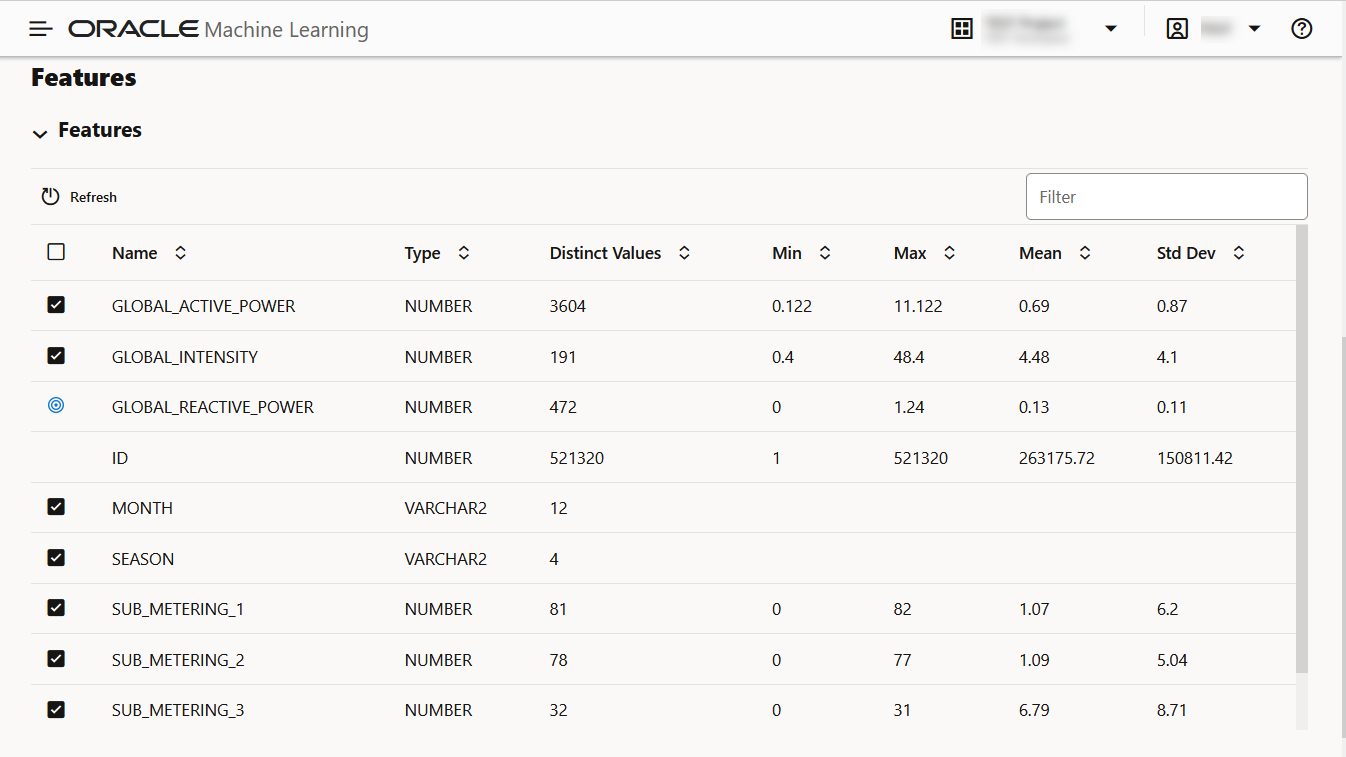
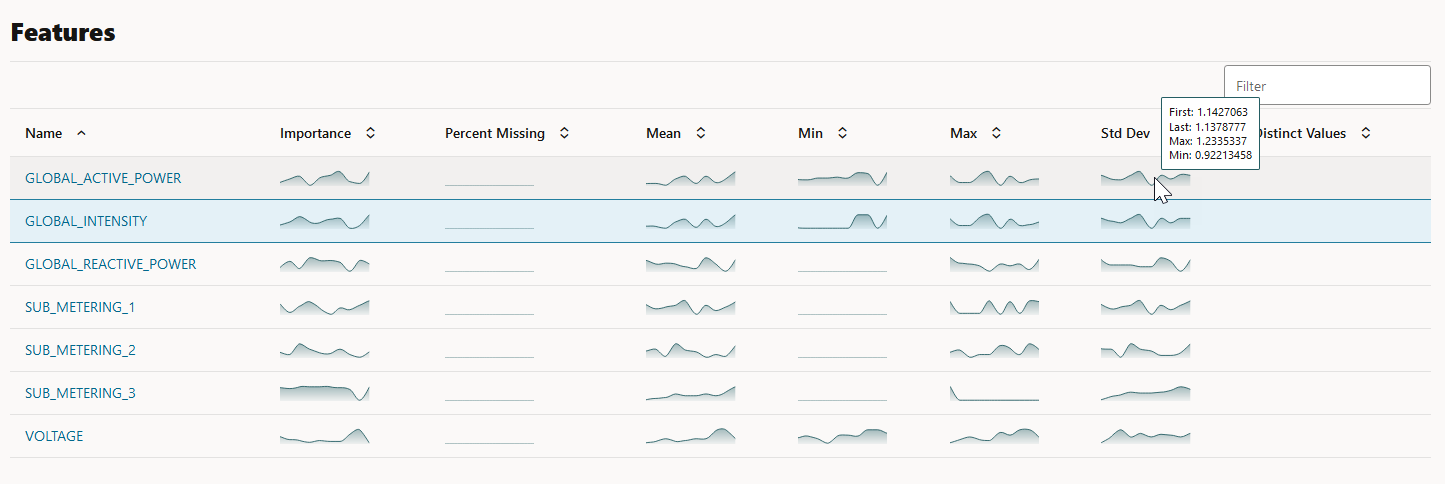
Features: The Features section displays the monitored features along with the computed statistics.
Figure 6-28 Features section on the Data Monitor Results page
The value in the Importance column indicates how impactful the feature has been on data drift over a specified time period.
For numerical data, the following statistics are computed:- Mean
- Standard Deviation
- Range (Minimum, Maximum)
- Number of nulls
For categorical data, the following statistics are computed:- Number of unique values
- Number of nulls
For each monitored feature, hover your mouse to view the following additional details, as shown in the screenshot here.
- First: This is the first value of the computed statistics for the analysis period.
- Last: This is the last value of the computed statistics for the analysis period.
- Max: This is the highest value of the computed statistics for the analysis period.
- Min: This is the lowest value of the computed statistics for the analysis period.
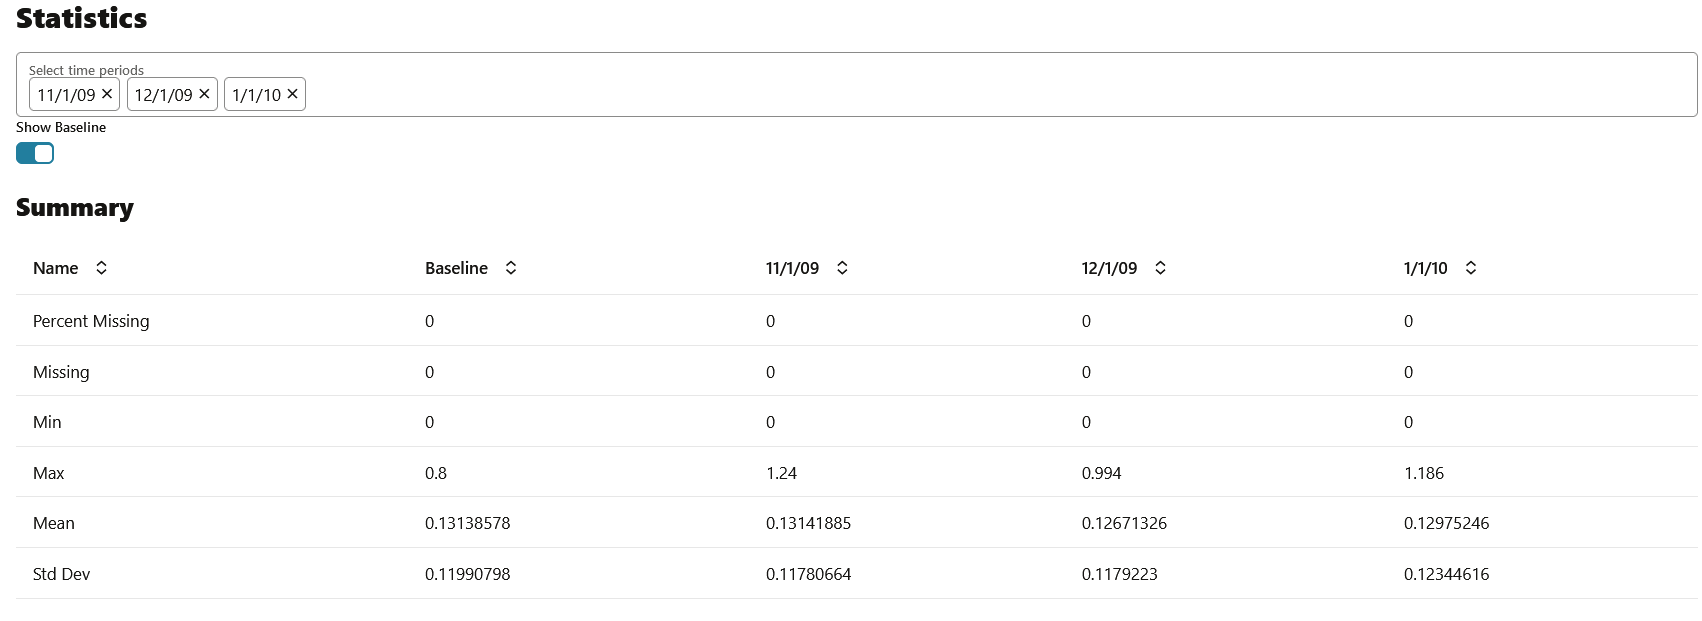
- Click on any monitored feature in the Features section to view the Metric, Statistics, Distribution, and Distribution with Crosstab Column, as shown in the screenshot here. In the screenshot here, the Population Stability Index is shown for the feature GLOBAL_REACTIVE_POWER.
The computations include:
- Metric: The following metrics are computed:
- Population Stability Index (PSI): This is a measure of how much a population has shifted over time or between two different samples of a population in a single number. The two distributions are binned into buckets, and PSI compares the percents of items in each of the buckets. PSI is computed as
The interpretation of PSI value is:PSI = sum((Actual_% - Expected_%) x ln (Actual_% / Expected_%))PSI < 0.1implies no significant population change0.1 <= PSI < 0.2implies moderate population changePSI >= 0.2implies significant population change
- Jenson Shannon Distance (JSD): This is a measure of the similarity between two probability distributions. JSD is the square root of the Jensen-Shannon Divergence which is related to the Kullbach-Leibler Divergence (KLD). JSD is computed as:
SD(P || Q)= sqrt(0.5 x KLD(P || M) + 0.5 x KLD(Q || M))Where, P and Q are the 2 distributions,
M = 0.5 x (P + Q), KLD(P || M) = sum(Pi x ln(Pi / Mi)), and KLD(Q || M) = sum(Qi x ln(Qi / Mi))The value of JSD ranges between 0 and 1.
- Crosstab Population Stability Index: This is the PSI for two variables.
- Crosstab Jenson Shannon Distance: This is the JSD for two variables.
- Population Stability Index (PSI): This is a measure of how much a population has shifted over time or between two different samples of a population in a single number. The two distributions are binned into buckets, and PSI compares the percents of items in each of the buckets. PSI is computed as
- Statistics: You can view statistics for up to 3 selected periods. Data drift is quantified using these statistical computations.
For numerical data, the following statistics are computed:
- Mean
- Standard Deviation
- Range (Minimum, Maximum)
- Number of nulls
For categorical data, the following statistics are computed:- Number of unique values
- Number of nulls
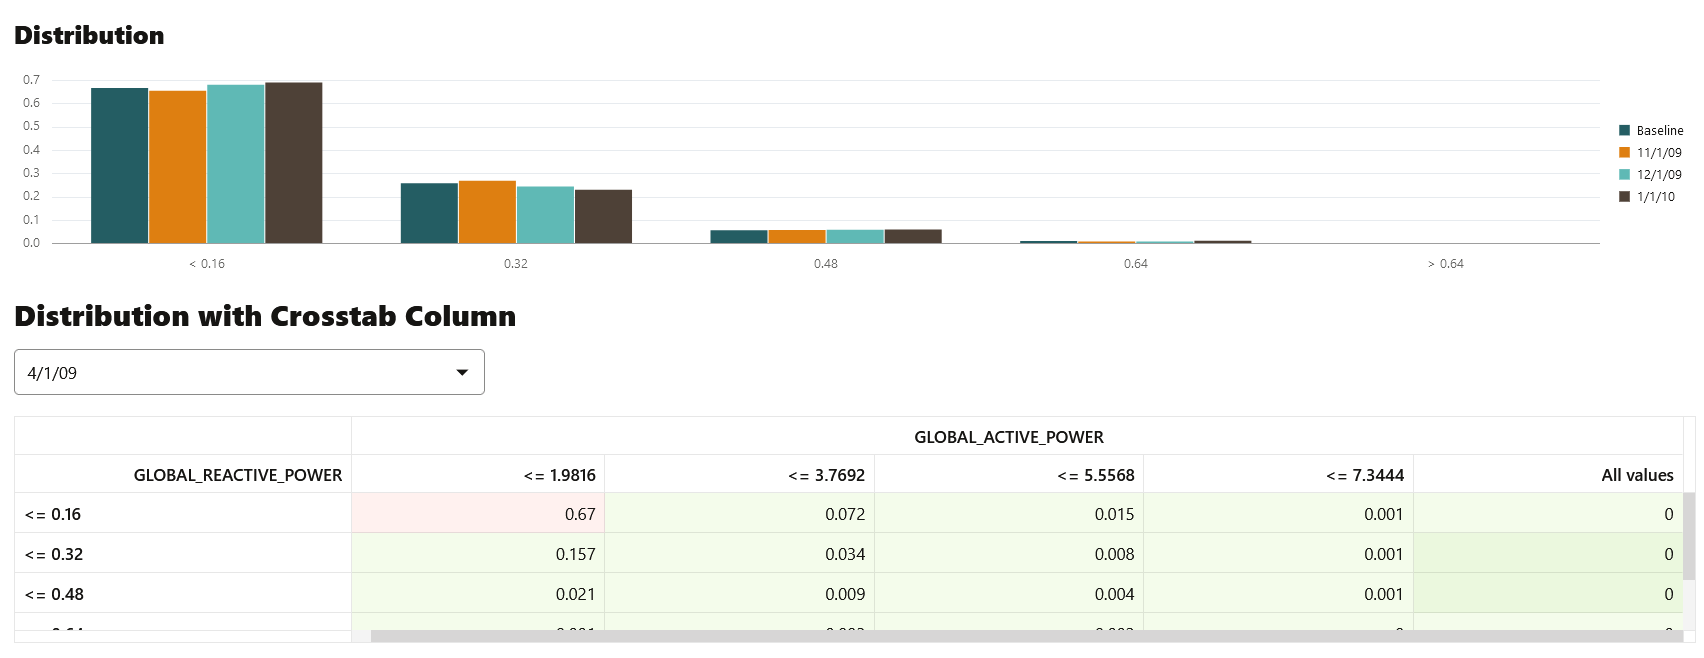
- Distribution: The feature distribution chart with legend displays bins of feature for selected periods and the baseline (optional).
Figure 6-31 Distribution Chart and Distribution with Crosstab column
- Distribution with Crosstab Column: The heat map indicates the density of distribution for the selected crosstab and the feature column. Red denotes highest density.
Note:
In data drift monitoring,nullsare are tracked separately asnumber_of_missing_values.
- Metric: The following metrics are computed:
Parent topic: Data Monitoring
2.7 View History
The History page displays the runtime details of data monitors.
Select a data monitor and click History to view the runtime details. The history page displays the following information about the data monitor runtime:
- Actual Start Date: This is the date when the data monitor actually started.
- Requested Start Date: This is the date entered in the
Start Datefield while creating the data monitor. - Status: The statuses are
SUCCEEDEDandFAILED. - Detail: If a data monitor fails, the details are listed here.
- Duration: This is the time taken to run the data monitor.
Click Back to Monitors to go back to the Data Monitoring page.
Parent topic: Data Monitoring
