Workflows
Workflows enable you to design machine learning processes using a drag-and-drop canvas composed of nodes and connectors. Each node represents a task or step in the machine learning workflow. The connectors define the flow between these steps.
To access Workflows, click Workflows on your OML UI home page. Alternatively, you can select Workflows under Project on the left navigation menu to open the Workflows page.
Figure 1: Home page with Workflows icon highlighted
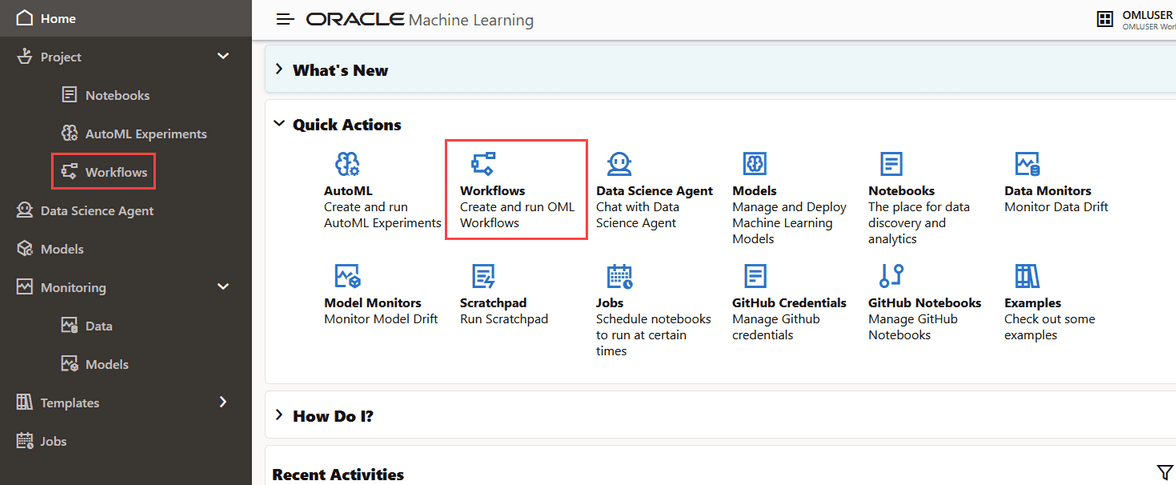
Description of the illustration homepage-workflow.png
The Workflows page lists all the workflows that are created. Figure 2: Workflows Listing page
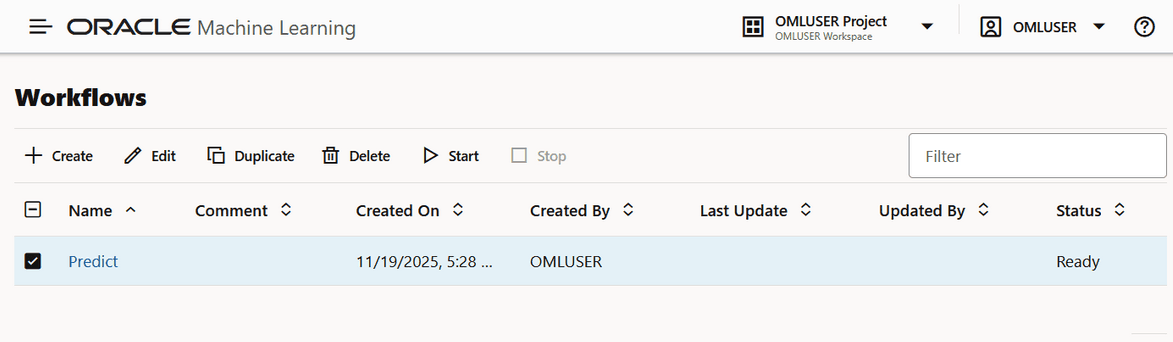
Description of the illustration workflows-listing-page.png
Figure 3: Workflows Listing page
Description of the illustration workflows-listing-page.png
You can perform the following tasks:
-
Create: Click Create to create a new workflow.
-
Edit: Select a workflow from the list and click Edit to edit it.
-
Duplicate: Select any workflow from the list and click Duplicate to create a copy. The duplicated workflow will immediately appear with a
Readystatus. -
Delete: Select any workflow from the list and click Delete to remove it. You cannot delete a workflow that is currently running. You must stop it before attempting to delete.
-
Start: If you have created a workflow but have not run it, click Start to run the workflow.
-
Stop: If a workflow is running, select it and click Stop to halt the running of the workflow.
-
High-Level Steps to Create a Workflow This topic lists the high-level steps to create a workflow.
-
Create a Workflow A workflow is a collection of interconnected machine learning tasks or operations, represented by workflow nodes. Each node represents a distinct computational task—such as data import, data transformation, feature selection, model training, model evaluation, or model scoring—within the workflow. Connectors define the sequence and dependencies between nodes.
-
Workflow Nodes A workflow node is an individual computational component in a workflow. Each node represents a specific task or operation, such as importing and preparing data, training a model, or evaluating results.
High-Level Steps to Create a Workflow
This topic lists the high-level steps to create a workflow.
To create a workflow: 1. Open an existing workflow, or click Create on the Workflow listing page.
- Add workflow nodes to the canvas by dragging them from the palette or by clicking their Add buttons. Note: This is a typical flow of nodes. The nodes can be used in multiple ways and you need not use all the nodes in a workflow.
- Data Source Node
-
Configure the settings for each node.
- Run the nodes individually, or click Run All to run the entire workflow.
Here is a screenshot depicting a workflow with all node types. Figure 4: A workflow with all node types
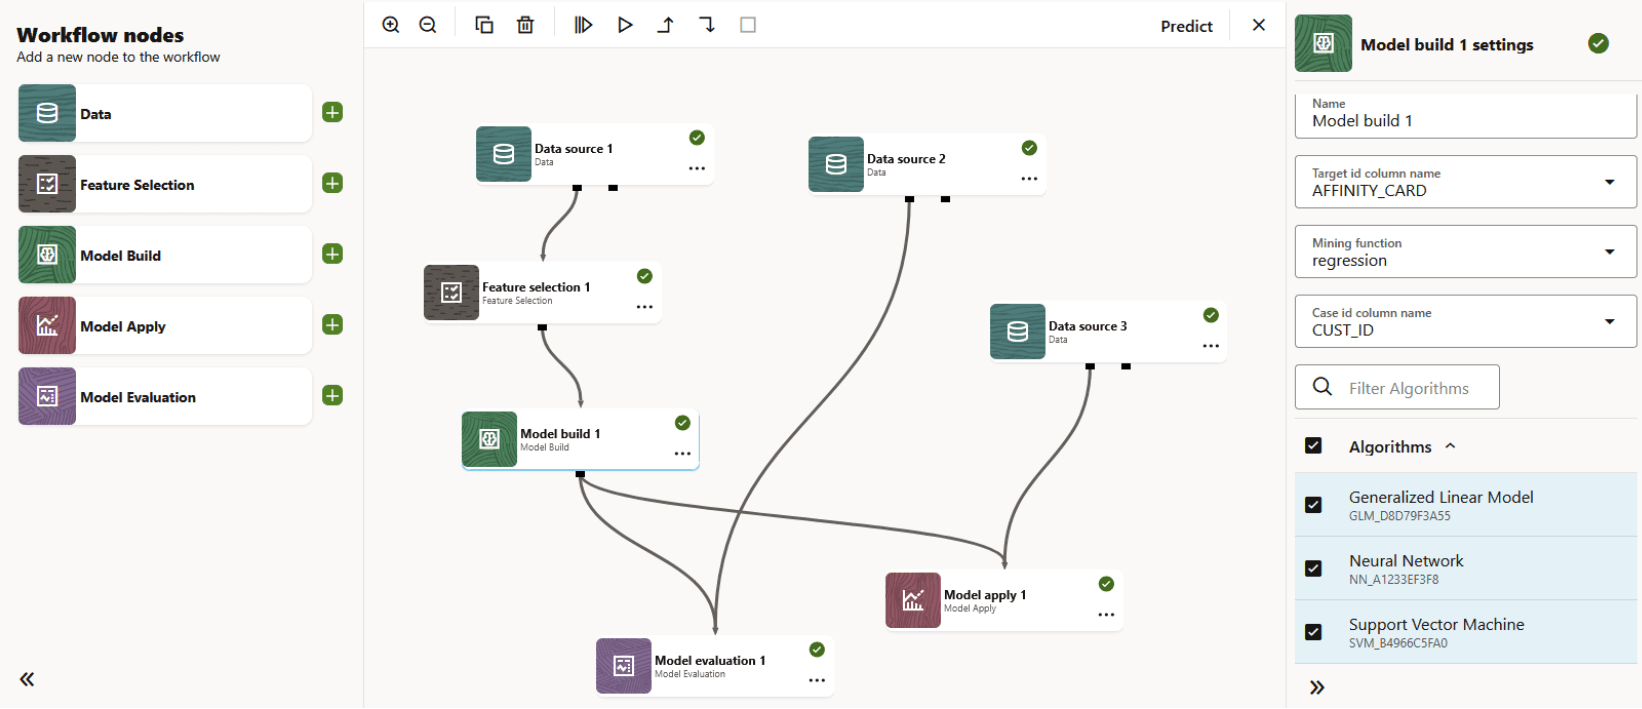
Description of the illustration model-apply-node.png
Create a Workflow
A workflow is a collection of interconnected machine learning tasks or operations, represented by workflow nodes. Each node represents a distinct computational task-such as data import, data transformation, feature selection, model training, model evaluation, or model scoring-within the workflow. Connectors define the sequence and dependencies between nodes.
To create a workflow:
-
On the Oracle Machine Learning UI home page, click Workflows. Alternatively, open the left navigation menu, expand Project and then click Workflows. This opens the Workflows listing page.
Figure 5: Home page with Workflows options highlighted
-
On the Workflows listing page, click Create.
Figure 6: Workflows listing page
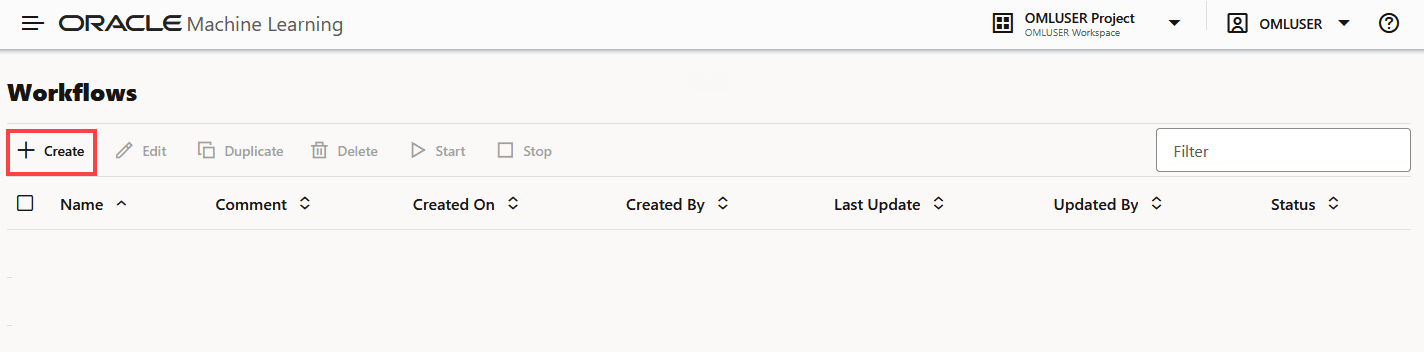
Description of the illustration workflows-listing-blank.png
This opens the Create Workflow dialog.
-
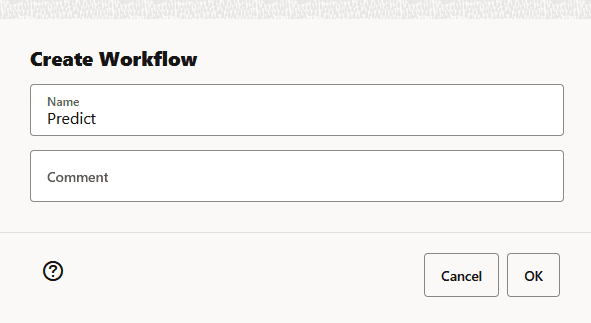
In the Create Workflow dialog, enter these details:
Figure 7: Create Workflow dialog
Description of the illustration create-workflow-dialog.png
-
Name: Enter a name for the workflow. In this example, the name of the workflow is
Predict. -
Comment: Enter comments, if any.
-
Click OK. A blank workflow is created and it opens in the workflow editor. In the workflow editor, you can drag and drop the nodes from the Workflow nodes palette to the canvas, or simply click
 to add the nodes to the canvas and run it.
Figure 8: A complete workflow
Description of the illustration model-apply-node.png
On the Workflows editor:
-
To the left is the Workflow Nodes palette. This is where all the workflow nodes are available.
-
At the center is the canvas. This is where you create a workflow.
-
To the right is the Settings pane. This pane opens specific settings for the nodes that you select. By default, this pane is collapsed. Click
 to expand the pane. In the screenshot above, the Model apply node is selected, and the settings pane of this node is visible to the right.
-
At the top is the canvas toolbar.

-
Click
 for a broader view of the canvas.
-
Click
 for a closer view of the canvas.
-
Click
 to run all the nodes in the workflow.
-
Note: To use this option, ensure that all the nodes in the workflow are defined correctly.
-
Click
 to run a selected node.
-
Click
 to run the nodes with dependencies—run all parents nodes (upstream nodes in the workflow) along with selected nodes, if any.
-
Click
 to run the node with dependents—run children nodes (downstream nodes) along with selected nodes, if any.
-
Click
 to stop a workflow or a node that is running.
-
Click
 to exit the canvas. This takes you back to the Workflows listing page.
-
Workflow Nodes
A workflow node is an individual computational component in a workflow. Each node represents a specific task or operation, such as importing and preparing data, training a model, or evaluating results.
Add nodes to the canvas by dragging them from the palette and dropping them onto the canvas, or by selecting a node from the palette to place it.
The available workflow nodes include:
-
Data Source Node: Specifies the workflow’s data source (schema and table). This node supports data-related tasks such as data import, data splitting, and computing basic statistics. It typically serves as the starting point of the workflow.
-
Feature Selection Node: Identifies and selects a subset of the most important features (columns) to help improve model performance. This node evaluates attribute importance during model training.
-
Model Build Node: Trains machine learning or statistical models using supported algorithms. This node manages model training and model creation for downstream evaluation and scoring.
-
Model Evaluation Node: Measures model performance by running evaluation tasks.
-
Model Apply Node: Applies a trained model to input data to generate predictions or scores.
Here are the high-level steps to create a workflow:
-
Open an existing workflow, or click Create on the Workflow listing page.
-
Drag and drop the required workflow nodes from the palette onto the canvas.
-
Configure settings for each node as needed.
-
Run individual nodes or click Run all to run the entire workflow.
Below is a screenshot of a workflow containing all the available workflow nodes. Figure 9: A complete workflow
Description of the illustration model-apply-node.png
-
Data Source Node The Data source node defines the workflow’s data source by specifying the schema and table. It supports data-related tasks such as data import, data splitting, and basic statistical computations. This node typically serves as the starting point of a workflow.
-
Feature Selection Node The Feature Selection node selects a subset of relevant features (columns) to help improve model performance. It uses attribute-importance results generated during model training to guide feature selection.
-
Model Build Node The Model Build node builds and trains machine learning or statistical models using supported algorithms.
-
Model Evaluation Node The Model Evaluation node evaluates model performance using available evaluation metrics and reports.
-
Model Apply Node The Model Apply node applies a trained model to input data to generate predictions or scores.
-
Deploy a model Deploying a model creates an Oracle Machine Learning Services endpoint that can be used for scoring.
Data Source Node
The Data source node defines the workflow’s data source by specifying the schema and table. It supports data-related tasks such as data import, data splitting, and basic statistical computations. This node typically serves as the starting point of a workflow.
Allowed Connections:
-
Upstream node: None
-
Downstream node: Feature Selection node, Model Build node, Model Evaluation node
To create and run a Data Source node:
-
On the Workflows editor, drag and drop the Data Source node from the palette to the canvas. Alternatively, you may also click
icon next to the Data Source node to add it to the canvas. -
Adding a node automatically opens the settings pane on the right.
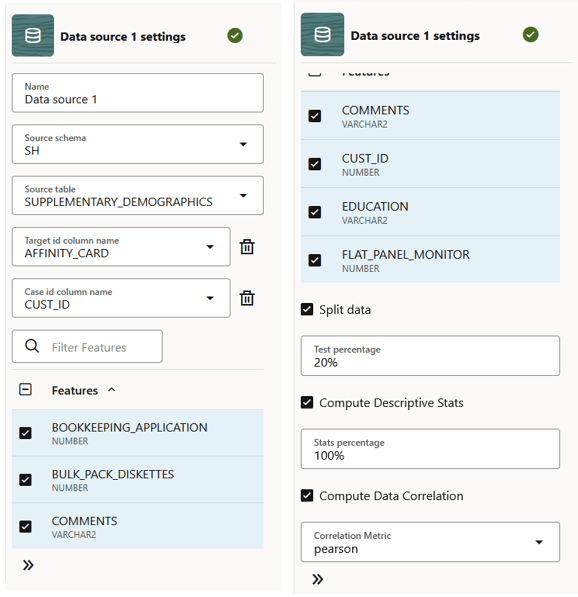
Figure 10: Settings - Data Source node
Description of the illustration settings-data-source-node.png
Here, define the data source:
-
Name: Enter a name. In this example, it is
Data source 1. -
Source Schema: Click on the drop-down menu to select the schema. Here,
SHschema is selected. -
Source table: Click on the drop-down menu to select the table. Here,
SUPPLEMENTARY_DEMOGRAPHICStable is selected. Once you select the table, the Features field below displays the columns of the table. -
Target ID column name: From the drop-down menu, select a target. This is the target for your prediction.
-
Features: This field displays all the columns of the selected table, and has all of them selected. You may deselect any column.
-
Split Data: By default, this option is selected and
20%is allotted for test data. You can edit this field. -
Compute Descriptive Stats: Select this option to allot a dataset percentage for descriptive statistics computation. The default is
100%. -
Compute Data Correlation: Select this option if you want to compute correlation between two variables in the dataset. Correlation is a bivariate analysis that measures the strength of association between two variables and the direction of the relationship. The correlation metrics are:
-
Pearson correlation: Measures the degree of the relationship (strength and direction) between two linearly related variables.
-
Strength: A value close to
1or-1indicates a strong linear relationship, while a value near 0 suggests a weak or nonexistent one. -
Direction can be positive or negative. Positive Correlation—Occurs when one variable increases, the other also tends to increase. Negative Correlation—Occurs when one variable increases, the other tends to decrease.
-
-
Kendall correlation: A non-parametric test that measures the strength of dependence between two variables.
-
Spearman correlation: A non-parametric test that measures the degree of association between two variables.
-
-
-
After defining the node, click on the ellipses on the node or right-click to open the menu. Click Run.
Once the node runs successfully, it is indicated by the
 icon.
Figure 11: Data Source node
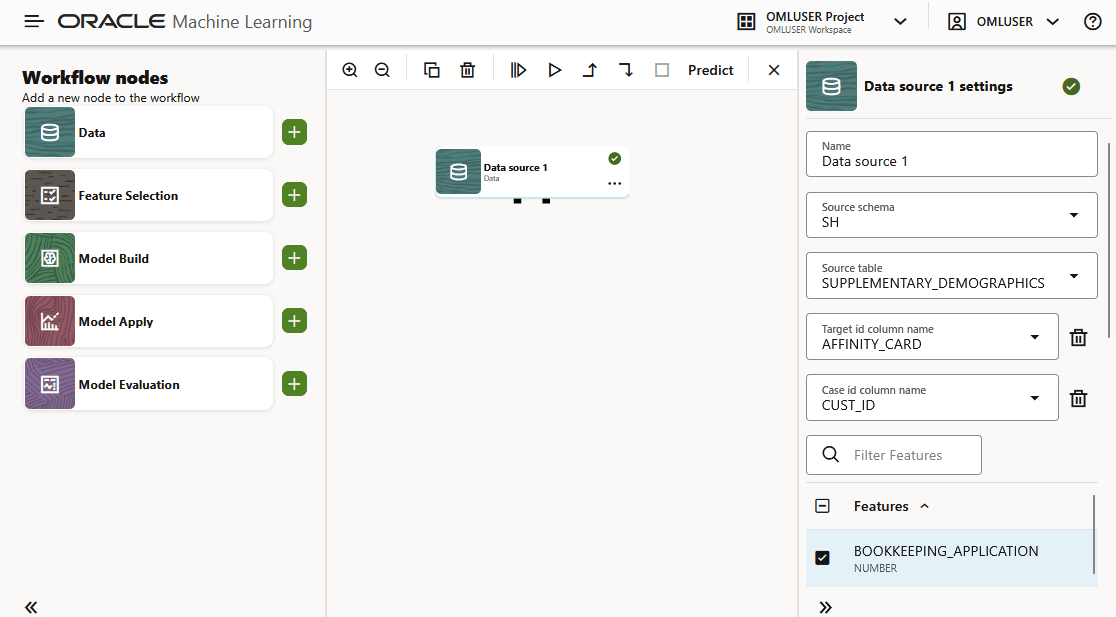
Note: You also have the option to add all the nodes to the workflow first, define the settings and connections for each node, and then run all the nodes by clicking Run all.
- Click on the ellipses on the node or right click on the node and click Results to to view the results.
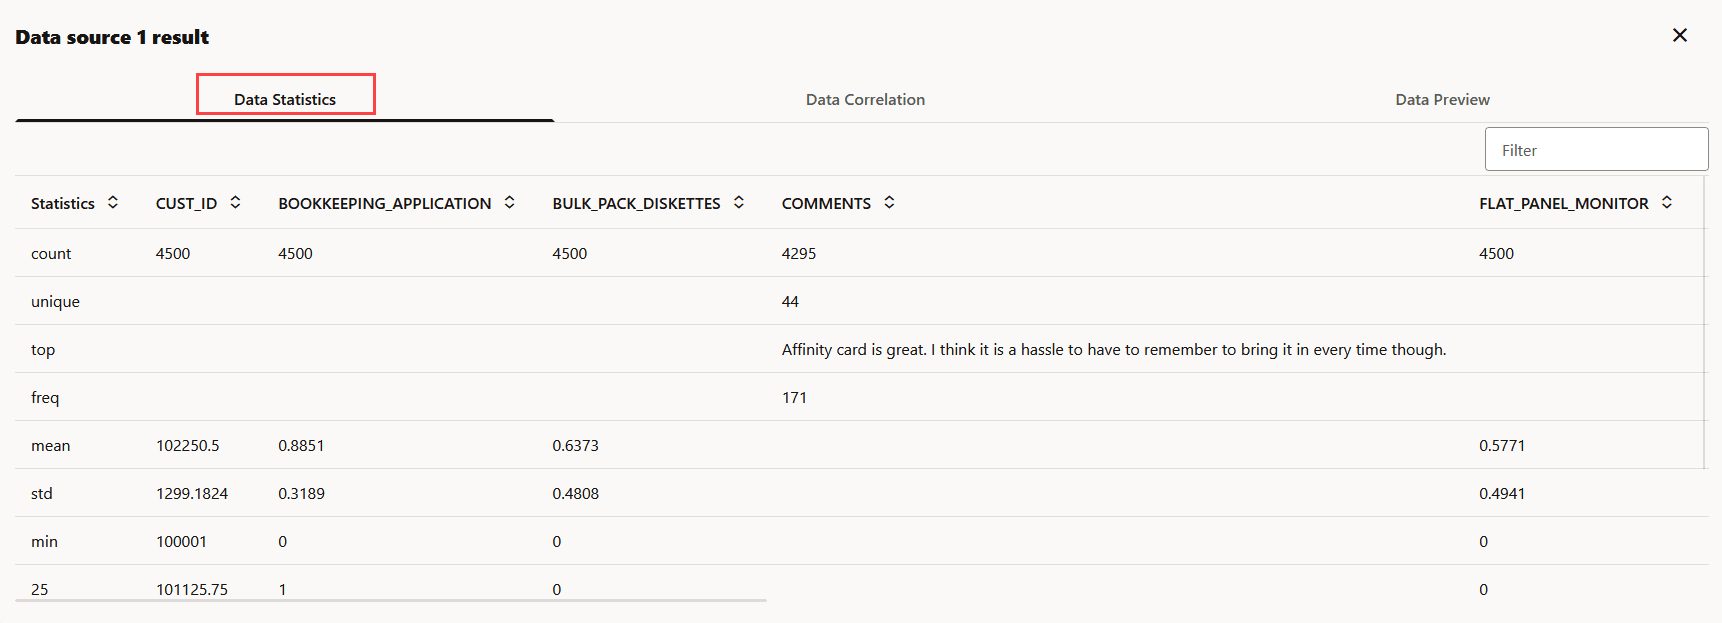
- The Data Statistics tab displays the basic statistics computed for the selected features (columns). The computed statistics are Distinct Count, Number of Unique values, Top N, Frequent values, Mean, Std deviation, Min, 25, 50, 75 quantiles, and Max.
Figure 12: Data Statistics tab
- The Data Correlation tab displays the correlation level between the columns. Positive values indicate positive correlation, and the different shades of red indicate the different levels of positive correlation. Negative values indicate negative correlation, and the different shades of blue indicate the levels of negative correlation. A value of
1indicates perfect positive correlation and a value of-1indicates perfect negative correlation. See screenshot below: Figure 13: Data Correlation tab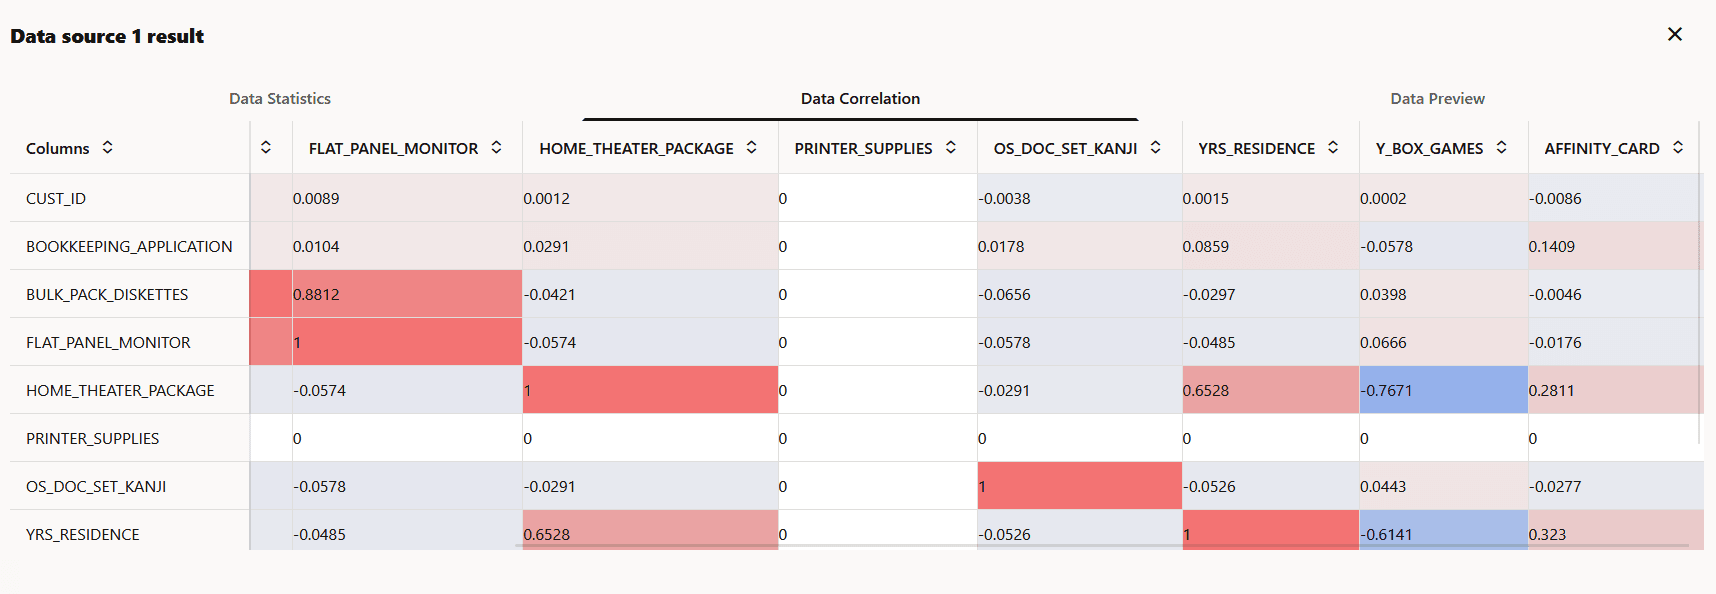
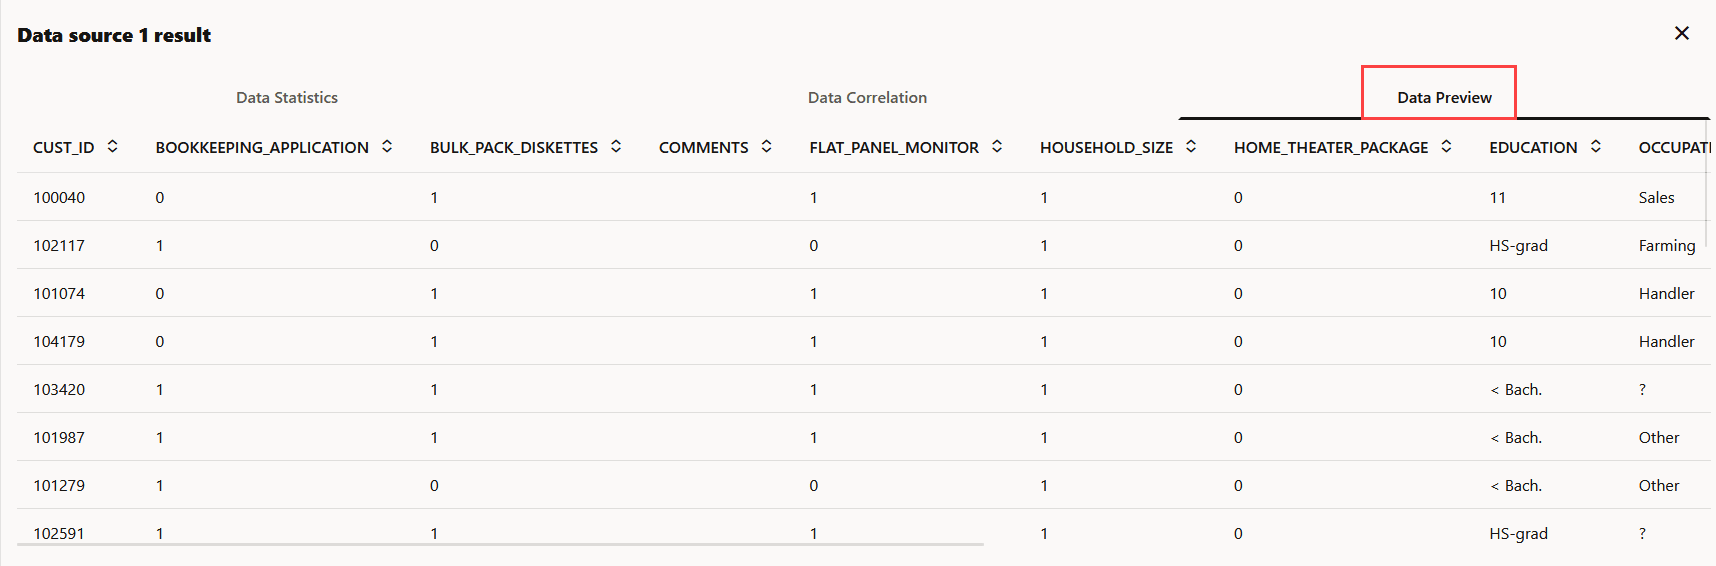
- The Data Preview tab shows the preview of the data set used for the workflow.
Figure 14: Data Preview tab
-
You may now proceed to add the next node in the flow. If you need suggestions, click the ellipses on the Data Source node or right-click to open the available options, and click Recommend next node. The applicable nodes are displayed. Click on the one that applies to add it to the canvas. Here you have two options:
Figure 15: Nodes - right-click options
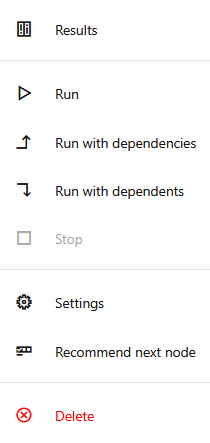
Description of the illustration nodes-right-click-options.png
-
Add node manually: Drag and drop the node from the palette to the canvas. In this example, the Feature Selection node is added. You must now connect the Data Source node to the Feature Selection node. For this, click on the connection port indicated by the dot on the Upstream node. A connector appears. Drag the connector to the downstream node to establish the connection.
-
Click Recommend next node: Click this option to view the list of recommended nodes.
-
-
Clicking Recommend next node gives you the following options under two categories.
-
Train Split
-
Feature Selection
-
Model Build
-
-
Test Split
- Model Evaluation
Click on the node that you want to add to the workflow. The connector is automatically added from the Data Source node to the selected node.
-
Feature Selection Node
The Feature Selection node selects a subset of relevant features (columns) to help improve model performance. It uses attribute-importance results generated during model training to guide feature selection.
Allowed Connections:
-
Upstream node: Data Source node
-
Downstream nodes: Feature Selection Node, Model Evaluation node, Model Apply node
To add and run a Feature Selection node:
-
You can add the Feature Selection node to the workflow in two ways:
-
From the workflow palette, drag and drop the Feature Selection node to the canvas. Alternatively, you may also click
on the node. -
You may also click Recommend next node on the upstream node (Data Source node) and then click Feature Selection.
Note: Using the Recommend next node option automatically connects the nodes.
-
-
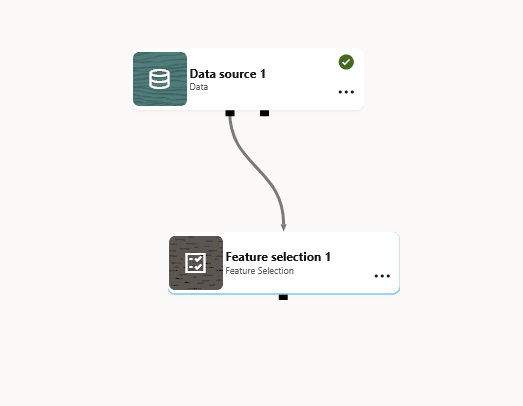
If you manually add the node, you must establish a connection from the Data Source node (upstream node) to the Feature Selection node (downstream node). For this, click on the connection port indicated by the dot on the Upstream node. A connector appears. Drag the connector to the downstream node to establish the connection.
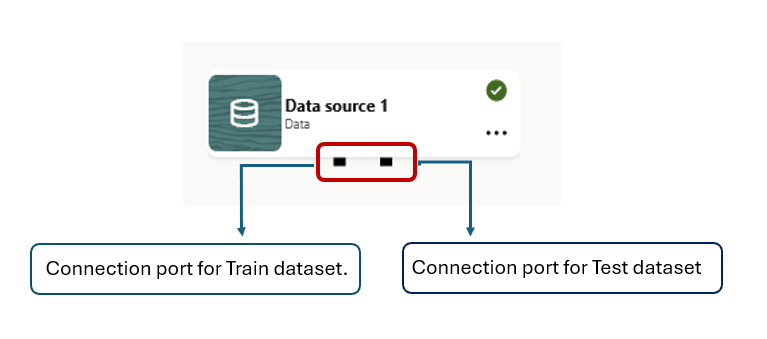
The Data Source node has two connection ports. The one on the left is for Train dataset, and the one on the right is for Test dataset.
Figure 16: Connection ports on a Data Source node
-
Once you connect the nodes, click on the Feature Selection node to open the settings. If the Settings pane is not visible, click
at the bottom to expand the pane.Figure 17: Data Source and Feature Selection node connection
-
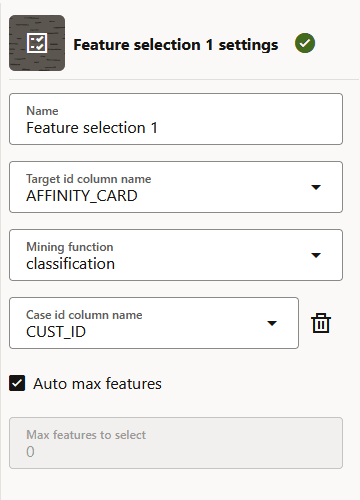
On the Settings pane, define the settings for the node.
Figure 18: Settings - Feature Selection node
Description of the illustration settings-feature-selection.png
In this example,
AFFINITY_CARDis selected as the target id column name andCUST_IDis the Case id column. The Mining function selected isClassification. The selection of mining function is automatic. It depends on the target you selected. However, you can override it. -
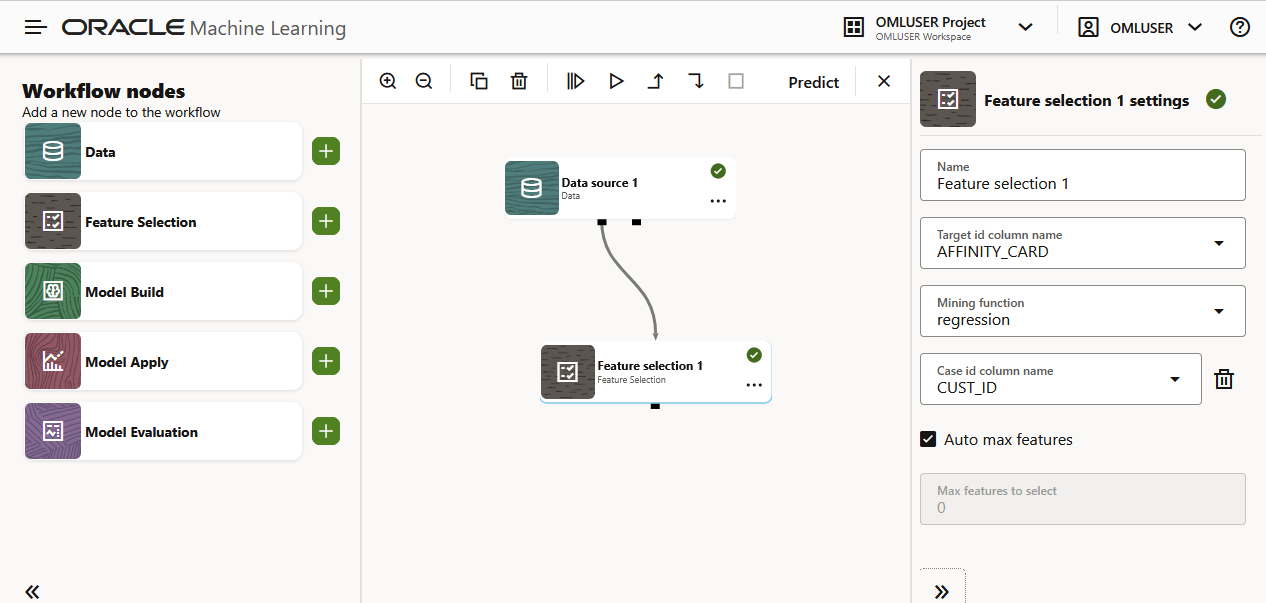
Right click on the node or click on the ellipses and then click Run. Once the node runs successfully, it is indicated by the
icon, as shown in the screenshot below.Figure 19: Feature Selection node
-
Once the node is run successfully, right-click on the node and then click Results to view the results.
Figure 20: Feature Selection Results
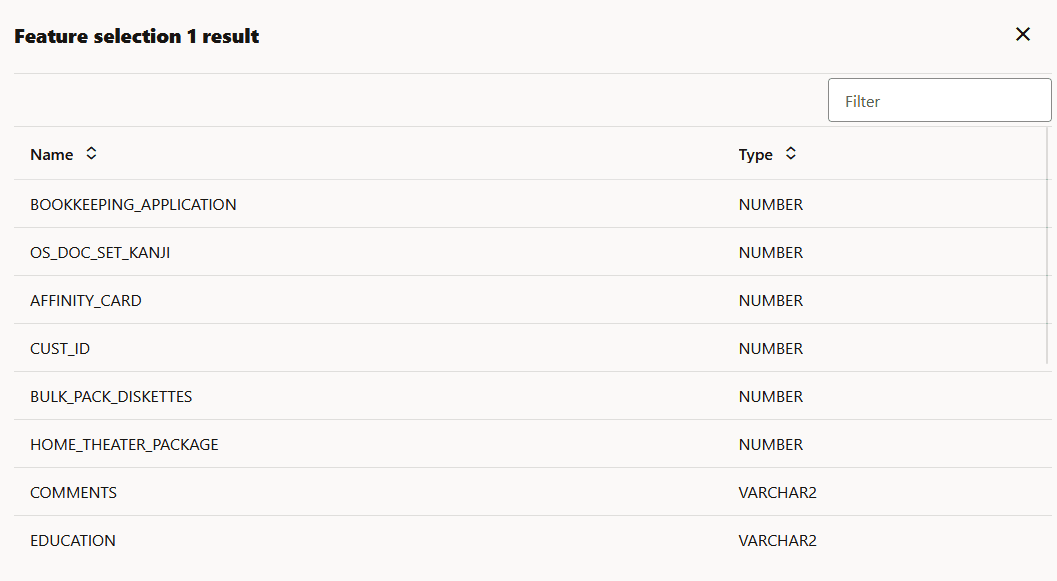
Description of the illustration results-feature-selection-node.png
-
You may now add the next node in the workflow. If you need suggestions, right-click on the node, and click Recommend next node to proceed with the workflow.
The recommended next node is the Model Build node. Figure 21: Right-click options
Description of the illustration nodes-right-click-options.png
Model Build Node
The Model Build node builds and trains machine learning or statistical models using supported algorithms.
To add the Model Build node to your workflow, you must first have the Data Source node and Feature Selection node defined:
Allowed Connections:
-
Upstream nodes: Data Source node, Feature Selection node
-
Downstream nodes: Model Evaluation node, Model Apply node
To add and run a Model Build node:
-
On the Workflow editor, drag and drop a Model Build node from the palette to the canvas.
-
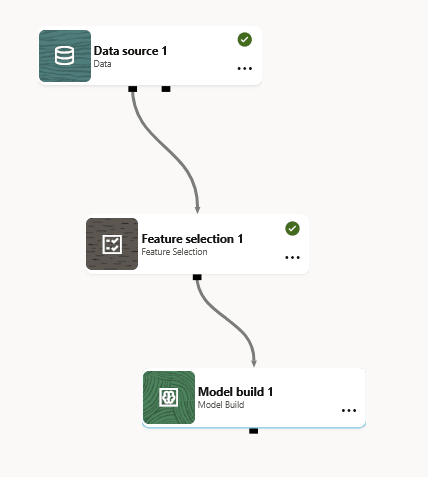
From the Upstream node (Feature Selection node), establish a connection to the Model Build node. For this, click on the connection port indicated by the dot on the Upstream node. A connector appears. Drag the connector to the downstream node to establish the connection.
Figure 22: Model Build node in the workflow
-
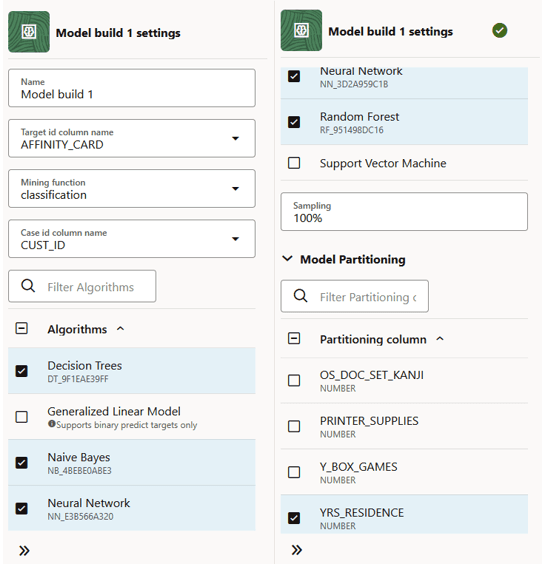
Once you connect the nodes, define the settings. Click on the Model Build node to open the settings pane. If the Settings pane is not visible, click
on the bottom right to expand the pane.Figure 23: Settings - Model Build node
Description of the illustration settings-model-build-node.png
For the Model Build settings, the value for Target ID column name is set to
AFFINITY_CARD, Mining Function is set toClassification, Case ID isCUST_ID, Algorithms selected are Decision Tree, Naive Bayes, Neural Network, and Random Forest, andYRS_RESIDENCEis selected as the Partitioning column. The selection of mining function is automatic. It depends on the target you selected. However, you can override it. -
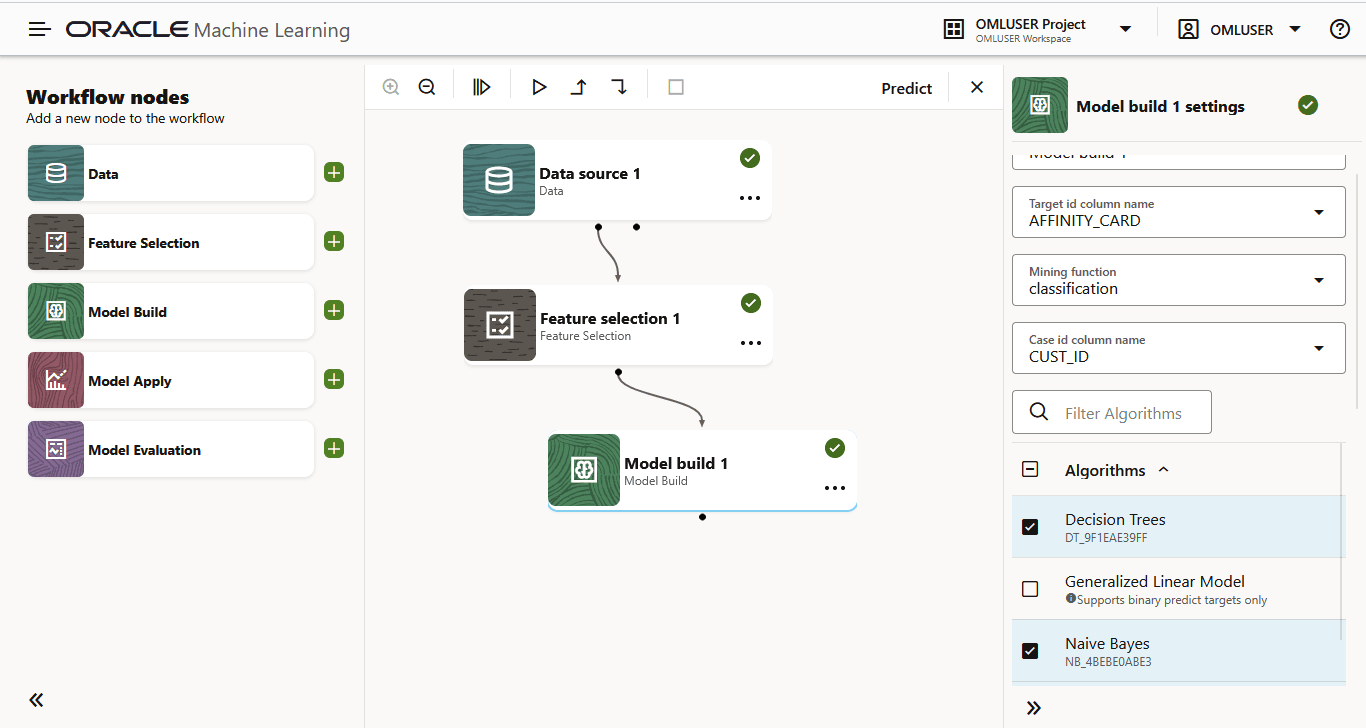
Right click on the node or click on the ellipses, and then click Run. Once the node runs successfully, it is indicated by the
icon, as shown in the screenshot below.Figure 24: Model Build node in the workflow
-
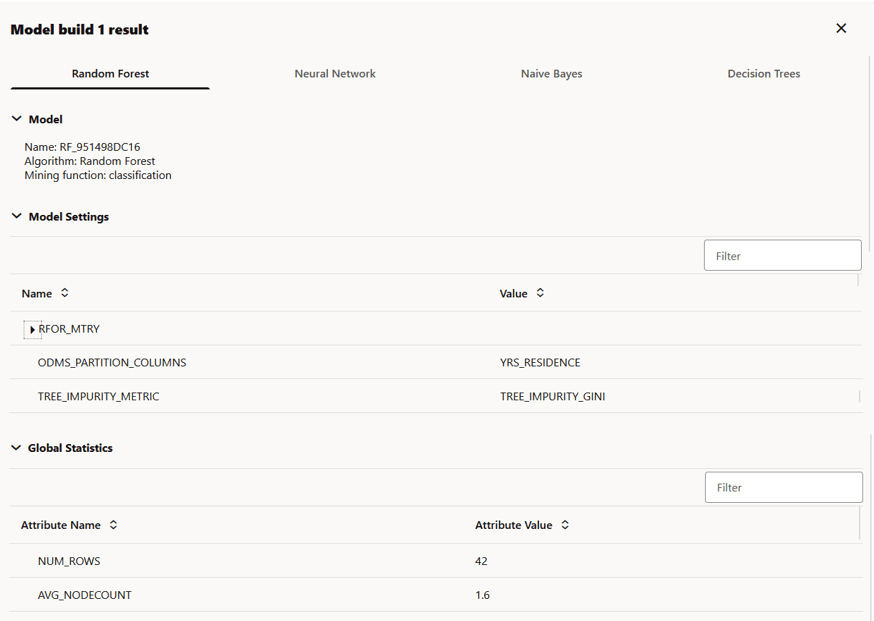
Once the node is run successfully, right-click on the node and then click Results to view the results. The results computed by the selected algorithms are displayed in respective tabs, as shown in the screenshot here.
Figure 25: Results - Model Build node
Description of the illustration results-model-build-node.png
The results for each algorithm are displayed in separate tabs. In this example, the results are displayed in separate tabs by the name—Random Forest, Neural Network, Naive Bayes, and Decision Tree. These are the algorithm selected in the settings for this node. Each tab displays the Model Details (model name, algorithm, mining function), Model Settings for the specific algorithm, and Global Statistics containing the attributes and attribute values, as shown in the screenshot above.
Note: You cannot rename the underlying model. However, you can assign a name to a model deployed to OML Services.
-
You may now add the next node in the workflow. If you need suggestions, right-click on the node and click Recommend next node to proceed with the workflow.
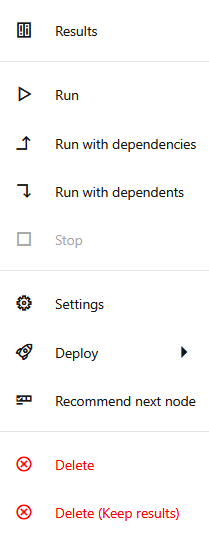
The recommended next nodes are Model Evaluation node and Model Apply node.
Figure 26: Model Build node right-click options
Description of the illustration right-click-model-node.png
On the Model Build node, you also have the option to Deploy the model. See Deploy a model for more information.
Model Evaluation Node
The Model Evaluation node evaluates model performance using available evaluation metrics and reports.
Allowed Connections:
-
Upstream nodes: Data Source node, Model Build Node
-
Downstream nodes: None
To add and run a Model Evaluation node:
-
In the Workflow editor, drag and drop a Model Evaluation node from the palette to the canvas. Alternatively, you may also click
on the node. -
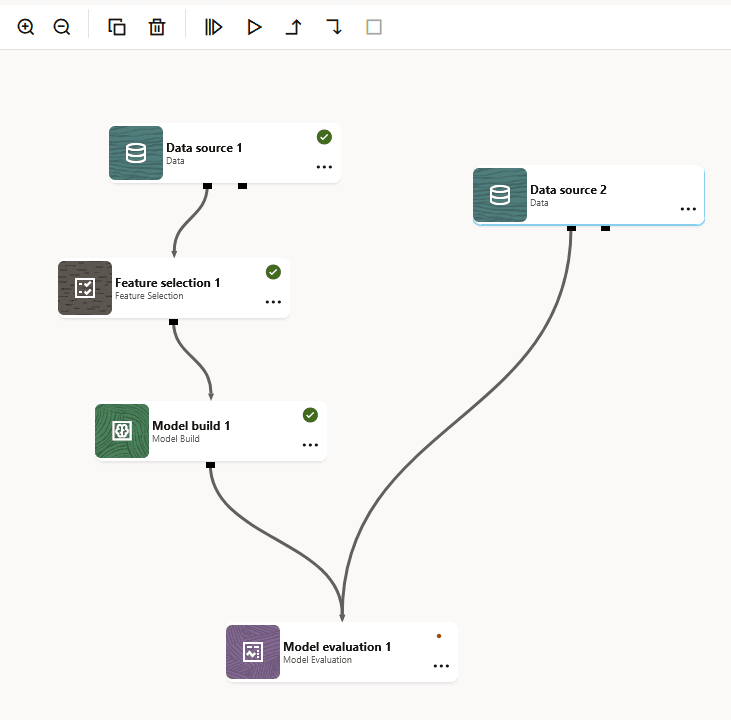
From the Model Build node, establish a connection to the Model Evaluation node. If you are adding it manually, establish a connection from the Upstream node (Model Build node) to the Downstream node (Model Evaluation node). For this, click on the connection port indicated by the dot on the Upstream node. A connector appears. Drag the connector to the downstream node to establish the connection.
-
Drag and drop another Data Source node and establish a connection to the Model Evaluation node. Define the second Data Source node with the same settings.
Note: The second nub on the
Data source 1node can be a test data set for model evaluation.Figure 27: Model Evaluation node
Description of the illustration data-feature-build-eval-1.png
-
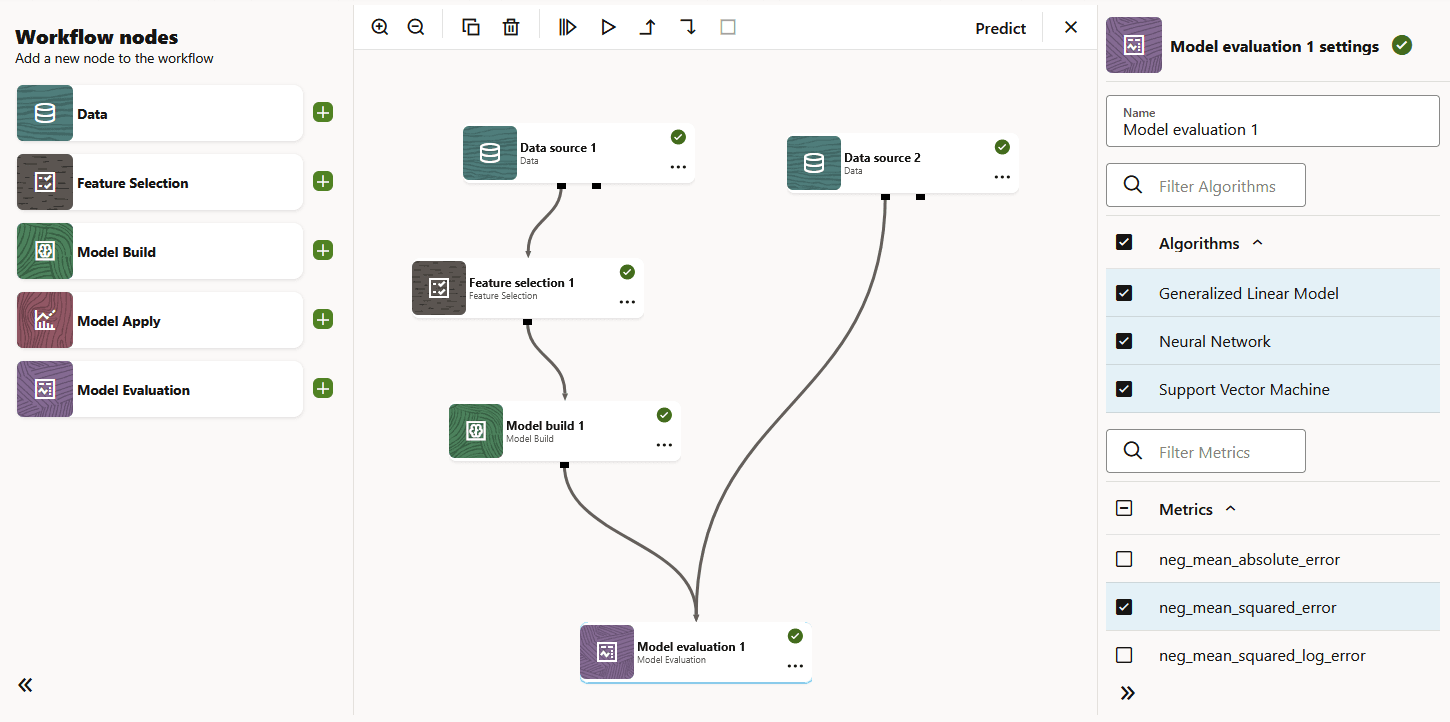
Once you connect the nodes, define the settings. Click on the node to open the settings pane. If the Settings pane is not visible, click
at the bottom to expand the pane. -
Right click on the node or click on the ellipses and then click Run. Once the node runs successfully, it is indicated by the
icon, as shown in the screenshot below.Figure 28: Model Evaluation node in the workflow
-
Once the node is run successfully, right-click on the node and then click Results to view the results.
Figure 29: Results - Model Evaluation node
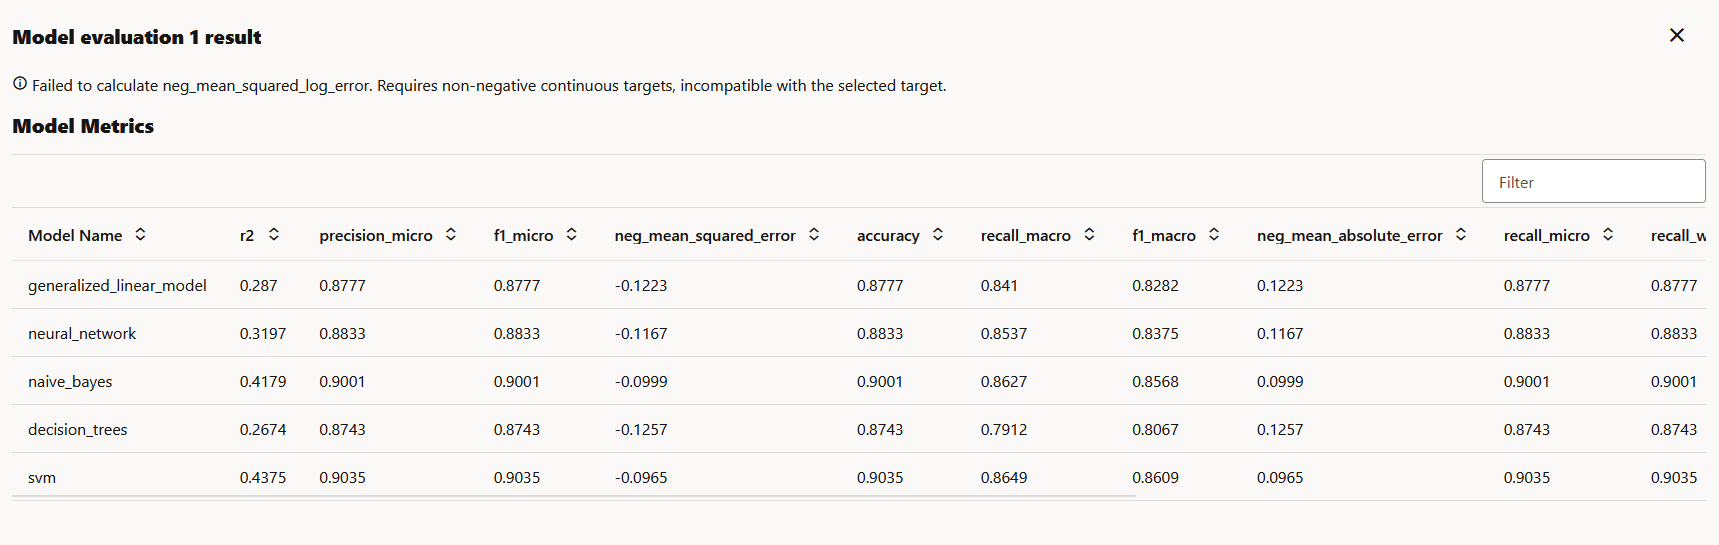
Note: The Model Evaluation node is a terminal node. You cannot add any downstream nodes to it.
Model Apply Node
The Model Apply node applies a trained model to input data to generate predictions or scores.
Allowed Connections:
-
Upstream node: Data Source node, Model Build node.
-
Downstream node: None.
To add and run a model apply node:
-
From the workflow palette, drag and drop the Model Apply node to the canvas. Alternatively, you may also click
on the node on the palette. -
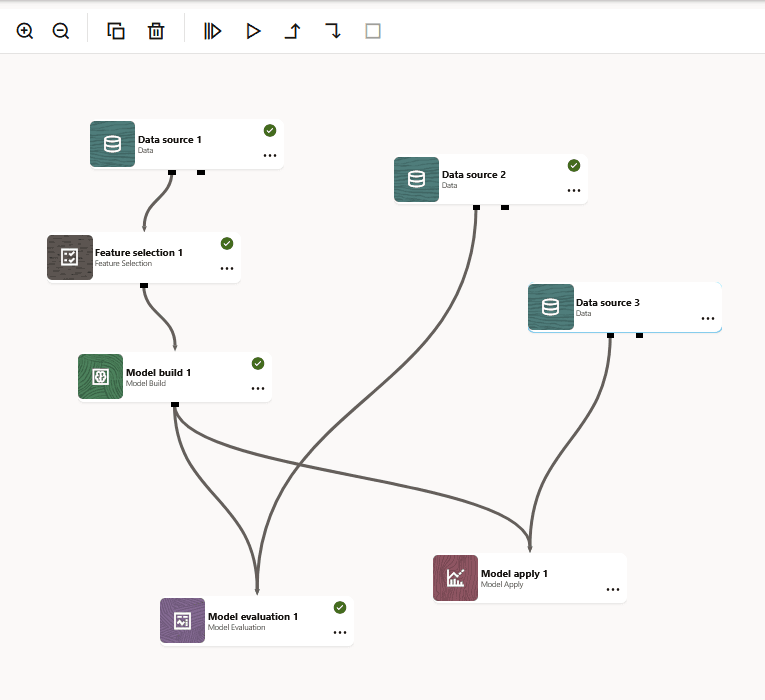
From the Model Build node, establish a connection to the Model Apply node. If you are adding it manually, establish a connection from the Upstream node (Model Build node) to the Downstream node (Model Apply node). For this, click on the connection port indicated by the dot on the source node to the child node.
-
Drag and drop another Data Source node to the palette. Establish a connection from the Upstream node (Data Source node) to the Downstream node (Model Apply node).
You may add additional Data Source nodes for test and train datasets, as shown in the screenshot here. Figure 30: Model Apply node
-
Once you connect the nodes, define the settings. Click on the node to open the settings pane. If the Settings pane is not visible, click
on the bottom right to expand the pane.Figure 31: Settings - Model Apply node
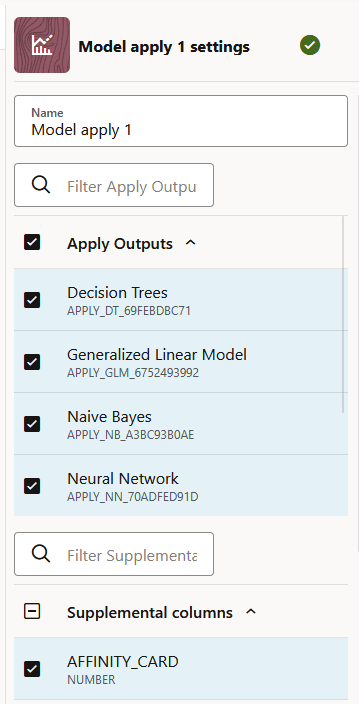
Description of the illustration settings-model-apply-node.png
-
Right click on the node or click on the ellipses and then click Run. Once the node runs successfully, it is indicated by the
icon, as shown in the screenshot below.Figure 32: Model Apply node in the workflow
-
Once the node is run successfully, right-click on the node and then click Results to view the results.
Figure 33: Results - Model Apply node
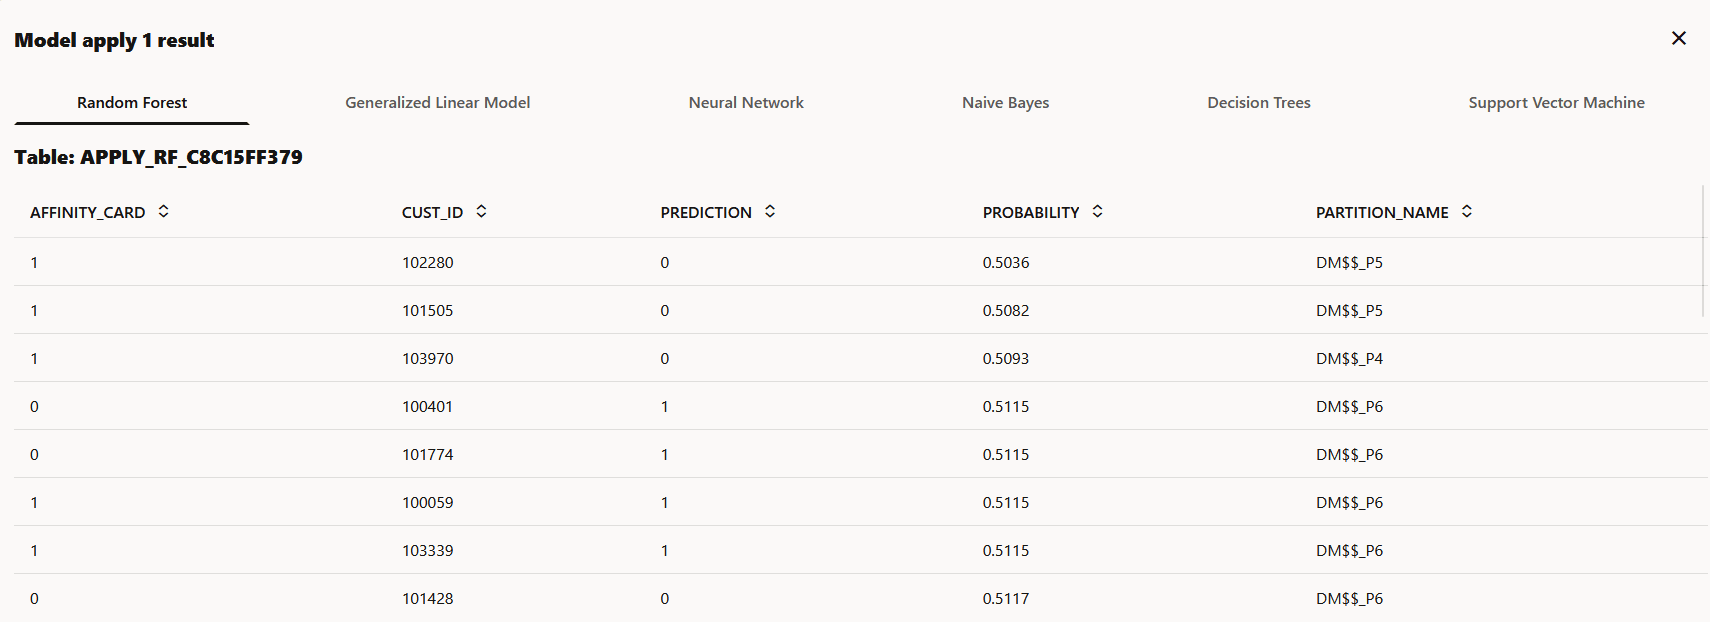
Description of the illustration results-model-apply-node.png
Note: The Model Apply node is a terminal node. You cannot add any downstream nodes to it.
Deploy a model
Deploying a model creates an Oracle Machine Learning Services endpoint that can be used for scoring.
You can deploy a model directly from the Model Build node in the Oracle Machine Learning workflow.
To deploy a model:
-
Open the workflow and right-click on the Model Build node. You may also click on the ellipses on the node. This opens the right-click menu.
-
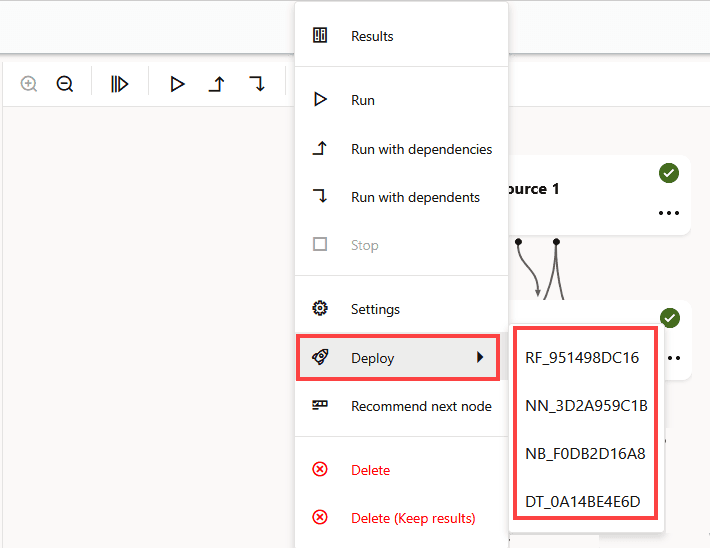
Click Deploy. The models are listed.
Figure 34: Deploy option in Model Build node
-
Click on the model you want to deploy. The Deploy Model dialog opens.
Note: The model name begins with a prefix made up of the first two letters of the algorithm name. For example, the model name RF_951498DC16 indicates that the model was built using the Random Forest algorithm. Similarly, NN indicates Neural Network, NB indicates Naive Bayes, DT indicates Decision Tree and so on.
Once you’ve built an in-database model using Oracle Machine Learning Workflow, it is ready to be used in SQL queries. As such it is already “deployed.” You can grant access to this model to other schemas, export this model and import it into another database for deployment, and deploy this model to OML Services, which is enabled directly through the Oracle Machine Learning Workflow UI. OML Services deployment supports lightweight, real-time scoring using REST, among other features.
-
In the Deploy Model dialog, define the following:
Figure 35: Deploy Model dialog
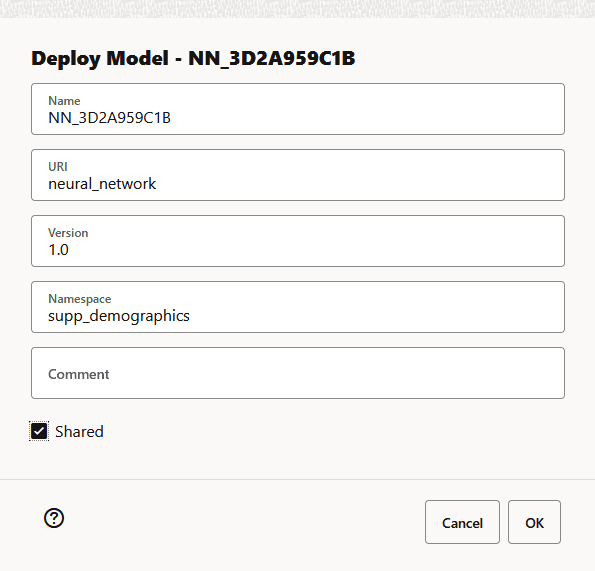
Description of the illustration deploy-model-dialog-wf.png
-
In the Name field, the system-generated model name is displayed here by default. This is the name the model for use in OML Services. The in-database model name remains unchanged. You can edit this name, which must be a unique alphanumeric name with maximum 50 characters.
-
In the URI field, enter a name for the model URI. The URI must be alphanumeric, and the length must be max 200 characters. In the example here, the
neural_networkis the name provided for URI. -
In the Version field, enter a version of the model. The version must be in the format
x.xwherexis a number. -
In the
Namespacefield, enter a name for the model namespace. In the example here,supp_demographicsis the name provided for Namespace. This is an optional field. -
In the Comments field, you may enter any comments.
-
Click Shared to allow users with access to the database schema to view and deploy the model.
-
Click OK.
-
-
After a model is successfully deployed, it is listed in the Deployments tab on the Models page.
Figure 36: Deployed models in the Deployments tab
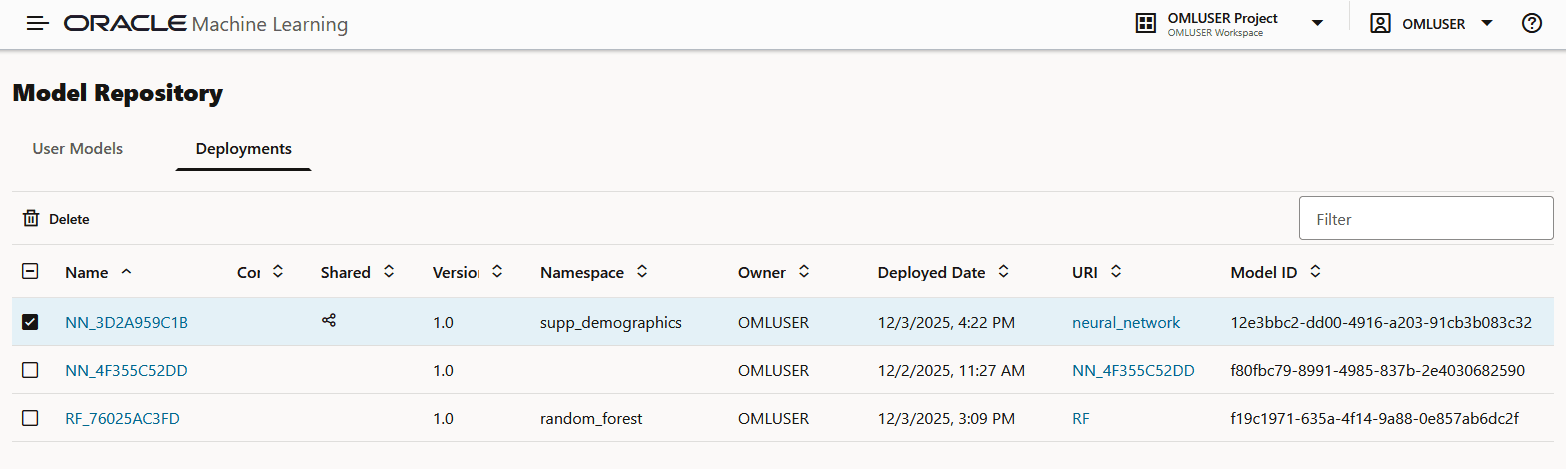
Description of the illustration deployments-tab.png
In the screenshot here, the model
NN_3D2A959C1Bdeployed in steps 4 is listed on the Deployments tab.
Related Topics