14.3.2 RDF Data Page
You can manage and query RDF objects in the RDF Data page.
Figure 14-23 RDF Data Page
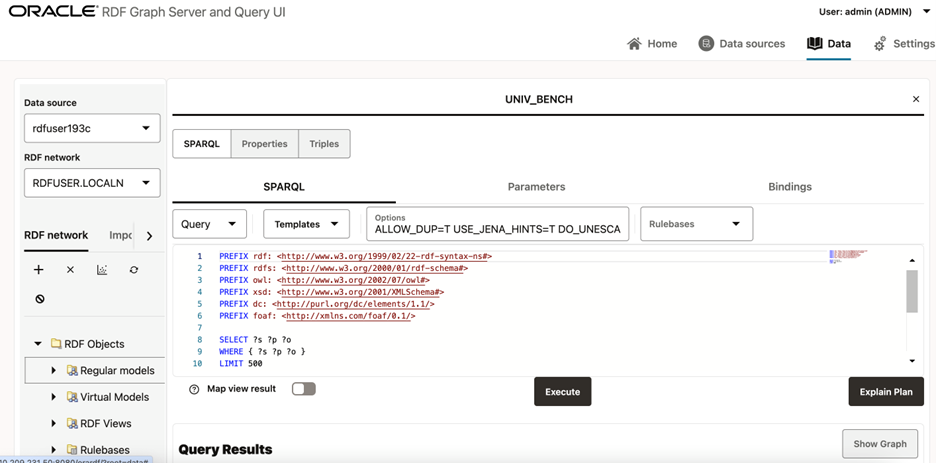
The left panel contains information on the available RDF data in the data source. The right panel is used for opening properties of a RDF object. Depending on the property type, SPARQL queries and SPARQL updates can be executed.
- Data Source Selection
- Semantic Network Actions
- Importing Data
- SPARQL Query Cache Manager
- RDF Objects Navigator
- Data Source Published Datasets Navigator
- Performing SPARQL Query and SPARQL Update Operations
- Publishing Oracle RDF Models
- Published Dataset Playground
- Support for Result Tables
- Advanced Graph View
- Database Views from RDF Models
Parent topic: Getting Started with RDF Graph Query UI
14.3.2.1 Data Source Selection
The data source can be selected from the list of available data sources present in the Figure 14-23.
Figure 14-24 RDF Network
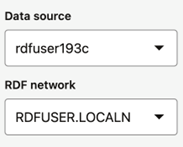
Select the desired Oracle RDF semantic network for the selected data source. Each network is identified by a network owner and network name.
Parent topic: RDF Data Page
14.3.2.2 Semantic Network Actions
You can execute the following semantic network actions:
Figure 14-25 RDF Semantic Network Actions

- Create a semantic network.
- Delete a semantic network.
- Gather statistics for a network.
- Refresh network indexes.
- Purge values not in use.
Parent topic: RDF Data Page
14.3.2.3 Importing Data
For Oracle semantic networks, the process of importing data into a RDF model is generally done by bulk loading the RDF triples that are available on staging table.
Figure 14-26 RDF Import Data Actions

The available actions include:
-
Upload one or more RDF files into a couple of Oracle RDF Graph staging tables. The staging table with suffix
_CLOBwill contain records with object values having length greater than 4k. These staging tables can be reused in other bulk load operations. Files with extensions.nt(N-triples),.nq(N-quads),.ttl(Turtle),.trig(TriG), and.jsonld(JsonLD) are supported for import. There is a limit of file size to be imported, which can be tuned by administrator.Also, zip files can be used to import multiple files at once. However, the zip file is validated first, and will be rejected if any of the following conditions occur:
- Zip file contains directories
- Zip entry name extension is not a known RDF format (.nt, .nq, .ttl, .trig, .jsonld)
- Zip entry size or compressed size is undefined
- Zip entry size does exceed maximum unzipped entry size
- Inflate ratio between compressed size and file size is lower than minimum inflate ratio
- Zip entries total size does exceed maximum unzipped total size
-
Bulk load the staging table records into an Oracle RDF model.
-
View the status of bulk load events.
Parent topic: RDF Data Page
14.3.2.4 SPARQL Query Cache Manager
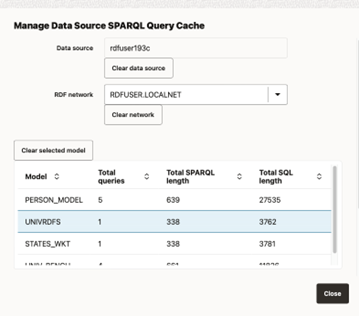
SPARQL queries are cached data source, and they apply to Oracle data sources. The translations of the SPARQL queries into SQL expressions are cached for Oracle RDF network models. Each model can stores up to 64 different SPARQL queries translations. The Query Cache Manager dialog, allows user to browse data source network cache for queries executed in models.
Figure 14-27 SPARQL Query Cache Manager
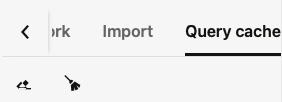
You can clear cache at different levels. The following describes the cache cleared against each level:
- Data source: All network caches are cleared.
- Network: All model caches are cleared.
- Model: All cached queries for model are cleared.
- Model Cache Identifier: Selected cache identifier is cleared.
Figure 14-28 Manage SPARQL Query Cache
Parent topic: RDF Data Page
14.3.2.5 RDF Objects Navigator
The navigator tree shows the available RDF objects for the selected data source.
-
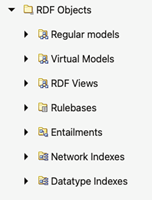
For Oracle data sources, it will contain the different concept types like models, virtual models, view models, RDF view models, rule bases, entailments, network indexes, and datatype indexes.
Figure 14-29 RDF Objects for Oracle Data Source
-
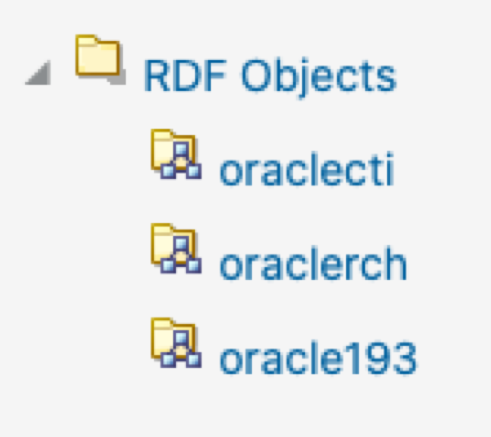
For endpoint RDF data sources, the RDF navigator will have a list of names representing the available RDF datasets in the RDF store.
Figure 14-30 RDF Objects from capabilities
-
If an external RDF data source does not have a capabilities URL, then just a default dataset is shown.
Figure 14-31 Default RDF Object

To execute SPARQL queries and SPARQL updates, open the selected RDF object in the RDF objects navigator. For Oracle RDF objects, SPARQL queries are available for models (regular models, virtual models, and view models).
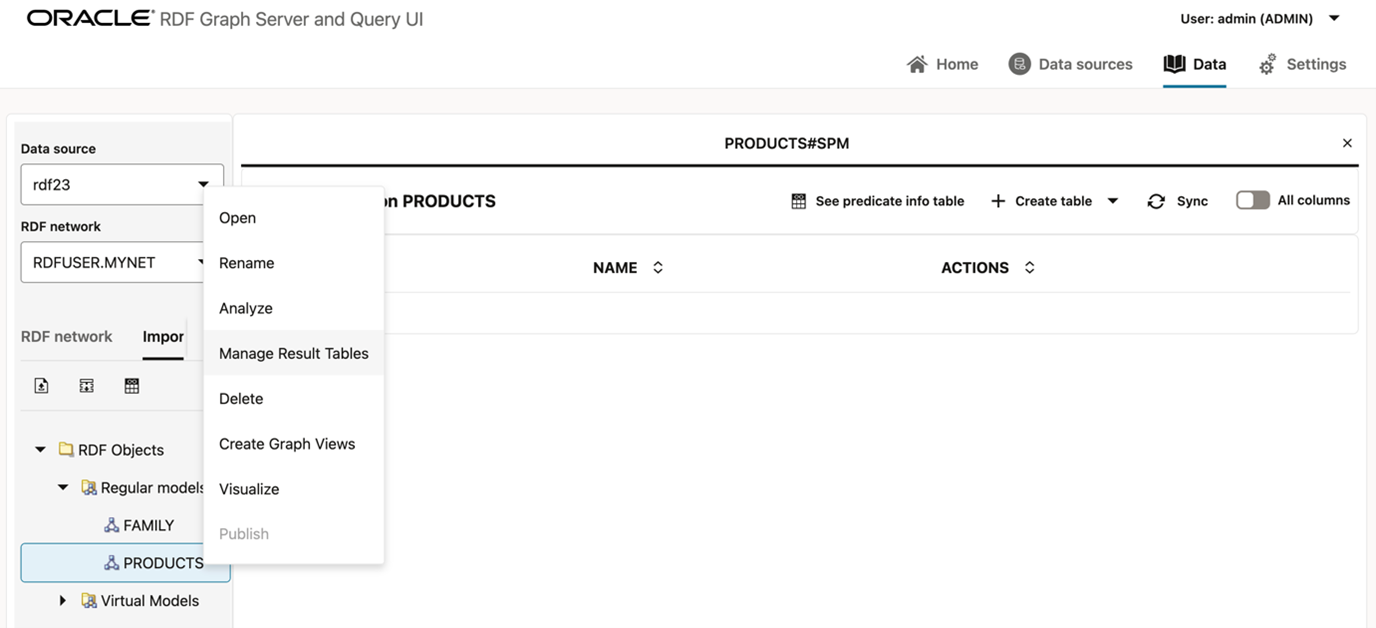
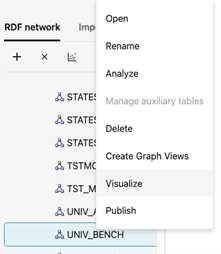
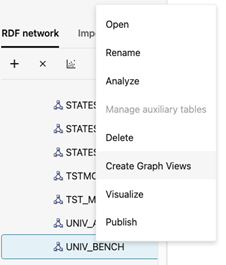
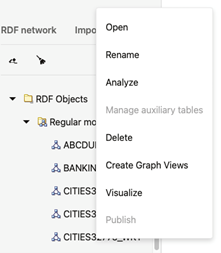
Different actions can be performed on the navigator tree nodes. Right-clicking on a node under RDF objects will bring the context menu options (such as Open, Rename, Analyze, Manage auxiliary tables, Delete, Create Graph Views, Visualize, and Publish) for that specific node.
- Publish menu item will be enabled only if the selected RDF data source is public.
- Guest users cannot perform actions that require a write privilege.
Figure 14-32 RDF Navigator - Context Menu
Parent topic: RDF Data Page
14.3.2.6 Data Source Published Datasets Navigator
If the selected RDF data source is public, a navigator node with the public datasets is displayed on the menu tree as shown in the following figure:
Figure 14-33 Data Source Published Datasets Navigator

Parent topic: RDF Data Page
14.3.2.7 Performing SPARQL Query and SPARQL Update Operations
To execute SPARQL queries and updates, open the selected RDF object in the RDF objects navigator. For Oracle RDF objects, SPARQL queries are available for regular models, virtual models, and view models.
You can define the following parameters for SPARQL queries:
- SPARQL: The query string.
- RDF options: Oracle RDF options to be used when processing a query (See Additional Query Options for more information.).
- Runtime parameters: Fetch size, query timeout and others (this is applied to Oracle RDF data sources).
- Rulebases: Rulebase names associated with RDF model in an entailment. If none, then the selection box will be empty.
- Binding parameters: The expression
?ora__bindis used as a binding parameter in a SPARQL string. Each binding parameter is defined by a type (uri or literal) and a value. For example:SELECT ?s ?p ?o WHERE { ?s ?p ?ora__bind } LIMIT 500An example of JSON representation of a binding parameter that can be passed to a REST query service is:
{ "type" : "literal", "value" :
                        "abcdef" }
The following figure shows the SPARQL query page, containing the graph view.
Figure 14-34 SPARQL Query Page
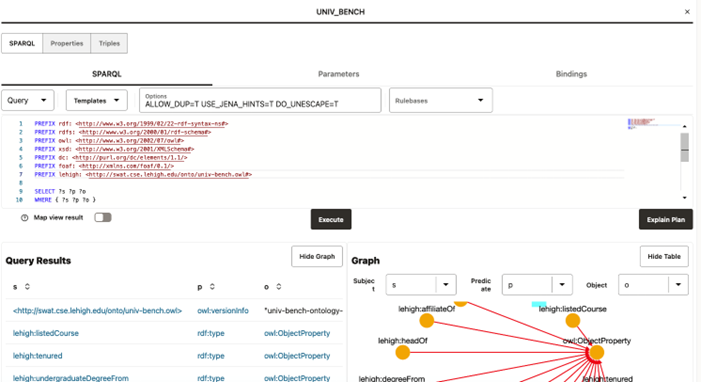
The number of results on the SPARQL query is determined by the limit parameter in SPARQL string, or by the maximum number of rows that can be fetched from server. As an administrator you can set the maximum number of rows to be fetched in the settings page.
A graph view can be displayed for the query results. On the graph view, you must map the columns for the triple values (subject, predicate, and object). In a table view, the columns that represent URI values have hyperlinks.
Besides the Execute button to run the SPARQL query, there is also the Explain Plan button to retrieve the SQL query plan for the SPARQL. This basically displays a dialog with the EXPLAIN PLAN results and the SPARQL translation.
Figure 14-35 SQL EXPLAIN PLAN for SPARQL Translation
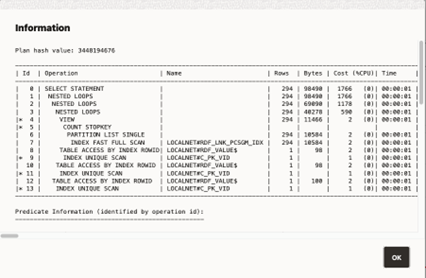
Description of "Figure 14-35 SQL EXPLAIN PLAN for SPARQL Translation"
For Oracle data sources, if the SPARQL query selects an RDF object value
that represents a GeoSPARQL data type (such as WKT,
GML, KML, or GeoJSON), a map
visualization can be displayed by switching on Map view result.
In this case, the SPARQL query must select the geometry attribute which is an RDF
literal of a GeoSPARQL data type. On execution, this query will produce a GeoJSON result
which is then passed to the map component for visualization. For example:
Figure 14-36 Map Visualization for GeoSPARQL Data Types in a SPARQL Query
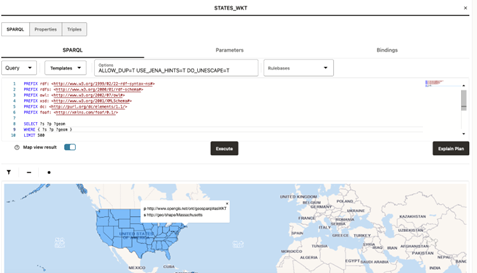
Description of "Figure 14-36 Map Visualization for GeoSPARQL Data Types in a SPARQL Query"
Parent topic: RDF Data Page
14.3.2.8 Publishing Oracle RDF Models
Note:
It is important to be aware that by enabling RDF data publishing and defining a public RDF data source, your public URL endpoints for RDF datasets are exposed. This endpoint URL can be used directly in applications without entering credentials.To publish an Oracle RDF model as a dataset:
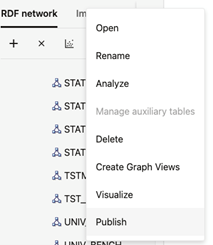
- Right-click on the RDF model and select Publish from the menu
as shown:
Figure 14-37 Publish Menu
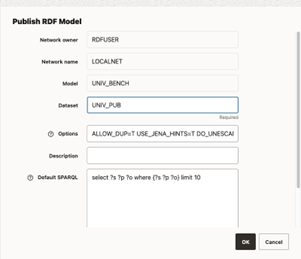
- Enter the Dataset name (mandatory), Description, and Default
SPARQL. This default SPARQL can be overwritten on the REST request.
Figure 14-38 Publish RDF Model
- Click OK.
The public endpoint GET URL for the dataset is displayed. Note that the POST request can also be used to access the endpoint.
Figure 14-39 GET URL Endpoint
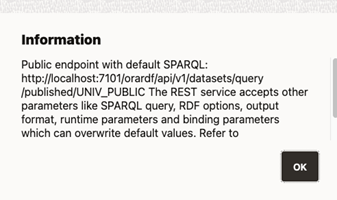
This URL uses the default values defined for the dataset and follows the pattern shown:
http://${hostname}:${port_number}/orardf/api/v1/datasets/query/published/${dataset_name}You can override the default parameters stored in the dataset by modifying the URL to include one or more of the following parameters:- query: SPARQL query
- format: Output format (
JSON,XML,CSV,TSV,GeoJSON,N-Triples,Turtle) - options: String with Oracle RDF options
- rulebases: Rulebase names associated with dataset RDF model in an entailment
- params: JSON string with runtime parameters
(
timeout,fetchSize, and others) - bindings: JSON string with binding parameters (URI or literal values)
The following shows the general pattern of the REST request to query published datasets (assuming the context root as
orardf):http://${hostname}:${port_number}/orardf/api/v1/datasets/query/published/${dataset_name}?datasource=${datasource_name}&query=${sparql}&format=${format}&options=${rdf_options}¶ms=${runtime_params}&bindings=${binding_params}In order to modify the default parameters, you must open the RDF dataset definition by selecting Open from the menu options shown in the following figure or by double clicking the published dataset:Figure 14-40 Open an RDF Dataset Definition
 The RDF dataset definition for the selected published dataset opens as shown:
Figure 14-41 RDF Dataset Definition
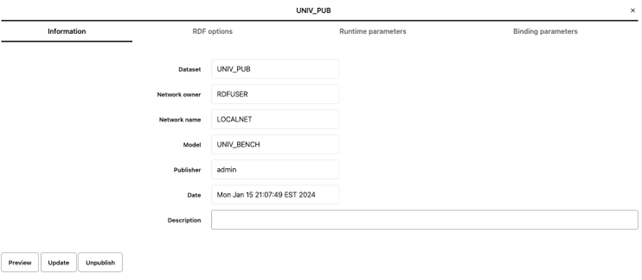
You can update the default parameters and preview the results.
Note:
- RDF user with administrator privileges can update and unpublish any dataset.
- RDF user with read and write privileges can only manage the datasets that the user created.
- RDF user with read privileges can only query the dataset.
Parent topic: RDF Data Page
14.3.2.9 Published Dataset Playground
You can explore the published RDF datasets from a public web page.
You can access the page using the following URL format:
{protocol}://{host}:{port}/{app_name}/public.html
For example:
http://localhost:7101/orardf/public.html
The public web page is displayed as shown:
Figure 14-42 Public Web Page
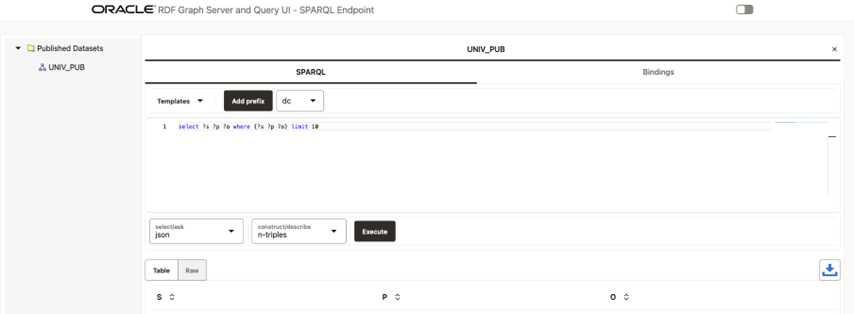
The main components of this public page are:
- Published Datasets: contains the names of the
published RDF datasets for public RDF data source. To open the RDF dataset double
click it or right click the tree dataset and execute the Open menu item as
shown:
Figure 14-43 Opening a Published Dataset on the Public Page

- The tab panel on the right allows you to execute SPARQL queries against
the published RDF dataset. SPARQL query results are displayed in tabular as well as
graph view formats. However, if the Accessibility switch on
the top right corner of the page is switched
ON, then the results are only displayed in tabular format.The following options are supported in the tab panel:
- Templates: SPARQL template queries to use.
- Add prefix: click to add the selected prefix in the combo box to a SPARQL query.
- SPARQL: enter the SPARQL to be executed in the text area.
- select/ask: select the output format for
SPARQL
SELECTand SPARQLASKqueries. - construct/describe: select the output
format for SPARQL
CONSTRUCTand SPARQLDESCRIBEqueries. - Execute: click this button to execute the SPARQL query against the RDF public endpoint.
- Table: shows the result in a tabular format.
- Raw: shows the raw SPARQL result on specified format returned from server.
- Download: click
 to download the raw response.
Parent topic: RDF Data Page
14.3.2.10 Support for Result Tables
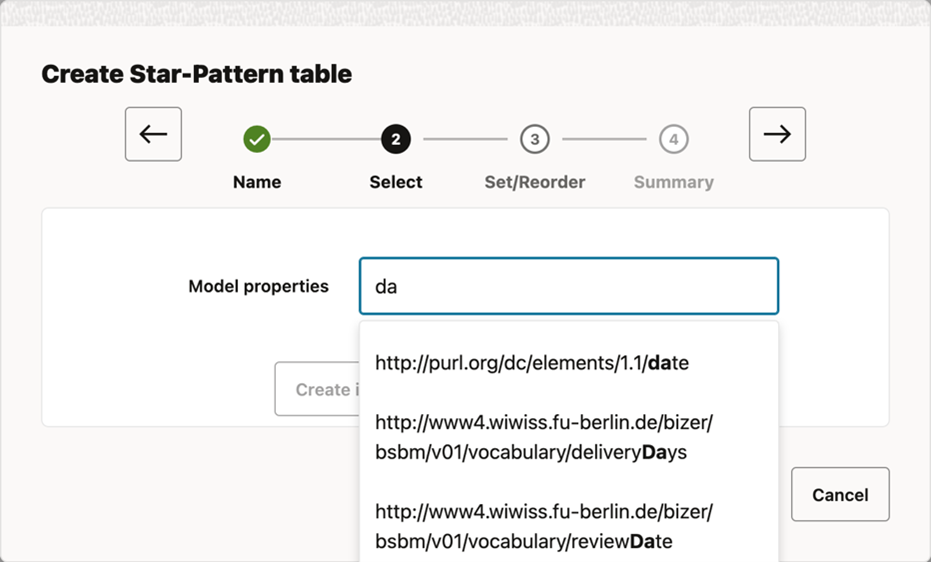
Result tables (also known as Subject-Property-Matrix (SPM) auxiliary tables) can be used to speed up SPARQL query execution. It is recommended you first refer to Speeding up Query Execution with Result Tables, for a detailed description of result tables. These auxiliary tables are associated with individual RDF graphs. Once they are created, they are automatically used during execution of SPARQL queries, unless specific options (see SPARQL Query Options for Result Tables) are passed in to indicate otherwise (note that the query cache may need to be cleared if the same SPARQL query is to be executed right after creating a result table).
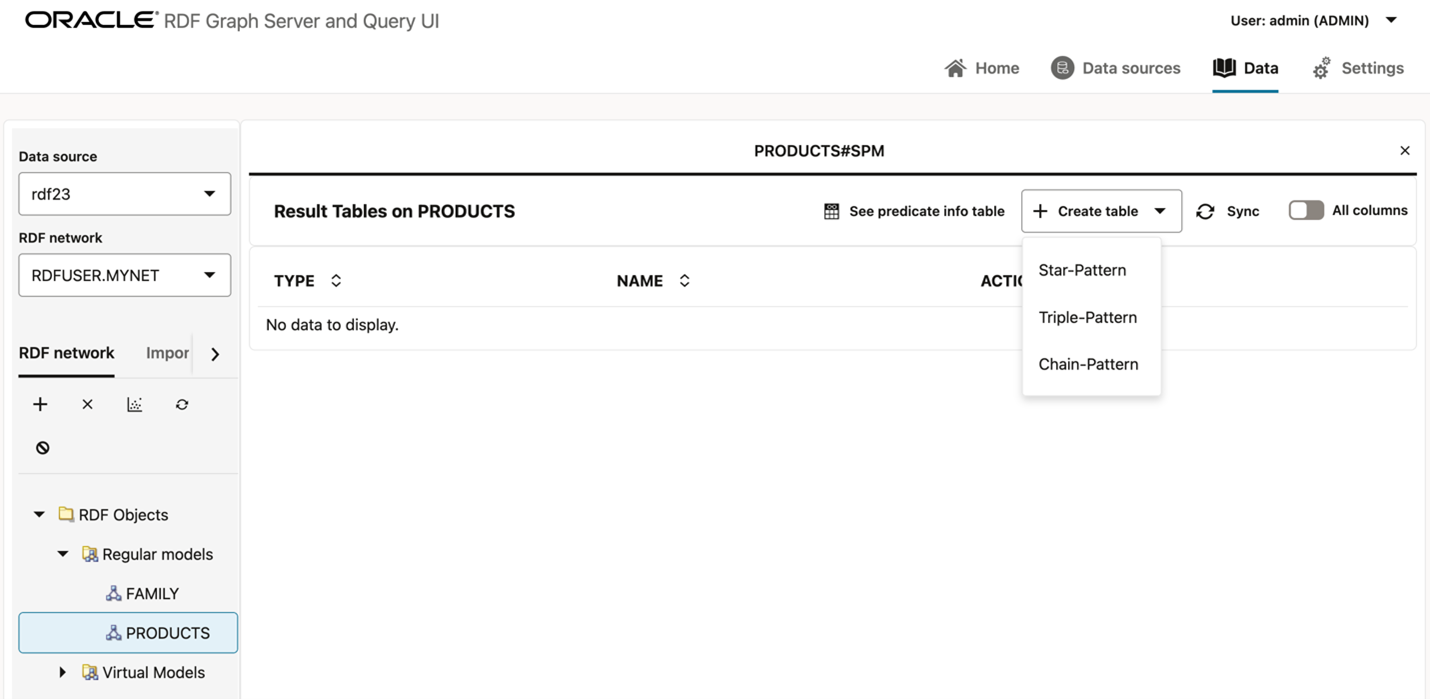
There are three types of result tables based on the type of the query pattern used for producing the results to be stored:
- Star-Pattern tables (also known as Single-Valued Property or SVP tables) hold values
for single-valued RDF properties. A property
pis single-valued in an RDF model if each resource in the model has at most one value forp. - Triple-Pattern tables (also known as Multi-Valued Property (MVP) tables) hold values
for individual RDF properties.The property used for a triple-pattern table may be
single-valued or multi-valued. (A property p is multi-valued in an RDF graph if it
contains two triples
(s p o1)and(s p o2)witho1not equal too2.) - Chain-Pattern tables (also known as Property Chain (PCN) tables) hold paths in the
RDF graph. A sequence of triples form a path if for each consecutive pair of
triples,
TiandTj, the object value ofTiis equal to the subject value ofTj.
Star-pattern and chain-pattern tables can be used to reduce joins during SPARQL query execution, while triple-pattern tables allow for more compact representation for triples involving individual properties. Additionally, if lexical values are included in the result tables, then joins needed for looking up lexical values can be avoided as well.
The RDF Server and Query UI web application provides support for creation and management of result tables. You can manage these auxiliary tables by right clicking the RDF graph and selecting the Manage Result Tables menu item as shown:
The Result Tables page displays a table which lists the result tables
present in the RDF graph. If you are a first time user, then this table list will be
empty. In such a case, you need to create the Predicate Info Table that is
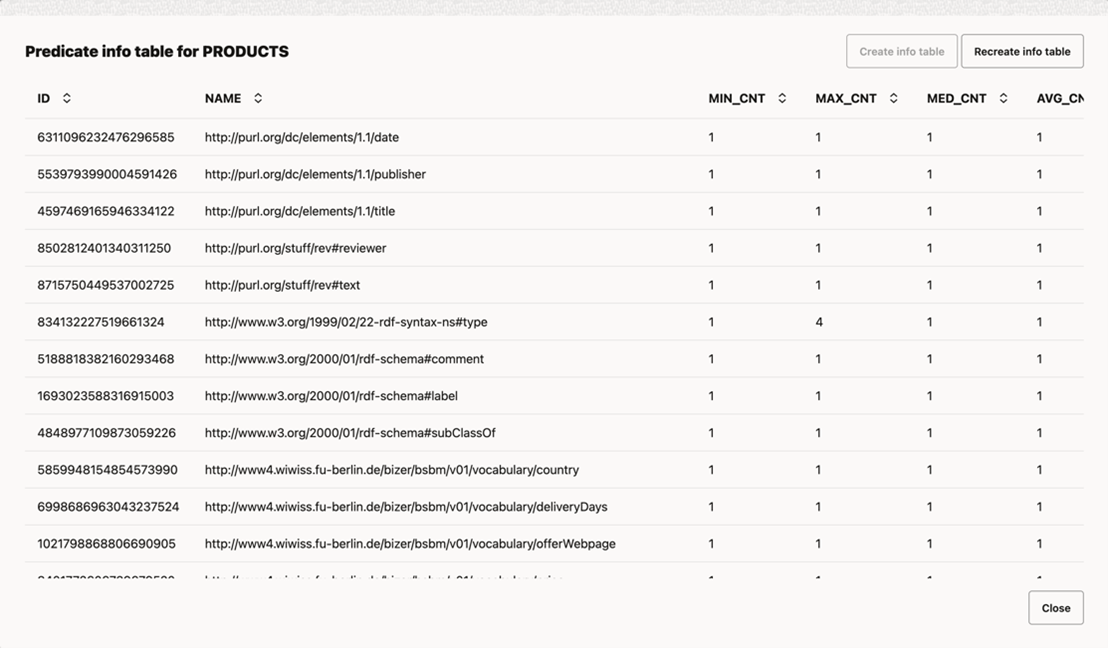
required for creating and managing the result tables. The predicate info table stores
information about each property used as predicate in the RDF graph. For each property
(or its inverse), the stored information includes its id (or negative
id, for the inverse), name, and statistics on
cardinality (that is, the number of triples that use this property) per distinct subject
(or, object, for the inverse). A value of one in the MAX_CNT column
indicates that the property was single-valued when the statistics were last
computed.
To create the predicate info table, click See predicate info table in the table menu bar and then select Create info table. Note that you also have the option to recreate the table at a later time as shown in the following image:
Once the predicate info table is created, you can then create and manage the result tables.
Parent topic: RDF Data Page
14.3.2.10.1 Creating Result Tables
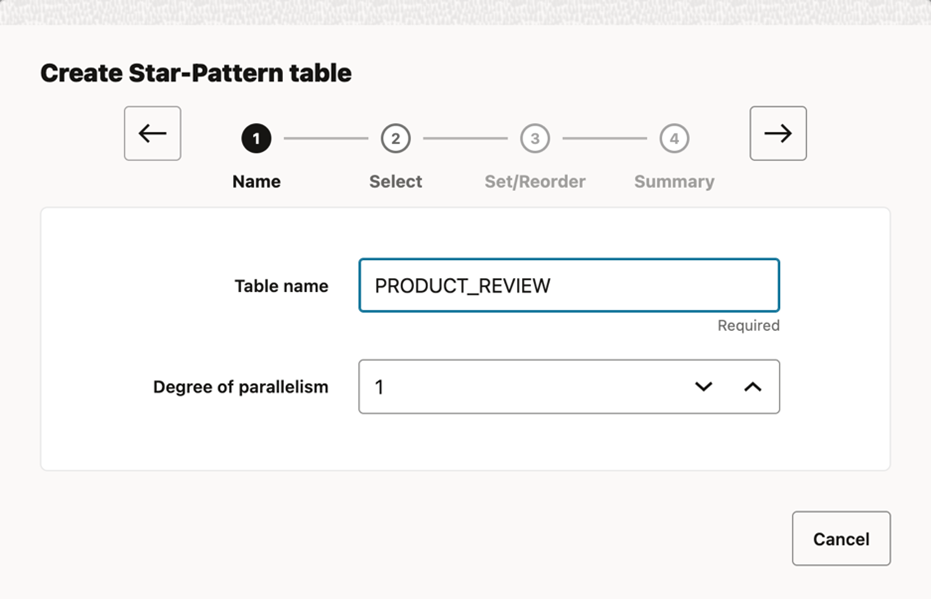
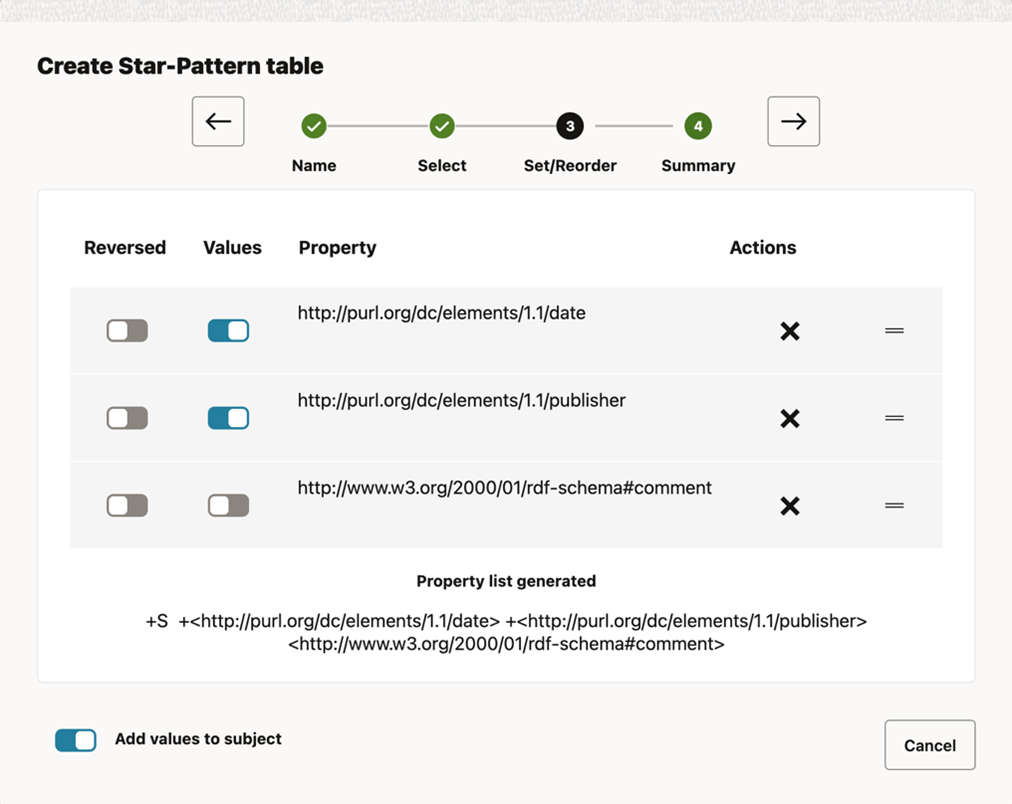
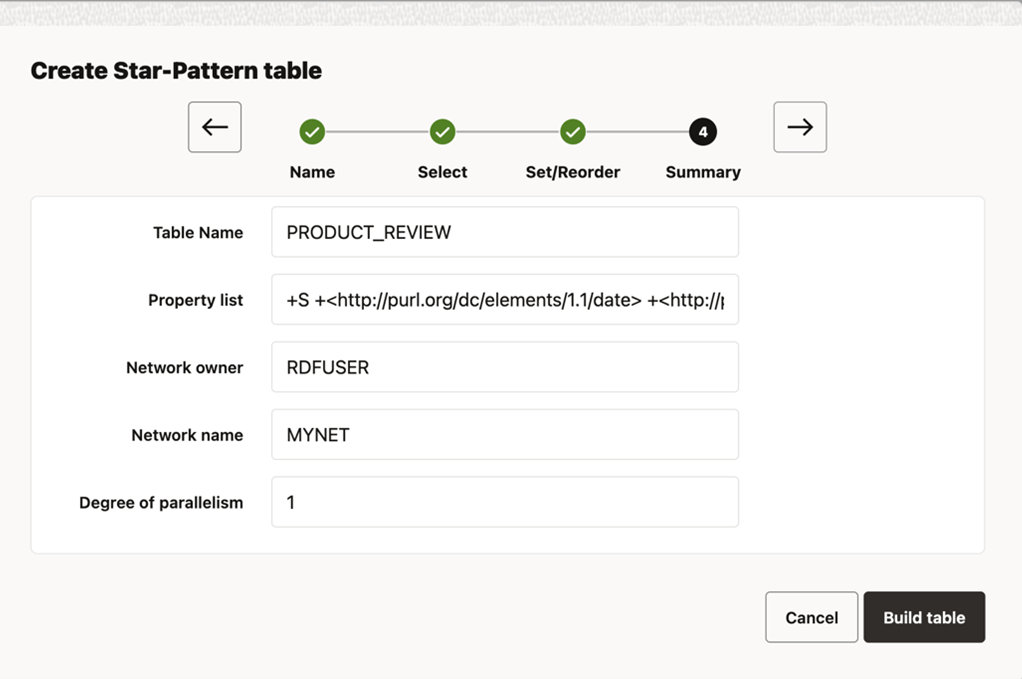
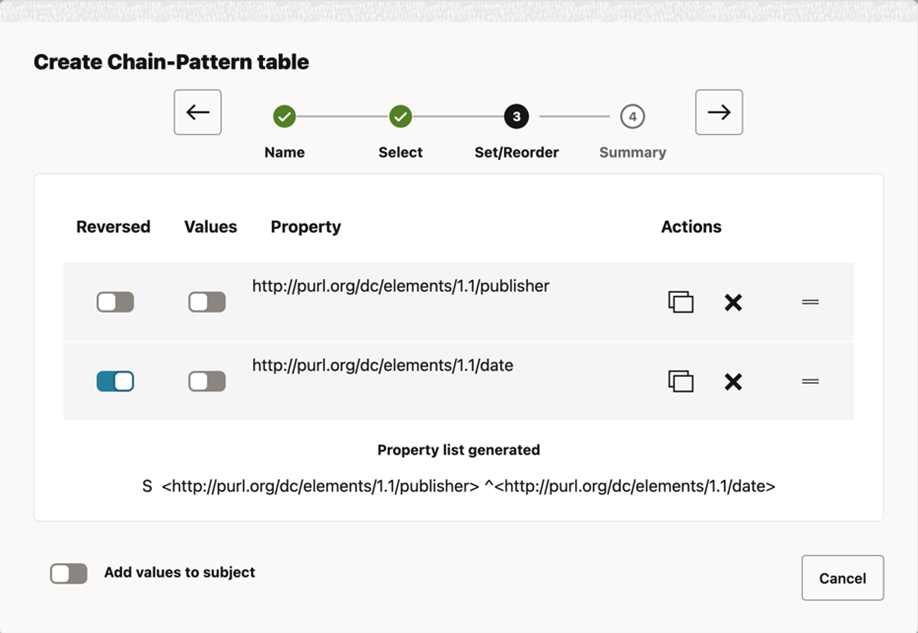
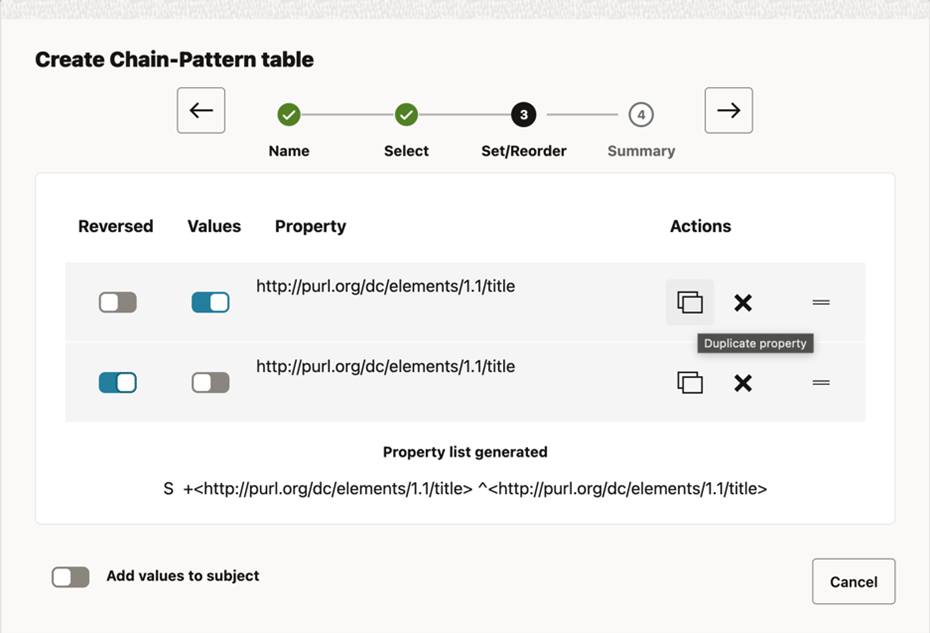
The preceding workflow steps are common when creating any type of result table. However, the following 23ai features are available only for certain types of tables:
- Inverse Property Path: This feature is only available for chain-pattern
or star-pattern tables. It can be enabled individually for each property,
directly from the Set/Reorder properties step. In the following example,
the property
http://purl.org/dc/elements/1.1/dateis shown Reversed. This implies that the subject and object of the triple switch places. See the W3C documentation for more information on inverse property path.Figure 14-51 Configuring Inverse property path
- Multi-Occurrence : This new feature in which the same property can be
replicated multiple times is only available for chain-pattern tables. To
duplicate a property, click the Duplicate property button under the
Actions column on the Set/Reorder step. Note that once the
table is created, for ease of differentiation, each replicated property is
appended an identifier consisting of a “#” followed by a cardinal number.
Parent topic: Support for Result Tables
14.3.2.10.2 Managing Result Tables

Description of the illustration manage_actions_result_table.png
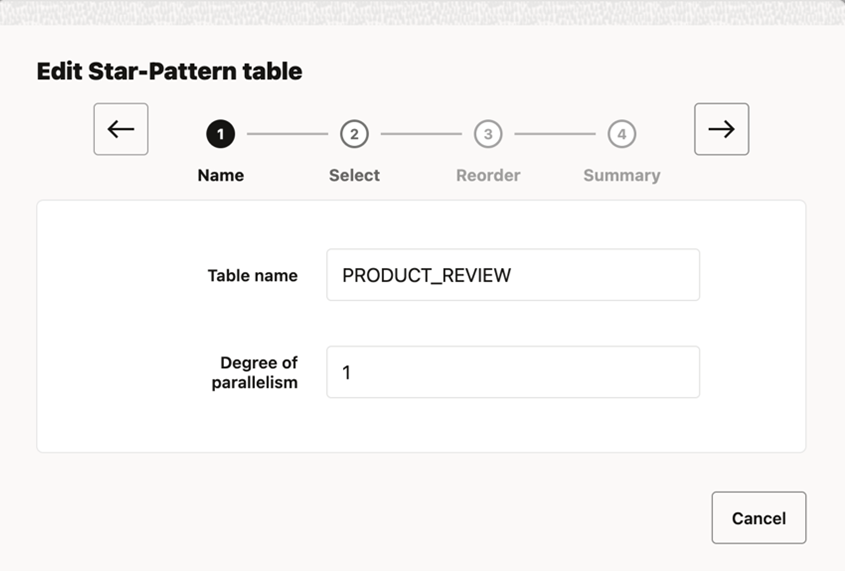
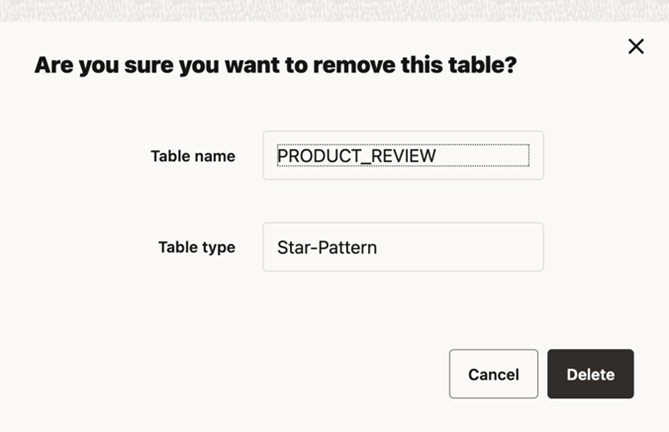
You can then choose to perform any of the following actions:
Parent topic: Support for Result Tables
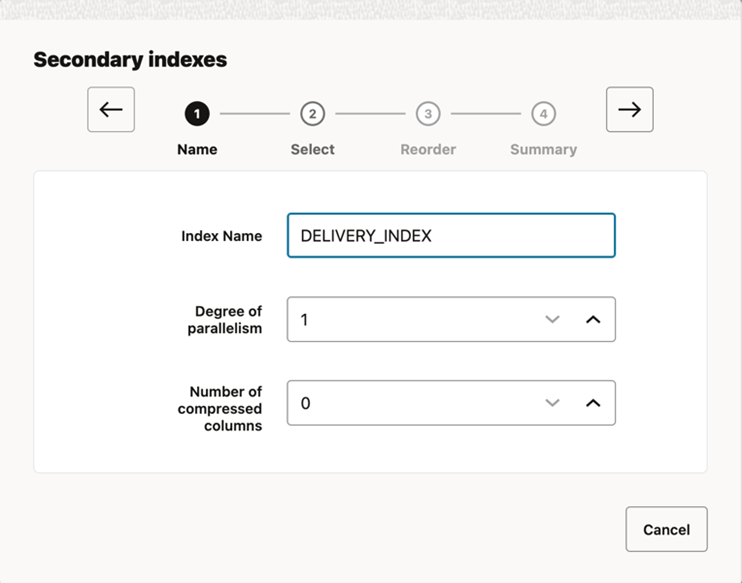
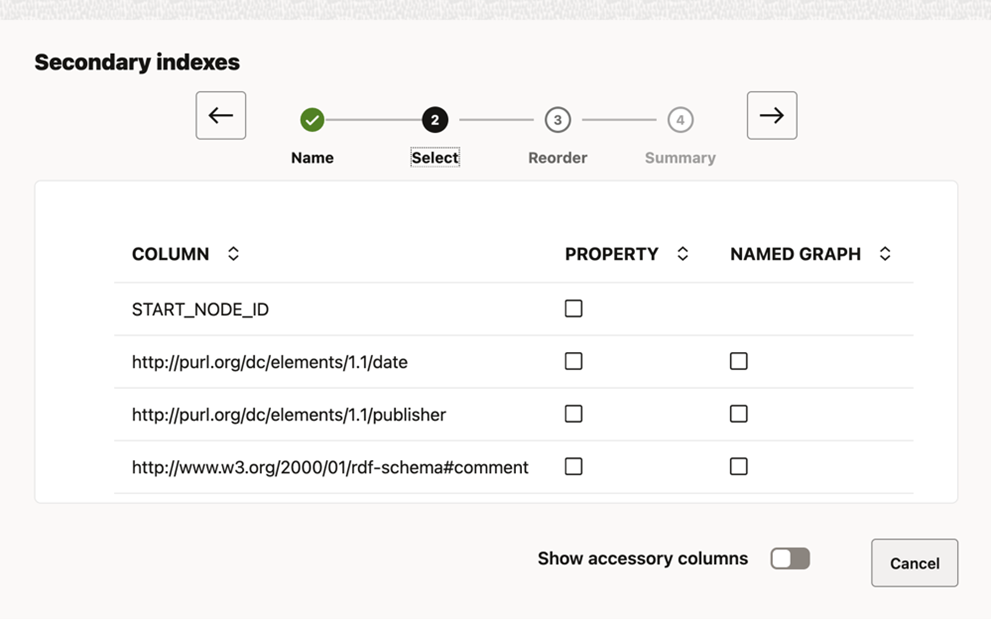
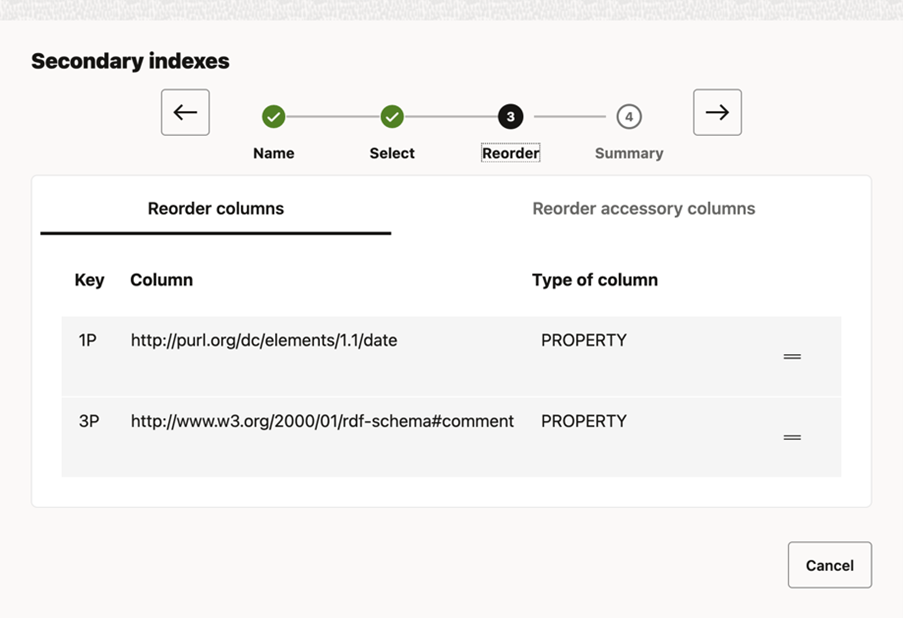
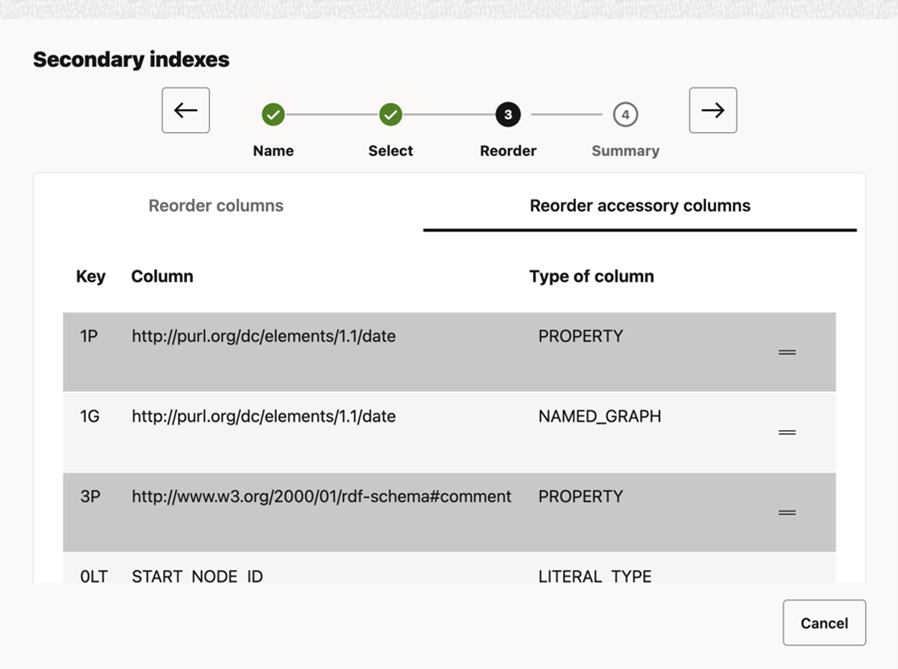
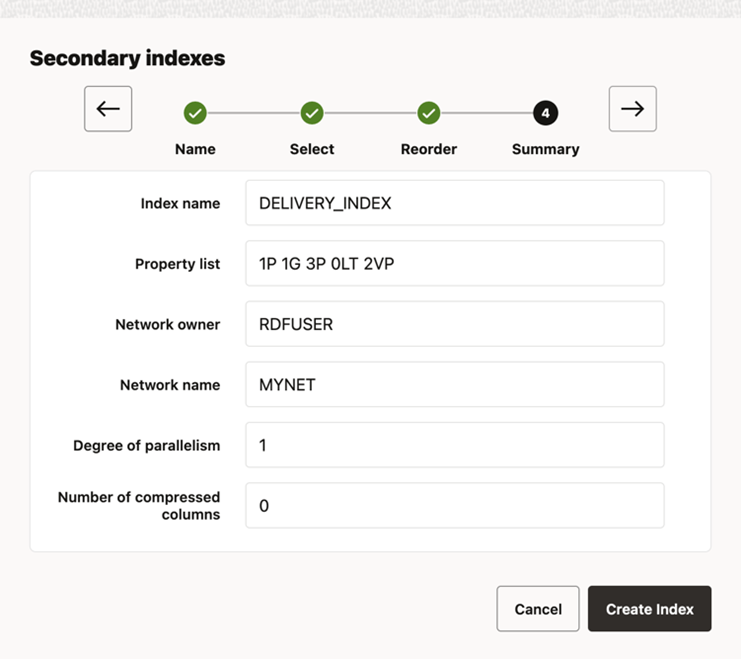
14.3.2.10.2.1 Creating an Index on a Result Table
Parent topic: Managing Result Tables
14.3.2.11 Advanced Graph View
The RDF Graph Query UI supports an advanced graph view feature that allows users to interact directly with the graph visualization. This is unlike the graph displayed on the RDF model editor or public component where the graph view is just an output of the SPARQL results on the paging table.
This section describes the advanced graph view component, starting from the
execution of a SPARQL CONSTRUCT or SPARQL DESCRIBE
query to advanced interaction with the graph visualization.
The main user interface (UI) elements of the advanced graph view component are as shown:
Figure 14-62 Advanced Graph View Components
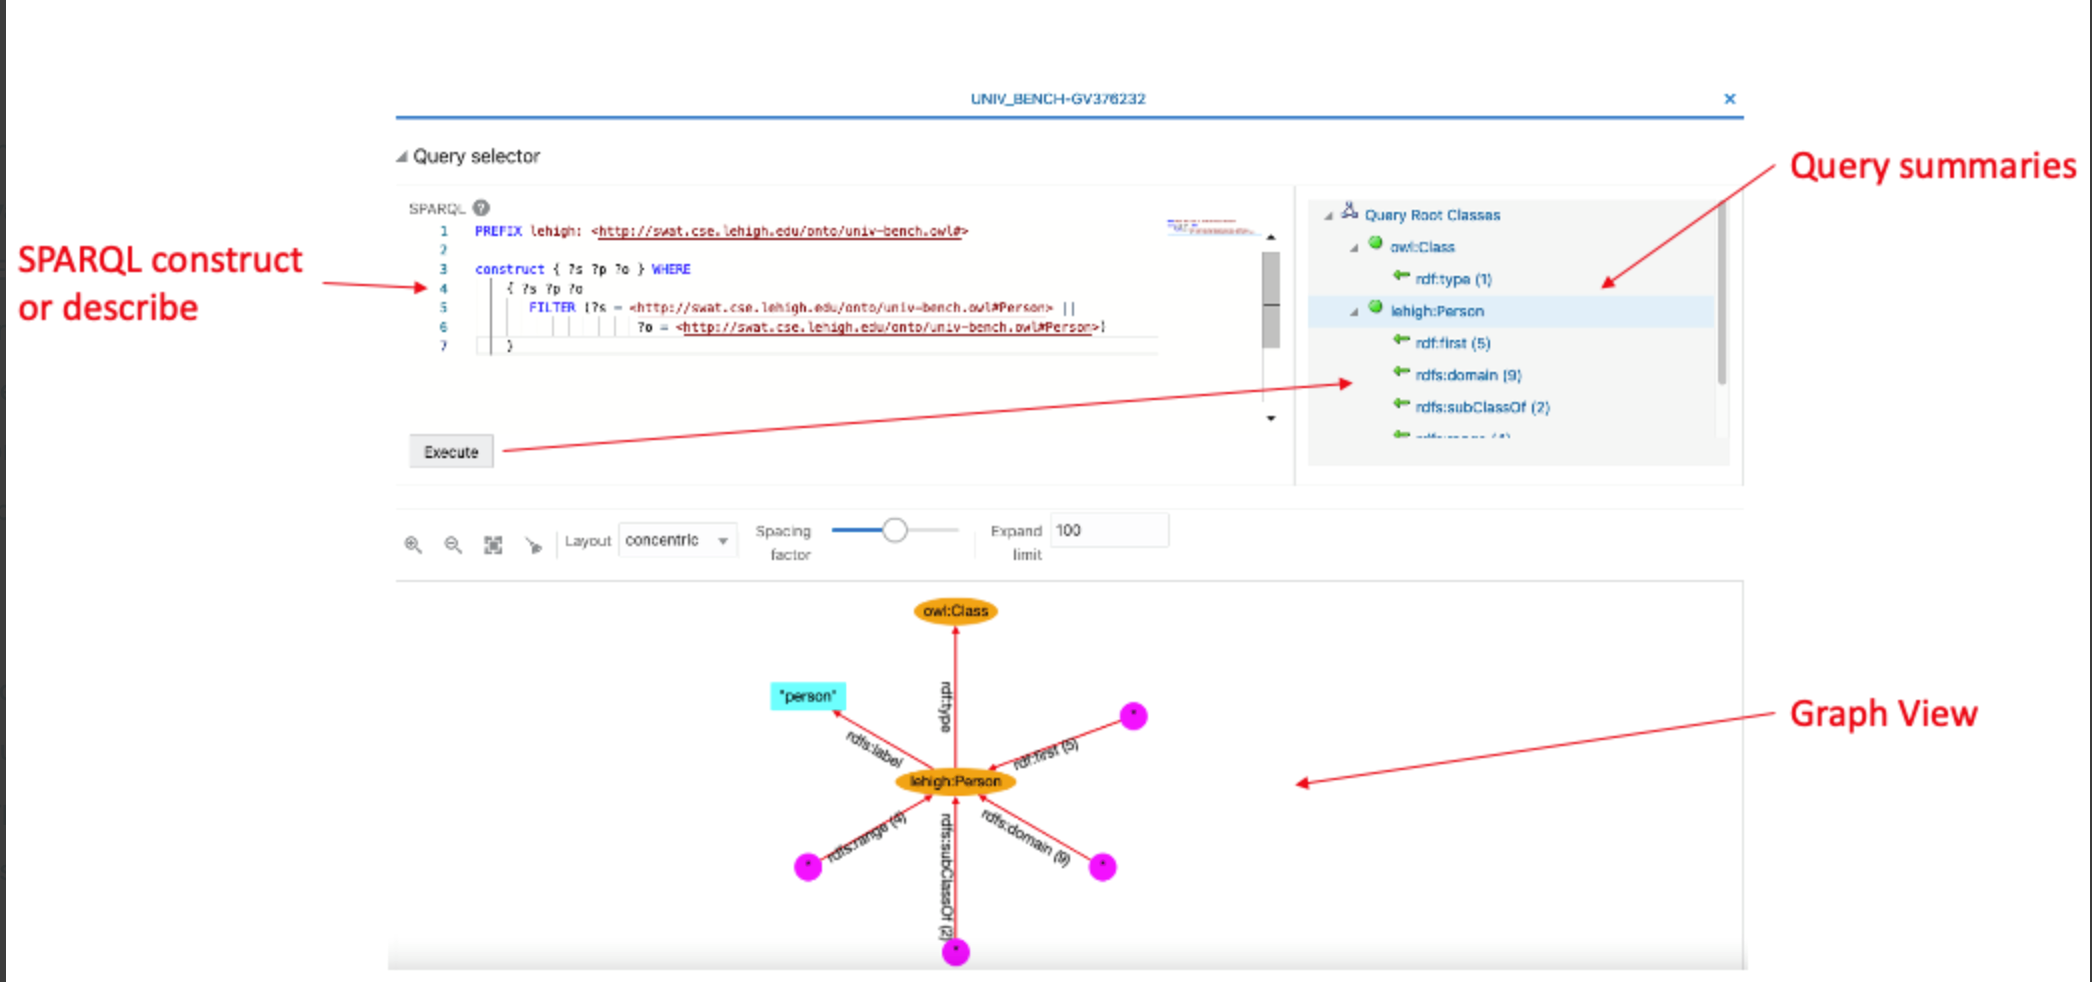
Description of "Figure 14-62 Advanced Graph View Components"
The following describes the UI components seen in the preceding figure:
- SPARQL Query selector contains:
- A text area with the SPARQL query (must be SPARQL
CONSTRUCTor SPARQLDESCRIBE) - A tree with the root classes summaries (counts of incoming and outgoing predicates) resulting from the SPARQL query
- A text area with the SPARQL query (must be SPARQL
- A graph view area that displays the graph with the RDF nodes and edges
To access the advanced graph view feature, right-click on the RDF model and select Visualize as shown:
Parent topic: RDF Data Page
14.3.2.11.1 Query Selector Panel
To start using the advanced graph view feature, you must first execute a
SPARQL CONSTRUCT or SPARQL DESCRIBE query. The
resulting query output is organized as summaries (counts for incoming and outgoing
predicates) for the root classes (in general URI or blank node values).
The following figure shows a SPARQL CONSTRUCT query that
produces two root classes, owl:Class and
lehigh:Person:
Each root class has its own summary of incoming and outgoing predicates. You can double click on a root class to view the graph representation in the graph view panel.
It is highly recommended to define PREFIX expressions on the query to
shorten the result labels in the graph nodes. It also helps to consume less space for
the graphic representation of the nodes. Some well known RDF SPARQL prefixes (such as
rdf, rdfs, owl, and others) are automatically recognized and
can be avoided in the query expression.
As seen in the preceding figure, you can double click the tree node to open the element as a graph in the graph view. You can then interact directly with the graph in the graph view without using the root tree nodes in the Query selector panel. This panel can be collapsed to provide more space on the page for the graph view.
The following figure shows the owl:Class and
lehigh:Person elements displayed in the graph view.
Note that in some cases the SPARQL query execution may generate several root classes. However, it is not necessary to add all the root classes to a graph. This also helps to maintain a clean and readable graph area.
Parent topic: Advanced Graph View
14.3.2.11.2 Graph View
The graph view panel, where the graph is displayed, consists of the following components:
- A toolbar with the following options:
- Zoom Options: Includes zoom in, zoom out, fit all, and clear all actions. Additionally, zoom in and out actions can be achieved with the mouse wheel. Drag to pan graph is also available.
- Layout: A few built-in layouts (such as random, grid, circle, concentric, breadth first, and cose).
- Spacing factor: A slider to adjust the spacing between nodes (useful for lengthy edges).
- Expand limit: The maximum number of node entries that can be expanded for an edge.
- A drawing area with the RDF nodes and edges.
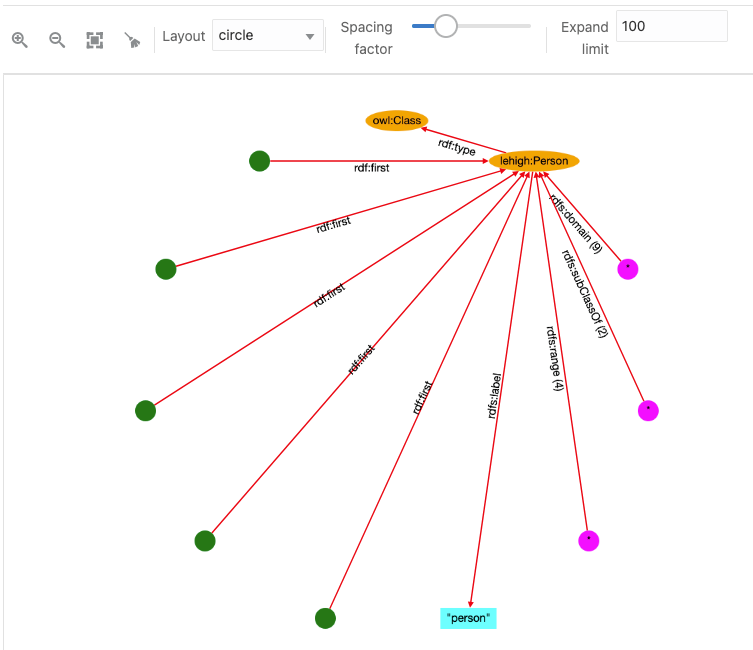
You can interact with the edges and nodes of the graph displayed in the graph view area. Initially, the graph displayed is based on the root class summaries (counts), but you can always expand the elements.
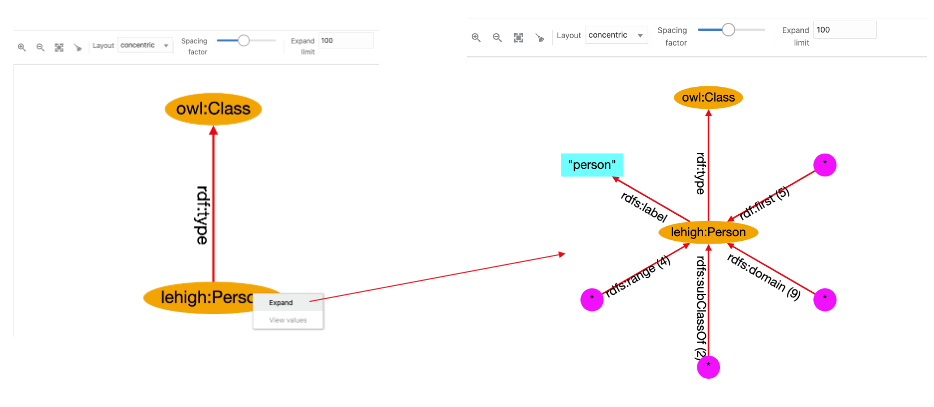
To expand a node in the graph, click on the node and then select Expand. New node elements with new edges linked to the selected node gets added to the graph. For example, in the following figure, the node lehigh:Person is shown expanded:
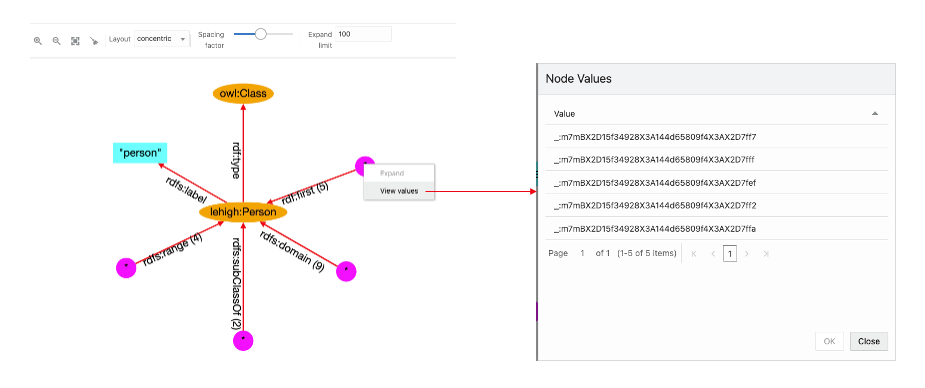
Star nodes (magenta color) contain the values associated with the edge predicate. To see these values, click on the node and select View Values:
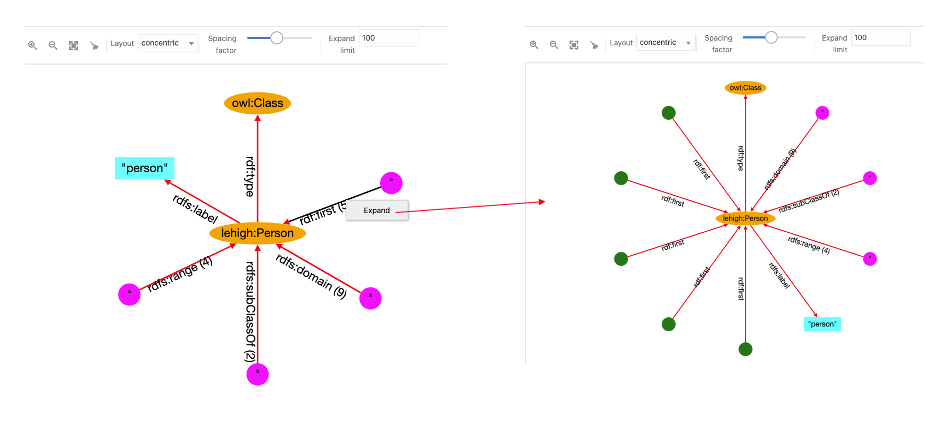
To expand the edge predicate summary, click on the edge and select Expand. Then the star node associated with it will be divided into new nodes and edges in the graph. However, if the expand limit value is lower than the summary count, then all the nodes will not be expanded. For example:
The following figure displays the output for a circular layout:
The following basic conventions apply to the graph displayed in the graph view:
- URI nodes are displayed in orange color with labels inside the ellipse shape.
- Blank nodes are displayed in green color with circle shape. Mousing over the blank node shows its label value.
- Collapsed edges have the predicate with the count (if more than 1).
- Star nodes in magenta color and circle shape contain the values associated with the collapsed edge.
- Literal nodes are displayed with different colors depending on its type. A string literal is shown in cyan color with the label value. For long string values, the label length is reduced and mousing over literal node shows the full label value. Literals with datatype are displayed in different colors, and mousing over them shows the datatype name.
Parent topic: Advanced Graph View
14.3.2.12 Database Views from RDF Models
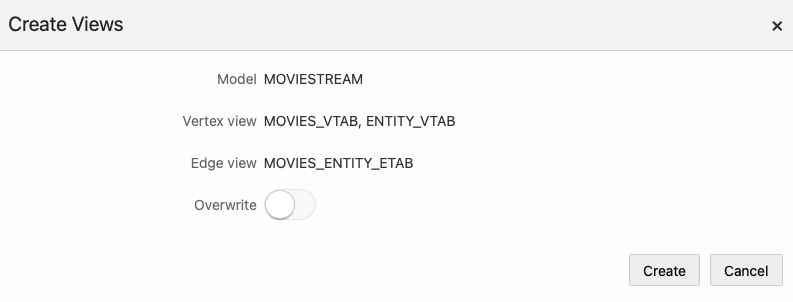
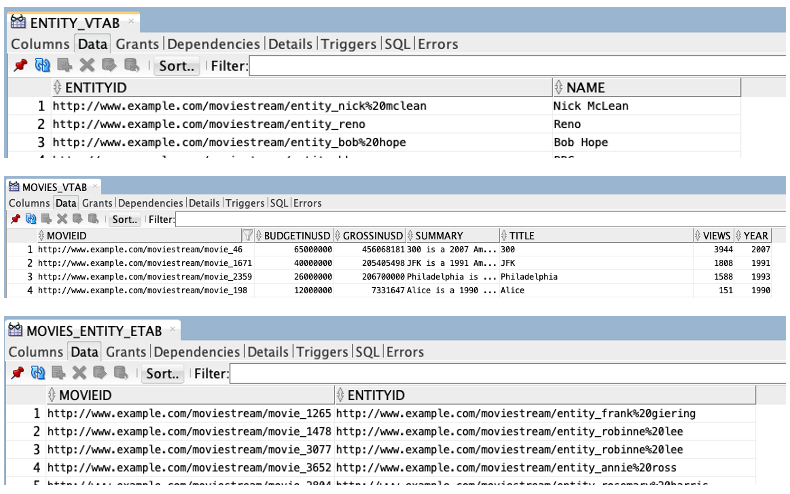
You can create relational views from RDF models. These views can represent a vertex or an edge view of a graph.
SPARQL query patterns can be used as a declarative language for specifying how to build vertex and edge views from RDF data.
It is important to note the following when creating the vertex and edge views from an RDF model:
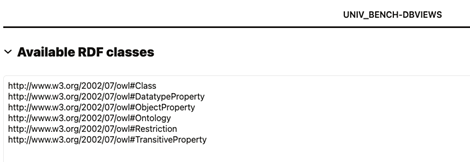
- The RDF model must have classes defined and the application uses a
SPARQL query to retrieve the distinct classes defined on an RDF model. For
example:
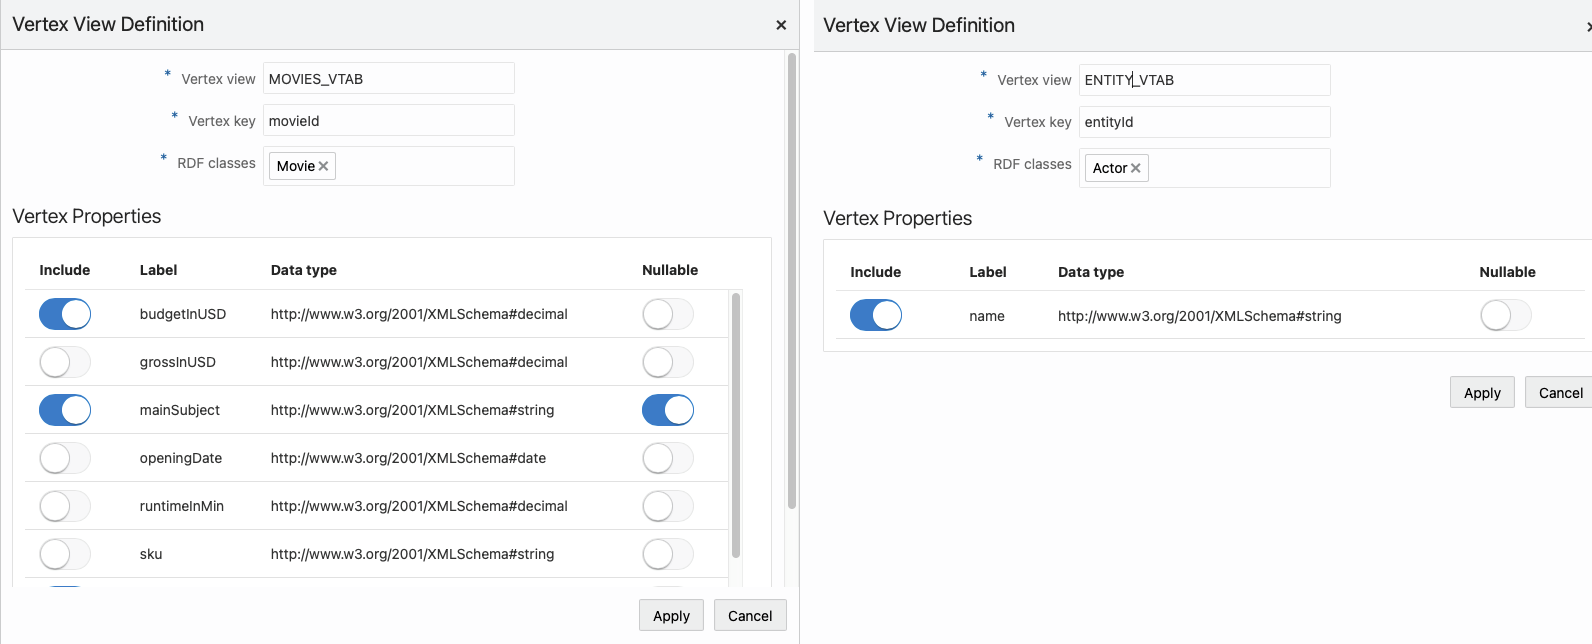
SELECT DISTINCT ?o WHERE { ?s a ?o } order by ?o - One or more RDF classes can define a vertex view. A vertex view
consists of:
- Database vertex view name
- Key attribute name
- Vertex properties from RDF class
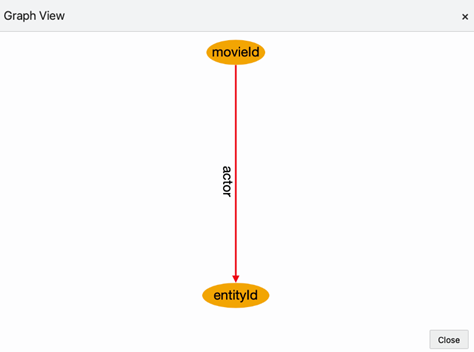
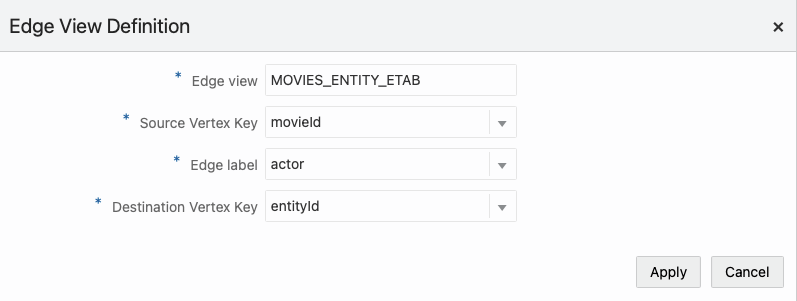
- One or two vertex views can define an edge view. An edge view consists
of:
- Database edge view name
- Source and destination vertex keys
- Label property from RDF classes
The following sections explain the steps to create a database graph view:
14.3.2.12.1 Creating a Graph View
Parent topic: Database Views from RDF Models
14.3.2.12.2 Creating a Vertex View
Parent topic: Database Views from RDF Models
14.3.2.12.3 Creating an Edge View
To create an edge view:
Parent topic: Database Views from RDF Models
