Implementing Automatic Database Diagnostic Monitor Recommendations
This section describes how to implement ADDM recommendations. ADDM findings are displayed in the Automatic Database Diagnostic Monitor (ADDM) page under ADDM Performance Analysis.
To implement ADDM recommendations:
-
Access the Database Home page.
See "Accessing the Database Home Page" for more information.
-
From the Performance menu, select Advisors Home.
If the Database Login page appears, then log in as a user with administrator privileges. The Advisor Central page appears.
-
In the Results section of Advisor Tasks, select the most recent ADDM result, then click View Result.
The Automatic Database Diagnostic Monitor (ADDM) page appears.
-
In the Database Activity section, click the chart icon for the ADDM run to investigate.
The data in the ADDM Performance Analysis section changes based on the ADDM run that you selected.
-
In the ADDM Performance Analysis table, click the ADDM finding that has the greatest impact.
In the following screenshot of the ADDM Performance Analysis table, the finding with the greatest impact is Top SQL Statements.
The Performance Finding Details page appears.
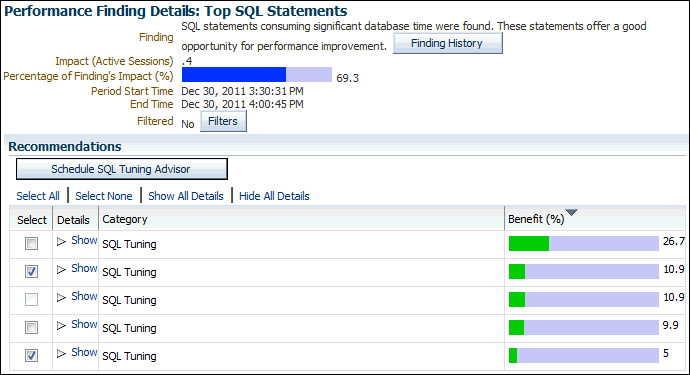
In the following screen shot of the Performance Finding Details page, five recommendations are shown. The first is estimated to have a maximum benefit of up to 26.7% of DB time in the analysis period. The second recommendation is estimated to have a maximum benefit of up to 10.9% of DB time, the third also has a maximum of 10.9%, the fourth has a maximum of 9.9%, and the fifth has a maximum of 5%.
-
Under Recommendations, click Show to review the recommendations and required actions for each recommendation.
The Category column displays the category of the recommendation. The Benefit (%) column displays the estimated benefit of implementing the recommendation.
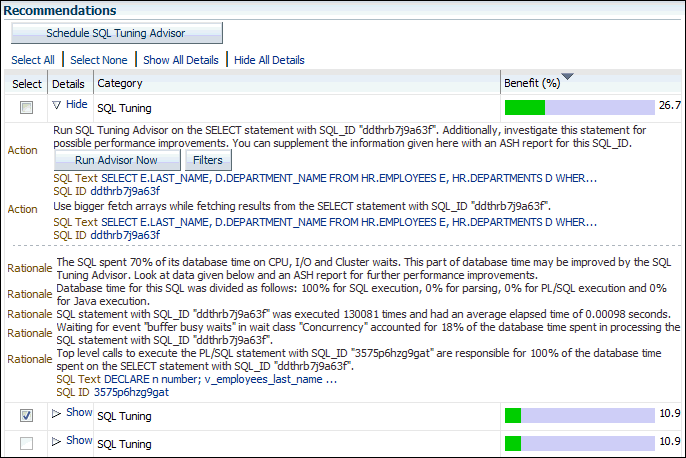
Figure 3-2 shows the recommendations for the first item in the Recommendations table.
Figure 3-2 Recommendations on the Performance Finding Details Page

Description of "Figure 3-2 Recommendations on the Performance Finding Details Page" -
If additional information is available about why the set of actions was recommended, then click Additional Information, or review the content displayed under Additional Information.
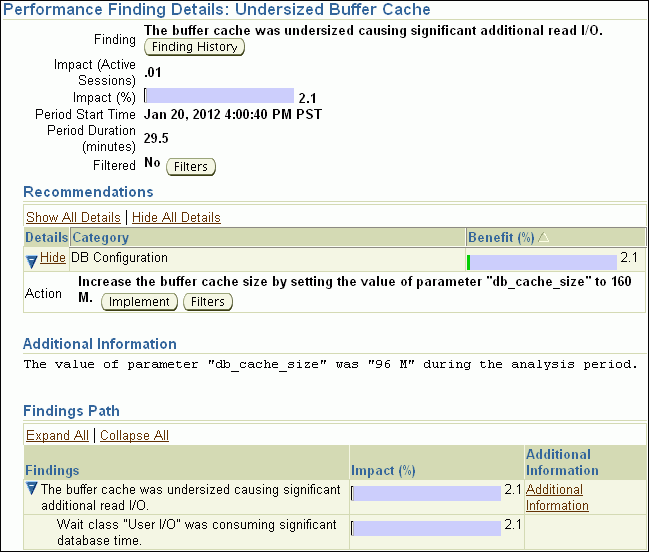
For example, the following screenshot shows an Undersized Buffer Cache finding that contains additional information that indicates the recommended value of the
DB_CACHE_SIZEinitialization parameter. -
To view the history of a finding, click Finding History.
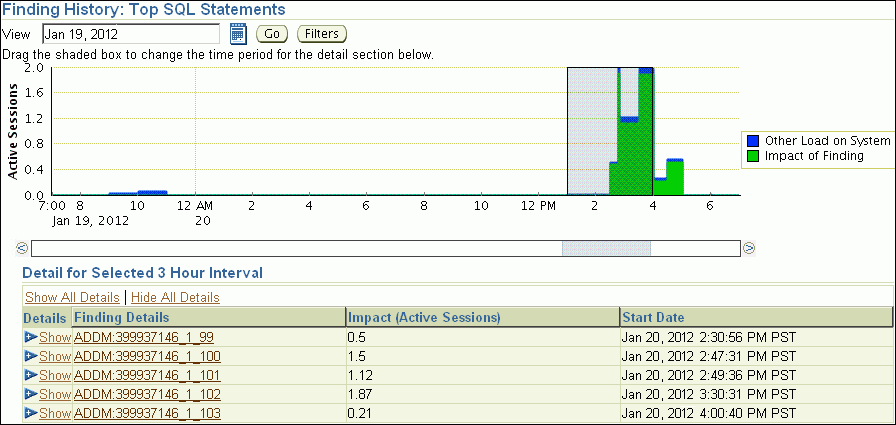
The Finding History page appears. The following screenshot shows the Finding History page for the top SQL statements.
The Finding History page shows how often a particular finding has occurred in a selected 3-hour interval. You can use this information to determine whether the finding was a transient or a persistent problem in the system. Based on this information, you can determine whether the actions associated with the finding should be implemented.
The Active Sessions stacked area chart shows the impact of the finding and of the other loads on the system. You can change the display as follows:
-
To move the 3-hour interval, click and drag the shaded box in the Active Sessions chart.
-
To change dates, enter the desired date in the View field, and then click Go.
-
To view details about a finding, under Detail for Selected 3 Hour Interval, click the link in the Finding Details column to display the Performance Finding Details page for the corresponding ADDM finding.
-
-
Optionally, create a filter to suppress known findings that have been tuned or cannot be tuned further. To create filters for a selected ADDM finding:
-
Click Filters.
The Filters for Finding page appears.
-
Click Create.
The Create Filter for Finding page appears.
-
In the Name field, enter a name for the ADDM filter.
-
In the Active Sessions field, specify the filter criteria in terms of the number of active sessions.
The database filters the ADDM finding for future ADDM runs if the number of active sessions for the finding is less than the specified filter criteria.
-
In the % Active Sessions field, specify the filter criteria in terms of percentage of active sessions.
The database filters the ADDM finding for future ADDM runs if the number of active sessions for the finding is less than the specified filter criteria.
-
Click OK.
-
-
Perform the required action of a chosen recommendation.
Depending on the type of action you choose to perform, various options may be available, such as Implement or Run Advisor Now. These options enable you to implement the recommendation immediately with a single mouse click.
In the example shown in Figure 3-2, the simplest solution is to click Run Advisor Now to immediately run a SQL Tuning Advisor task on the SQL statement.
See Also:


