Manually Running ADDM to Analyze Historical Database Performance
You can run ADDM manually to analyze historical database performance by selecting a pair or range of AWR snapshots as the analysis period. This technique is useful when you have identified a previous time period when database performance was poor.
In the Performance page, you can monitor historical performance by selecting Historical from the View Data list. In the Historical view, you can monitor database performance in the past, up to the duration defined by the AWR retention period. If you notice performance degradation, then you can drill down from the Performance page to identify historical performance problems with the database, as described in Monitoring Real-Time Database Performance . If you identify a problem, then you can run ADDM manually to analyze a particular time period.
To analyze historical database performance by manually running ADDM:
-
Access the Database Home page.
See "Accessing the Database Home Page" for more information.
-
From the Performance menu, select Advisors Home.
If the Database Login page appears, then log in as a user with administrator privileges. The Advisor Central page appears.
-
Under Advisors, select ADDM. The Run ADDM page appears.
-
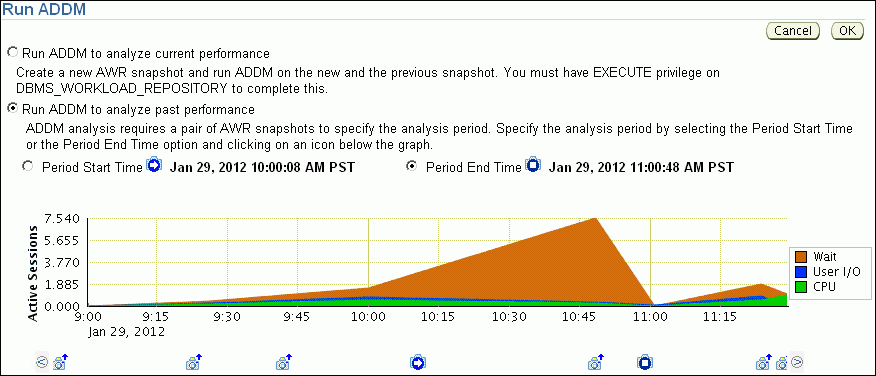
Select Run ADDM to analyze past performance.
-
Specify a time period for analysis by selecting a pair of AWR snapshots. Complete the following steps:
-
Select Period Start Time.
-
Below the chart for the starting snapshot, click the snapshot you want to use for the start time.
A play icon (displayed as an arrow) appears over the snapshot icon.
In this example, database activity peaked from 10 a.m. to 11 a.m., so the snapshot taken at 10 a.m. is selected for the start time.
-
Select Period End Time.
-
Below the chart for the ending snapshot, click the snapshot you want to use for the end time.
A stop icon (displayed as a square) appears over the snapshot icon.
In this example, the ending snapshot is at 11:00 a.m.
-
-
Click OK.
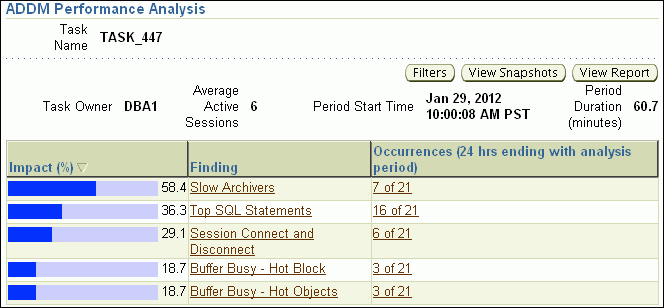
After ADDM completes the analysis, the Automatic Database Diagnostic Monitor (ADDM) page appears with the results of the ADDM run.
Figure 7-1 Analyzing Historical Database Performance

Description of "Figure 7-1 Analyzing Historical Database Performance" -
Click View Report.
The View Report page appears.
-
Optionally, click Save to File.
