Reviewing the Automatic Database Diagnostic Monitor Analysis
By default, ADDM runs every hour to analyze snapshots taken by AWR during that period. If the database finds performance problems, then it displays the results of the analysis under Diagnostics in the Summary section on the Database Home page.
The ADDM Findings link shows how many ADDM findings were found in the most recent ADDM analysis.
To view ADDM findings:
-
Access the Database Home page.
See "Accessing the Database Home Page" for more information.
-
From the Performance menu, select Advisors Home.
If the Database Login page appears, then log in as a user with administrator privileges. The Advisor Central page appears.
-
In the Results section of Advisor Tasks, select the most recent ADDM result, and then click View Result.
The Automatic Database Diagnostic Monitor (ADDM) page appears. The results of the ADDM run are displayed.
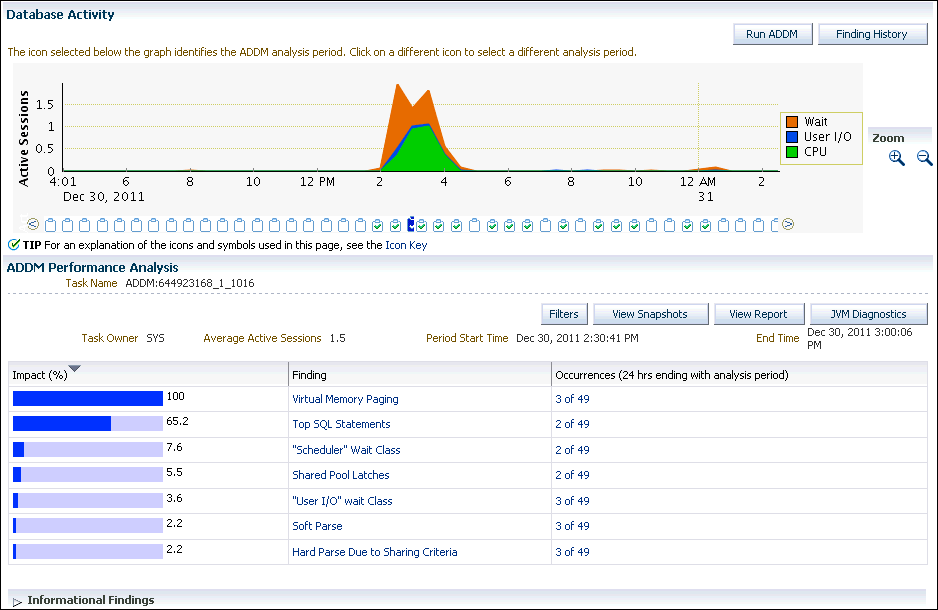
Figure 3-1 The Automatic Database Diagnostic Monitor Page

Description of "Figure 3-1 The Automatic Database Diagnostic Monitor Page"On the Automatic Database Diagnostic Monitor (ADDM) page, the Database Activity chart shows the database activity during the ADDM analysis period. Database activity types are defined in the legend based on their corresponding colors in the chart. Each icon below the chart represents a different ADDM task, which in turn corresponds to a pair of snapshots saved in AWR.
In Figure 3-1, stacked area chart in the Database Activity section shows that the most database activity was between 2:00 p.m. to 4:30 p.m. on December 30. During that time, the activity was dominated by CPU and wait classes, with very little I/O happening.
In the ADDM Performance Analysis section, ADDM findings are listed in descending order, from highest to least impact. The Informational Findings section lists areas that have no performance impact and are for information only.
-
Optionally, click the Zoom icons to shorten or lengthen the analysis period displayed on the chart.
-
To view the ADDM findings in a report, click View Report.
The View Report page appears.
You can click Save to File to save the report for later access.

