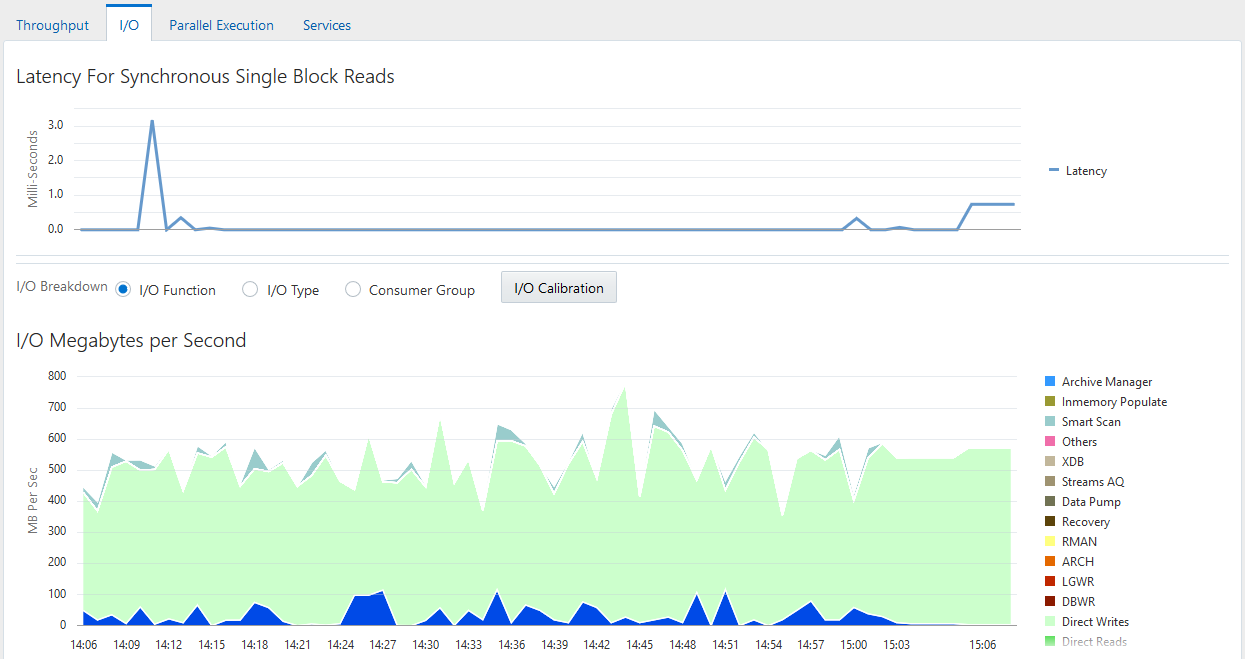
Monitoring I/O by Type
The I/O Type charts enable you to monitor I/O by the types of read and write operations. Small I/Os are requests smaller than 128 KB and are typically single database block I/O operations. Large I/Os are requests greater than or equal to 128 KB. Large I/Os are generated by database operations such as table/index scans, direct data loads, backups, restores, and archiving.
Figure 4-5 Performance Monitoring I/O by Type

Description of "Figure 4-5 Performance Monitoring I/O by Type"
When optimizing for short transaction times, such as in an OLTP environment, monitor latency for small I/Os. High latencies typically indicate that the storage system is a bottleneck.
When optimizing for large queries, such as in a data warehouse, performance depends on the maximum throughput the storage system can achieve rather than the latency of the I/O requests. In this case, monitor the I/O megabytes per second rather than the synchronous single-block I/O latencies.
To monitor I/O by type:
-
Access the Database Home page.
See "Accessing the Database Home Page" for more information.
-
From the Performance menu, select Performance Home.
If the Database Login page appears, then log in as a user with administrator privileges. The Performance page appears.
-
In the instance activity area, click I/O tab.
The I/O Megabytes per Second and I/O Requests per Second graphs appear.
-
For I/O Breakdown, select I/O Type.
The I/O Megabytes per Second by I/O Type and I/O Requests per Second by I/O Type charts appear.
-
Click the largest colored area on the chart or the corresponding function in the legend to drill down to the function with the highest I/O rate.
The I/O Details page appears.
You can view real-time or historical data for details on I/O megabytes or I/O requests.