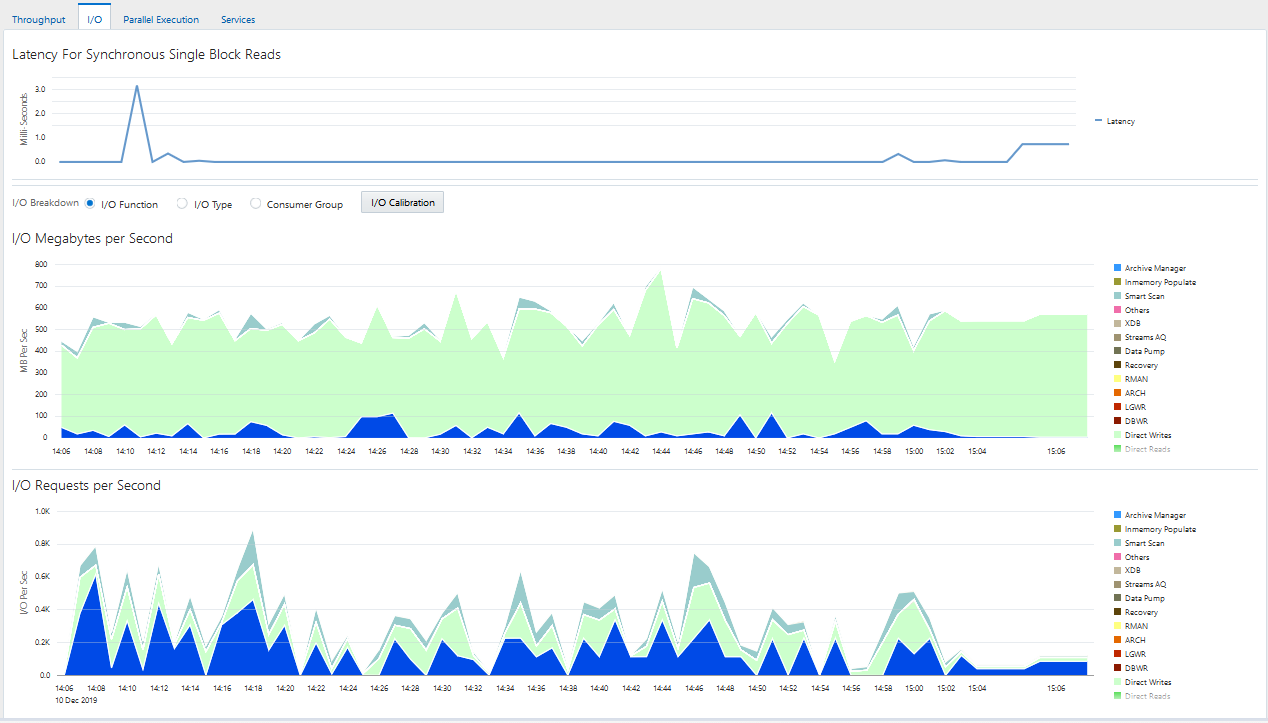
Monitoring I/O
The I/O charts show I/O statistics collected from all database clients. The I/O wait time for a database process represents the amount of time that the process could have been doing useful work if a pending I/O had completed. Oracle Database captures the I/O wait times for all important I/O components in a uniform fashion so that every I/O wait by any Oracle process can be derived from the I/O statistics.
The Latency for Synchronous Single Block Reads chart shows the total perceived I/O latency for a block read, which is the time difference between when an I/O request is submitted and when the first byte of the transfer arrives. Most systems are performing satisfactorily if latency is fewer than 10 milliseconds. This type of I/O request is the best indicator of I/O performance for the following reasons:
-
Write operations may exhibit good performance because of write caches in storage.
-
Because multiblock I/O requests have varying sizes, they can take different amounts of time.
-
The latency of asynchronous I/O requests does not represent the full I/O wait time.
The other charts shown depend on your selection for I/O Breakdown, as described in the following sections:
