Monitoring Throughput
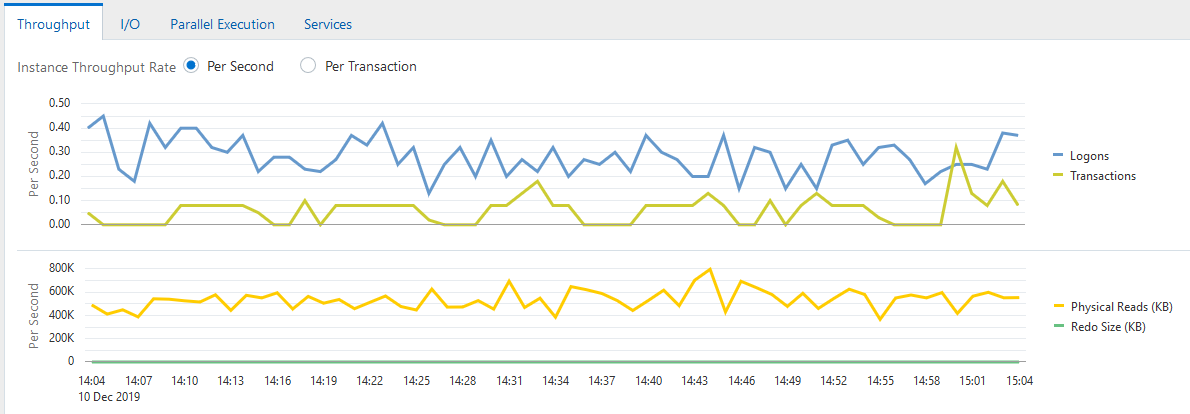
Database throughput measures the amount of work the database performs in a unit of time. The Throughput charts show any contention that appears in the Average Active Sessions chart.
Compare the peaks on the Throughput charts with the peaks on the Average Active Sessions chart. If the Average Active Sessions chart displays a large number of sessions waiting, indicating internal contention, but throughput is high, then the situation may be acceptable. The database is probably also performing efficiently if internal contention is low but throughput is high. However, if internal contention is high but throughput is low, then consider tuning the database.
To monitor throughput:
-
Access the Database Home page.
See "Accessing the Database Home Page" for more information.
-
From the Performance menu, select Performance Home.
If the Database Login page appears, then log in as a user with administrator privileges. The Performance page appears.
-
Click the Throughput tab.
-
Select one of the following Instance Throughput Rate options.
-
Per Second
Two charts appear. One shows the number of logons and transactions per second and the other shows the physical reads and redo size per second.
Figure 4-3 shows the Throughput charts with the Instance Throughput Rate of Per Second selected. The bar in the middle of the figure indicates a portion of the charts (from approximately 1:37 to 1:52) that has been removed for space considerations. In Figure 4-3, the most transactions occurred from 1:15 to 1:27 p.m. and from 2:08 to 2:12 p.m.
-
Per Transaction
One chart appears that shows the number of physical reads and redo size per transaction.
-
