Monitoring Memory Utilization
Operating system performance issues commonly involve process management, memory management, and scheduling. This section describes how to monitor memory utilization and identify problems such as paging and swapping.
To monitor memory utilization:
-
Access the hostname page as explained in "Monitoring Host Activity".
-
From the Host drop-down menu, select Monitoring, and then Memory Details.
The Memory Details page appears.
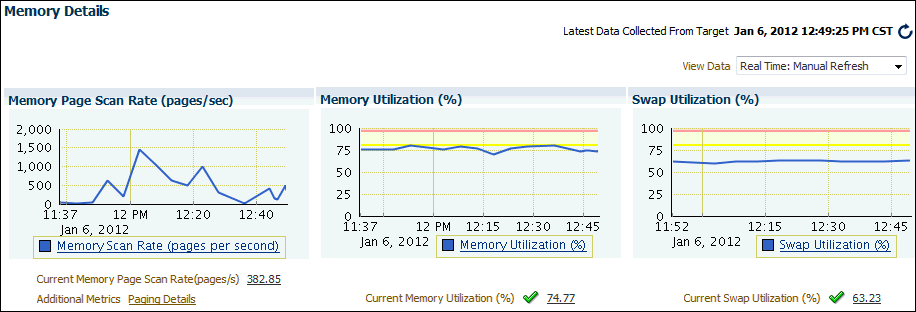
This page contains statistics about memory utilization, page scan rates, and swap utilization gathered over the last hour. The top 10 processes are also listed ordered by memory utilization. Figure 4-8 shows a portion of the Memory Details page. The Top 10 Processes (ordered by Memory) section is not shown.
-
Verify the current memory page scan rate using the Memory Page Scan Rate chart.
The current value of the memory page scan rate is displayed below the chart. On UNIX and Linux, this value represents the number of pages scanned per second. On Microsoft Windows, this value represents the rate at which pages are read from or written to disk to resolve hard page faults. This value is a primary indicator of the types of faults that may be causing system-wide delays.
-
Click Memory Scan Rate (pages per second).
The Memory Page Scan Rate page appears.
This page contains memory page scan rate statistics and related alerts over the last 24 hours.
If you notice an unexpected increase in this value that is sustained through standard workload hours, then a memory performance problem might exist.
-
Return to the Memory Details page. From the Host drop-down menu, select Monitoring, and then Memory Details.
-
Using the Memory Utilization chart, verify the current memory utilization.
The Memory Utilization chart shows how much memory is being used. The current value of memory utilization is displayed below the chart. During standard workload hours, the value should not exceed the warning threshold (shown in yellow).
-
Click Memory Utilization (%).
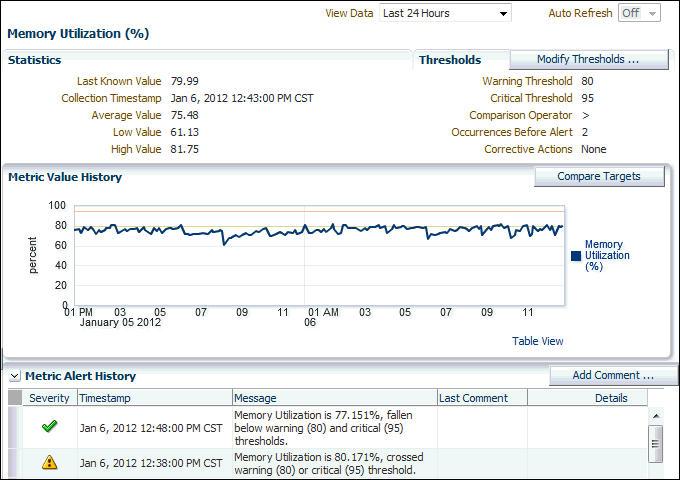
The Memory Utilization page appears.
This page contains memory utilization statistics and related alerts generated over the last 24 hours.
In this example, memory utilization has exceeded 80%, so warnings appear in the Metric Alert History table.
If you notice an unexpected spike in this value that is sustained through normal workload hours, then a memory performance problem might exist.
-
Return to the Memory Details page. From the Host drop-down menu, select Monitoring, and then Memory Details.
-
Using the Swap Utilization chart, verify current swap utilization.
The Swap Utilization chart shows how much swap space is being used. The current value of swap utilization is displayed below the chart. During normal workload hours, the value should not exceed the warning threshold.
-
Click Swap Utilization (%).
The Swap Utilization page appears.
This page contains swap utilization statistics and related alerts generated over the last 24 hours.
If you notice an unexpected spike in this value that is sustained through normal workload hours, then a memory performance problem might exist.
-
Return to the Memory Details page. From the Host drop-down menu, select Monitoring, and then Memory Details.
-
Review the top processes in the Top 10 Processes (ordered by Memory) table.
If a process is taking up too much memory, then this process should be investigated.
-
If a memory performance problem is identified, then you can attempt to resolve the issue by doing the following:
-
Use Automatic Memory Management to automatically manage and distribute memory between the System Global Area (SGA) and the aggregate program global area (PGA aggregate).
-
Use the Memory Advisor to set SGA and PGA memory target values.
-
Use Automatic PGA Management to manage SQL memory execution.
-
Avoid running too many processes that consume large amounts of memory.
-
Reduce paging or swapping.
-
Reduce the number of open cursors and hard parsing with cursor sharing.
-
See Also:
-
Oracle Database Administrator's Guide for information about using Automatic Memory Management
-
Oracle Database Performance Tuning Guide for information about resolving memory issues

