Monitoring Disk I/O Utilization
Because the database resides on a set of disks, the performance of the I/O subsystem is very important to database performance. Important disk statistics include the disk I/Os per second and the length of the service times. These statistics show if the disk is performing optimally or if the storage system is being overworked. This section describes how to monitor disk I/O utilization.
To monitor disk I/O utilization:
-
Access the hostname page as explained in "Monitoring Host Activity".
-
From the Host drop-down menu, select Monitoring, and then Disk Details.
The Disk Details page appears.
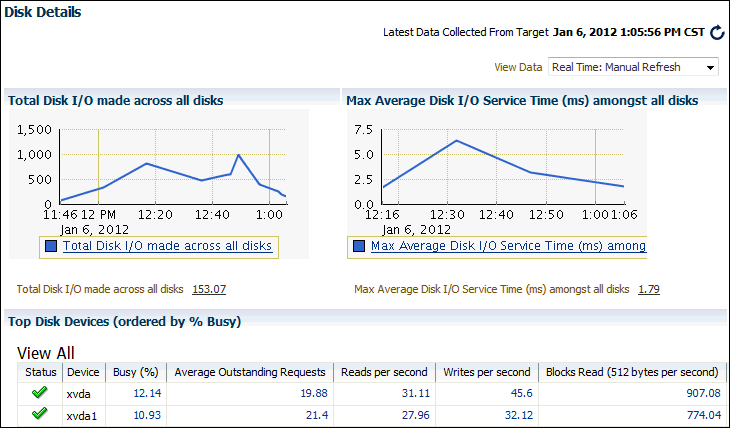
This page contains disk I/O utilization and service time statistics, and the top disk devices ordered by the percentage of time that they were in use.
-
Verify the current disk I/O utilization using the Total Disk I/O Made Across All Disks chart.
The Total Disk I/O Made Across All Disks chart shows how many disk I/Os are being performed per second. The current value for total disk I/O per second is displayed below the chart. In Figure 4-9 the value is 153.07.
-
Click Total Disk I/O made across all disks (per second).
The Total Disk I/O Made Across All Disks (Per Second) page appears.
This page contains disk utilization statistics and related alerts generated over the last 24 hours.
If you notice an unexpected spike in this value that is sustained through standard workload hours, then a disk I/O performance problem might exist and should be investigated.
-
Verify the current I/O service time using the Max Average Disk I/O Service Time (ms) Among All Disks chart.
The Max Average Disk I/O Service Time (ms) Among All Disks chart shows the longest service time for disk I/Os in milliseconds. The current value for longest I/O service time is displayed below the chart. In Figure 4-9 the value is 1.79.
-
Return to the Disk Details page. From the Host drop-down menu, select Monitoring, and then Disk Details.
-
Click Max Average Disk I/O (ms) Service Time Among All Disks.
This page contains I/O service time statistics and related alerts generated over the last 24 hours.
If you notice an unexpected spike in this value that is sustained through normal workload hours, then a disk I/O performance problem might exist and should be investigated.
-
Return to the Disk Details page. From the Host drop-down menu, select Monitoring, and then Disk Details.
-
On the Disk Details page, verify the disk devices in the Top Disk Devices (ordered by % Busy) table.
If a particular disk is busy a high percentage of the time, then this disk should be investigated.
-
If a disk I/O performance problem is identified, you can attempt to resolve the problem by doing the following:
-
Use Oracle Automatic Storage Management (Oracle ASM) to manage database storage.
-
Stripe everything across every disk to distribute I/O.
-
Move files such as archived redo logs and online redo logs to separate disks.
-
Store required data in memory to reduce the number of physical I/Os.
-
See Also:
-
Oracle Database Performance Tuning Guide for information about resolving disk I/O issues
