26 Analyzing SQL with SQL Tuning Advisor
Use SQL Tuning Advisor to obtain recommendations for improving performance of high-load SQL statements, and prevent regressions by only executing optimal plans.
About SQL Tuning Advisor
SQL Tuning Advisor is SQL diagnostic software in the Oracle Database Tuning Pack.
You can submit one or more SQL statements as input to the advisor and receive advice or recommendations for how to tune the statements, along with a rationale and expected benefit.
Purpose of SQL Tuning Advisor
SQL Tuning Advisor is a mechanism for resolving problems related to suboptimally performing SQL statements.
Use SQL Tuning Advisor to obtain recommendations for improving performance of high-load SQL statements, and prevent regressions by only executing optimal plans.
Tuning recommendations include:
-
Collection of object statistics
-
Creation of indexes
-
Rewriting SQL statements
-
Creation of SQL profiles
-
Creation of SQL plan baselines
The recommendations generated by SQL Tuning Advisor help you achieve the following specific goals:
-
Avoid labor-intensive manual tuning
Identifying and tuning high-load SQL statements is challenging even for an expert. SQL Tuning Advisor uses the optimizer to tune SQL for you.
-
Generate recommendations and implement SQL profiles automatically
You can configure an Automatic SQL Tuning task to run nightly in maintenance windows. When invoked in this way, the advisor can generate recommendations and also implement SQL profiles automatically.
-
Analyze database-generated statistics to achieve optimal plans
The database contains a vast amount of statistics about its own operations. SQL Tuning Advisor can perform deep mining and analysis of internal information to improve execution plans.
-
Enable developers to tune SQL on a test system instead of the production system
When suboptimally performing SQL statements occur on a production database, developers may not want to investigate and tune directly on the production database. The DBA can transport the problematic SQL statements to a test database where the developers can safely analyze and tune them.
When tuning multiple statements, SQL Tuning Advisor does not recognize interdependencies between the statements. Instead, SQL Tuning Advisor offers a convenient way to get tuning recommendations for many statements.
Note:
A common user whose current container is the CDB root can run SQL Tuning Advisor manually for SQL statements from any PDB. When a statement is tuned, it is tuned in any container that runs the statement.
A user whose current container is a PDB can run SQL Tuning Advisor manually for SQL statements that have been run in this PDB. In this case, a statement is tuned only for the current PDB. The results related to a PDB are stored in the PDB and are included if the PDB is unplugged. When SQL Tuning Advisor is run manually by a user whose current container is a PDB, the results are only visible to a user whose current container is that PDB.
See Also:
"Managing SQL Plan Baselines" to learn about SQL plan management
SQL Tuning Advisor Architecture
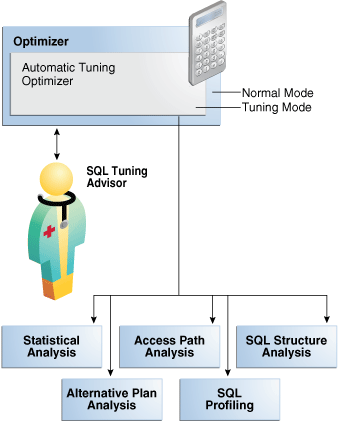
Automatic Tuning Optimizer is the central tool used by SQL Tuning Advisor. The advisor can receive SQL statements as input from multiple sources, analyze these statements using the optimizer, and then make recommendations.
Invoking Automatic Tuning Optimizer for every hard parse consumes significant time and resources. Tuning mode is meant for complex and high-load SQL statements that significantly affect database performance.
Manageability advisors such as SQL tuning advisor use a common infrastructure called the advisor framework. This framework provides a common schema and interface for storing task objects. An advisor schema is a set of tables to store the data from advisors. SQL Tuning Advisor receives tuning input, and then writes to the advisor schemas by means of the advisor framework. SQL Tuning Advisor reads data from advisor schema when it produces its reports.
The following figure shows the basic architecture of SQL Tuning Advisor.
Figure 26-1 SQL Tuning Advisor Architecture
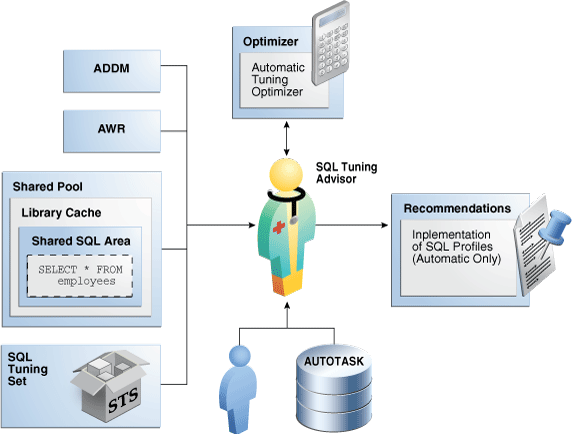
Description of "Figure 26-1 SQL Tuning Advisor Architecture"
See Also:
Input to SQL Tuning Advisor
Input for SQL Tuning Advisor can come from several sources, including ADDM, AWR, the shared SQL area, and SQL tuning sets.
SQL Tuning Advisor uses its input sources as follows:
-
Automatic Database Diagnostic Monitor (ADDM)
The primary input source for SQL Tuning Advisor is ADDM (pronounced Adam). By default, ADDM runs proactively once every hour. To identify performance problems involving high-load SQL statements, ADDM analyzes key statistics gathered by Automatic Workload Repository (AWR) over the last hour . If a high-load SQL statement is identified, then ADDM recommends running SQL Tuning Advisor on the SQL.
-
AWR
AWR takes regular snapshots of system activity, including high-load SQL statements ranked by relevant statistics, such as CPU consumption and wait time.
You can view the AWR and manually identify high-load SQL statements. You can run SQL Tuning Advisor on these statements, although Oracle Database automatically performs this work as part of automatic SQL tuning. By default, AWR retains data for the last eight days. You can locate and tune any high-load SQL that ran within the retention period of AWR using this technique.
-
Shared SQL area
The database uses the shared SQL area to tune recent SQL statements that have yet to be captured in AWR. The shared SQL area and AWR provide the capability to identify and tune high-load SQL statements from the current time going as far back as the AWR retention allows, which by default is at least 8 days.
-
SQL tuning set
A SQL tuning set (STS) is a database object that stores SQL statements along with their execution context. An STS can include SQL statements that are yet to be deployed, with the goal of measuring their individual performance, or identifying the ones whose performance falls short of expectation. When a set of SQL statements serve as input, the database must first construct and use an STS.
See Also:
-
Oracle AI Database Performance Tuning Guide to learn about ADDM
-
Oracle AI Database Performance Tuning Guide to learn about AWR
-
Oracle AI Database Concepts to learn about the shared SQL area
Output of SQL Tuning Advisor
After analyzing the SQL statements, SQL Tuning Advisor publishes recommendations.
Specifically, SQL Tuning Advisor produces the following types of output:
-
Advice on optimizing the execution plan
-
Rationale for the proposed optimization
-
Estimated performance benefit
-
SQL statement to implement the advice
The benefit percentage shown for each recommendation is calculated using the following formula:
abnf% = (time_old - time_new)/(time_old)
For example, assume that before tuning the execution time was 100 seconds, and after implementing the recommendation the new execution time is expected to be 33 seconds. This benefit calculation for this performance improvement is as follows:
67% = (100 - 33)/(100)
You choose whether to accept the recommendations to optimize the SQL statements. Depending on how it is configured, Automatic SQL Tuning Advisor can implement the SQL profile recommendations to tune the statement without user intervention. When invoked on demand, SQL Tuning Advisor can recommend that the user implement a SQL profile, but can never implement it automatically.
Automatic Tuning Optimizer Analyses
In tuning mode, the optimizer has more time to consider options and gather statistics. For example, Automatic Tuning Optimizer can use dynamic statistics and partial statement execution.
The following graphic depicts the different types of analysis that Automatic Tuning Optimizer performs.
See Also:
Statistical Analysis
The optimizer relies on statistics to generate execution plans.
If these statistics are stale or missing, then the optimizer can generate suboptimal plans. Automatic Tuning Optimizer checks for missing or stale statistics, and recommends gathering fresh statistics if needed.
-
Object statistics
The optimizer checks the statistics for each object referenced in the query.
-
System statistics
On Oracle Exadata Database Machine, the cost of smart scans depends on the system statistics I/O seek time, multiblock read count, and I/O transfer speed. The values of these system statistics are usually different on Oracle Exadata Database Machine, so an analysis to determines whether these system statistics are not up to date. If gathering these statistics would improve the plan, then SQL Tuning Advisor recommends accepting a SQL profile.
The following graphic depicts the analysis of object-level statistics.
Figure 26-3 Statistical Analysis by Automatic Tuning Optimizer
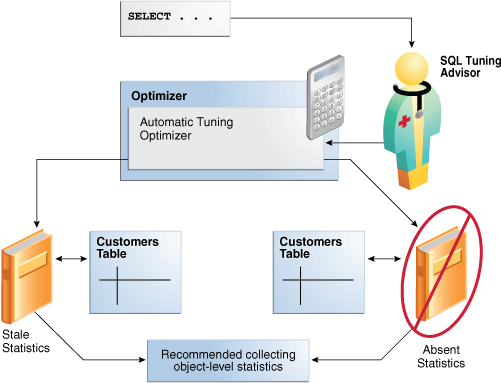
Description of "Figure 26-3 Statistical Analysis by Automatic Tuning Optimizer"
SQL Profiling
SQL profiling is the verification by the Automatic Tuning Optimizer of its own estimates.
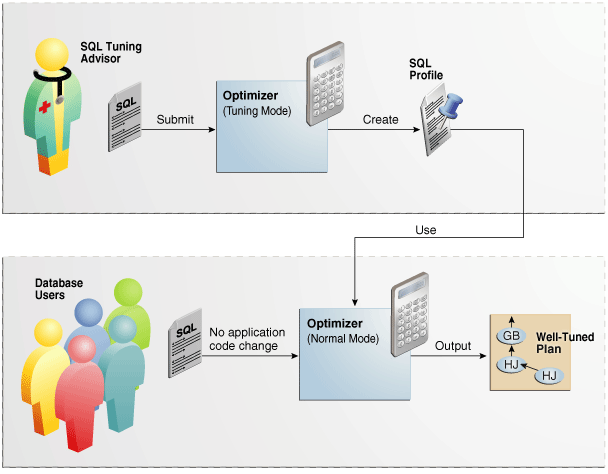
By reviewing execution history and testing the SQL, the optimizer can ensure that it has the most accurate information available to generate execution plans. SQL profiling is related to but distinct from the steps of generating SQL Tuning Advisor recommendations and implementing these recommendations.
The following graphic shows SQL Tuning Advisor recommending a SQL profile and automatically implementing it. After creating the profile, the optimizer can use it as additional input when generating execution plans.
See Also:
How SQL Profiling Works
The database can profile some DML and DDL statements.
Specifically, SQL Tuning Advisor can profile the following types of statement:
-
DML statements (
SELECT,INSERTwith aSELECTclause,UPDATE,DELETE, and the update or insert operations ofMERGE) -
CREATE TABLEstatements (only with theAS SELECTclause)
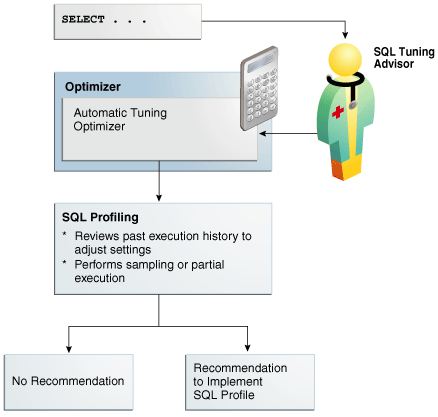
After performing its analysis, SQL Tuning Advisor either recommends or does not recommend implementing a SQL profile.
The following graphic shows the SQL profiling process.
During SQL profiling, the optimizer verifies cost, selectivity, and cardinality for a statement. The optimizer uses either of the following methods:
-
Samples the data and applies appropriate predicates to the sample
The optimizer compares the new estimate to the regular estimate and, if the difference is great enough, applies a correction factor.
-
Executes a fragment of the SQL statement
This method is more efficient than the sampling method when the predicates provide efficient access paths.
The optimizer uses the past statement execution history to determine correct settings. For example, if the history indicates that a SQL statement is usually executed only partially, then the optimizer uses FIRST_ROWS instead of ALL_ROWS optimization.
See Also:
SQL Profile Implementation
If the optimizer generates auxiliary information during statistical analysis or SQL profiling, then the optimizer recommends implementing a SQL profile.
As shown in Figure 26-6, the following options are possible:
-
When SQL Tuning Advisor is run on demand, the user must choose whether to implement the SQL profile.
-
When the Automatic SQL Tuning task is configured to implement SQL profiles automatically, advisor behavior depends on the setting of the
ACCEPT_SQL_PROFILEtuning task parameter:-
If set to
true, then the advisor implements SQL profiles automatically. -
If set to
false, then user intervention is required. -
If set to
AUTO(default), then the setting istruewhen at least one SQL statement exists with a SQL profile, andfalsewhen this condition is not satisfied.
Note:
The Automatic SQL Tuning task cannot automatically create SQL plan baselines or add plans to them.
-
At any time during or after automatic SQL tuning, you can view a report. This report describes in detail the SQL statements that were analyzed, the recommendations generated, and any SQL profiles that were automatically implemented.
See Also:
-
"Configuring the Automatic SQL Tuning Task Using the Command Line"
-
Oracle AI Database PL/SQL Packages and Types Reference to learn more about
ACCEPT_SQL_PROFILE
Access Path Analysis
An access path is the means by which the database retrieves data.
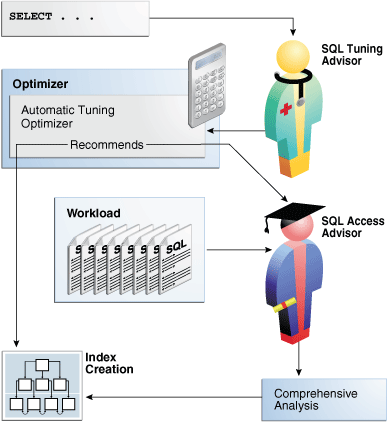
For example, a query using an index and a query using a full table scan use different access paths. In some cases, indexes can greatly enhance the performance of a SQL statement by eliminating full table scans. The following graphic illustrates access path analysis.
Automatic Tuning Optimizer explores whether a new index can significantly enhance query performance and recommends either of the following:
-
Creating an index
Index recommendations are specific to the SQL statement processed by SQL Tuning Advisor. Sometimes a new index provides a quick solution to the performance problem associated with a single SQL statement.
-
Running SQL Access Advisor
Because the Automatic Tuning Optimizer does not analyze how its index recommendation can affect the entire SQL workload, it also recommends running SQL Access Advisor on the SQL statement along with a representative SQL workload. SQL Access Advisor examines the effect of creating an index on the SQL workload before making recommendations.
SQL Structural Analysis
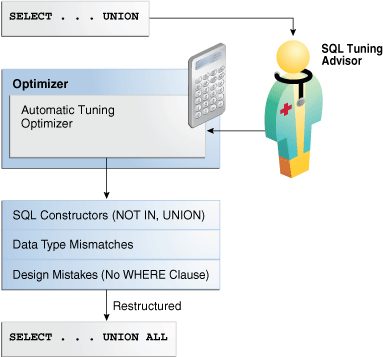
During structural analysis, Automatic Tuning Optimizer tries to identify syntactic, semantic, or design problems that can lead to suboptimal performance. The goal is to identify poorly written SQL statements and to advise you how to restructure them.
The following graphic illustrates structural analysis.
Some syntax variations negatively affect performance. In structural analysis, the automatic tuning optimizer evaluates statements against a set of rules, identifies inefficient coding techniques, and recommends an alternative statement if possible.
As shown in Figure 26-8, Automatic Tuning Optimizer identifies the following categories of structural problems:
-
Inefficient use of SQL constructors
A suboptimally performing statement may be using
NOT INinstead ofNOT EXISTS, orUNIONinstead ofUNION ALL. TheUNIONoperator, as opposed to theUNION ALLoperator, uses a unique sort to ensure that no duplicate rows are in the result set. If you know that two queries do not return duplicates, then useUNION ALL. -
Data type mismatches
If the indexed column and the compared value have a data type mismatch, then the database does not use the index because of the implicit data type conversion. Also, the database must expend additional resources converting data types, and some SQL statements may fail because data values do not convert correctly. Common mistakes include columns that contain numeric data but are never used for arithmetic operations: telephone numbers, credit card numbers, and check numbers. To avoid poor cardinality estimates, suboptimal plans, and
ORA-01722errors, developers must ensure that bind variables are typeVARCHAR2and not numbers. -
Design mistakes
A classic example of a design mistake is a missing join condition. If n is the number of tables in a query block, then n-1 join conditions must exist to avoid a Cartesian product.
In each case, Automatic Tuning Optimizer makes relevant suggestions to restructure the statements. The suggested alternative statement is similar, but not equivalent, to the original statement. For example, the suggested statement may use UNION ALL instead of UNION. You can then determine if the advice is sound.
Alternative Plan Analysis
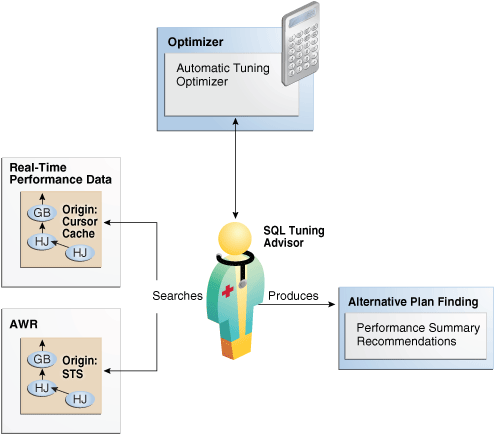
While tuning a SQL statement, SQL Tuning Advisor searches real-time and historical performance data for alternative execution plans for the statement.
If plans other than the original plan exist, then SQL Tuning Advisor reports an alternative plan finding. The follow graphic shows SQL Tuning Advisor finding two alternative plans and generating an alternative plan finding.
SQL Tuning Advisor validates the alternative execution plans and notes any plans that are not reproducible. When reproducible alternative plans are found, you can create a SQL plan baseline to instruct the optimizer to choose these plans in the future.
Example 26-1 Alternative Plan Finding
The following example shows an alternative plan finding for a SELECT statement:
2- Alternative Plan Finding
---------------------------
  Some alternative execution plans for this statement were found by searching
  the system's real-time and historical performance data.

  The following table lists these plans ranked by their average elapsed time.
  See section "ALTERNATIVE PLANS SECTION" for detailed information on each
  plan.

  id plan hash  last seen            elapsed (s)  origin          note
  -- ---------- -------------------- ------------ --------------- ----------------
   1 1378942017  2009-02-05/23:12:08        0.000 Cursor Cache    original plan
   2 2842999589  2009-02-05/23:12:08        0.002 STS

  Information
  -----------
  - The Original Plan appears to have the best performance, based on the
    elapsed time per execution.  However, if you know that one alternative
    plan is better than the Original Plan, you can create a SQL plan baseline
    for it. This will instruct the Oracle optimizer to pick it over any other
    choices in the future.
    execute dbms_sqltune.create_sql_plan_baseline(task_name => 'TASK_XXXXX',
            object_id => 2, task_owner => 'SYS', plan_hash => xxxxxxxx);
The preceding example shows that SQL Tuning Advisor found two plans, one in the shared SQL area and one in a SQL tuning set. The plan in the shared SQL area is the same as the original plan.
SQL Tuning Advisor only recommends an alternative plan if the elapsed time of the original plan is worse than alternative plans. In this case, SQL Tuning Advisor recommends that users create a SQL plan baseline on the plan with the best performance. In Example 26-1, the alternative plan did not perform as well as the original plan, so SQL Tuning Advisor did not recommend using the alternative plan.
Example 26-2 Alternative Plans Section
In this example, the alternative plans section of the SQL Tuning Advisor output includes both the original and alternative plans and summarizes their performance. The most important statistic is elapsed time. The original plan used an index, whereas the alternative plan used a full table scan, increasing elapsed time by .002 seconds.
Plan 1
------

  Plan Origin                 :Cursor Cache
  Plan Hash Value             :1378942017
  Executions                  :50
  Elapsed Time                :0.000 sec
  CPU Time                    :0.000 sec
  Buffer Gets                 :0
  Disk Reads                  :0
  Disk Writes                 :0

Notes:
  1. Statistics shown are averaged over multiple executions.
  2. The plan matches the original plan.

--------------------------------------------
| Id  | Operation            | Name        |
--------------------------------------------
|   0 | SELECT STATEMENT     |             |
|   1 |  SORT AGGREGATE      |             |
|   2 |   MERGE JOIN         |             |
|   3 |    INDEX FULL SCAN   | TEST1_INDEX |
|   4 |    SORT JOIN         |             |
|   5 |     TABLE ACCESS FULL| TEST        |
--------------------------------------------

Plan 2
------

  Plan Origin                 :STS
  Plan Hash Value             :2842999589
  Executions                  :10
  Elapsed Time                :0.002 sec
  CPU Time                    :0.002 sec
  Buffer Gets                 :3
  Disk Reads                  :0
  Disk Writes                 :0

Notes:
  1. Statistics shown are averaged over multiple executions.

-------------------------------------
| Id  | Operation           | Name  |
-------------------------------------
|   0 | SELECT STATEMENT    |       |
|   1 |  SORT AGGREGATE     |       |
|   2 |   HASH JOIN         |       |
|   3 |    TABLE ACCESS FULL| TEST  |
|   4 |    TABLE ACCESS FULL| TEST1 |
-------------------------------------
To adopt an alternative plan regardless of whether SQL Tuning Advisor recommends it, call DBMS_SQLTUNE.CREATE_SQL_PLAN_BASELINE. You can use this procedure to create a SQL plan baseline on any existing reproducible plan.
SQL Tuning Advisor Operation
You can run SQL Tuning Advisor automatically or on demand. You can also run the advisor on a local or remote database.
Automatic and On-Demand SQL Tuning
Configure SQL Tuning Advisor to run automatically using DBMS_AUTO_SQLTUNE, or on demand using DBMS_SQLTUNE.
The methods of invocation differ as follows:
-
Automatically
You can configure SQL Tuning Advisor to run during nightly system maintenance windows. When run by
AUTOTASK, the advisor is known as Automatic SQL Tuning Advisor and performs automatic SQL tuning. -
On-Demand
In on-demand SQL tuning, you manually invoke SQL Tuning Advisor to diagnose and fix SQL-related performance problems after they have been discovered. Oracle Enterprise Manager Cloud Control (Cloud Control) is the preferred interface for tuning SQL on demand, but you can also use the
DBMS_SQLTUNEPL/SQL package.
SQL Tuning Advisor uses Automatic Tuning Optimizer to perform its analysis. This optimization is "automatic" because the optimizer analyzes the SQL instead of the user. Do not confuse Automatic Tuning Optimizer with automatic SQL tuning, which in this document refers only to the work performed by the Automatic SQL Tuning task.
See Also:
-
Oracle AI Database PL/SQL Packages and Types Reference to learn about
DBMS_SQLTUNE
Local and Remote SQL Tuning
SQL Tuning Advisor can either analyze a workload on a local database or a remote database.
In the simplest case, SQL Tuning Advisor accepts input, executes, and stores results within a single database. Local mode is appropriate for databases in which the performance overhead of SQL Tuning Advisor execution is acceptable.
In remote tuning, the database on which you initiate a tuning task differs from the database in which the tuning process executes or in which results are stored. For example, a standby database can have its own workload of queries, some of which may require tuning. You can issue SQL Tuning Advisor statements on a standby database. A standby-to-primary database link enables DBMS_SQLTUNE to write data to and read data from the primary database. The link is necessary because the standby database, which is read-only, cannot write the SQL tuning data.
The following figure illustrates the general setup for tuning a standby database workload on a primary database. This technique requires a standby-to-primary database link.
Figure 26-10 Tuning a Standby Workload on a Primary Database
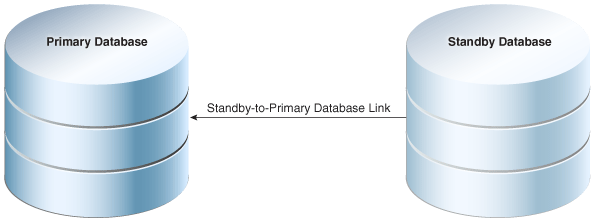
Description of "Figure 26-10 Tuning a Standby Workload on a Primary Database"
To tune a standby workload on a primary database, specify the database_link_to parameter in DBMS_SQLTUNE procedures. By default, the database_link_to parameter is null, which means that tuning is local.
The
database_link_to parameter must specify a private database link. This
link must be owned by SYS and accessed by the default privileged user
SYS$UMF. The following sample statement creates a link named
lnk_to_pri:
CREATE DATABASE LINK lnk_to_pri CONNECT TO SYS$UMF IDENTIFIED BY password USING 'inst1';The following table illustrates a typical remote tuning session. You issue all statements on the standby database. DBMS_SQLTUNE uses the database link both to fetch data from the primary database, and store data in the primary database.
Table 26-1 Tuning a Standby Database Workload Using a Database Link to the Primary Database
| Step | Statement Issued on Standby Database | Result |
|---|---|---|
| 1 | CREATE_TUNING_TASK |
DBMS_SQLTUNE creates the task data in the primary database using the standby-to-primary database link.
|
| 2 | EXECUTE_TUNING_TASK |
DBMS_SQLTUNE uses the database link to read the SQL Tuning Advisor task data stored in the primary database. The tuning analysis occurs on the standby database, but DBMS_SQLTUNE writes the results remotely to the primary database.
|
| 3 | REPORT_TUNING_TASK |
DBMS_SQLTUNE uses the database link to read the SQL Tuning Advisor report data from the primary database, and then constructs the report locally on the standby database.
|
| 4 | ACCEPT_SQL_PROFILE |
DBMS_SQLTUNE uses the database link to write the SQL profile data remotely to the primary database.
|
See Also:
-
Oracle Data Guard Concepts and Administration to learn how to perform remote tuning in a Data Guard environment
-
Oracle AI Database PL/SQL Packages and Types Reference to learn more about
DBMS_SQLTUNE.CREATE_TUNING_TASK
Using DBMS_SQLTUNE to Tune the Primary Database Remotely
If you want to tune a SQL statement written on the primary
database on the standby database, then on the standby, specify the
database_link_to parameter in
DBMS_SQLTUNE procedures. By default, the
database_link_to parameter is null, which
means that tuning is local.
The
database_link_to parameter must specify a private database link. This
link must be owned by SYS and accessed by the default privileged user
SYS$UMF. The following sample statement creates a link named
lnk_to_pri:
CREATE DATABASE LINK lnk_to_pri CONNECT TO SYS$UMF IDENTIFIED BY password USING 'inst1';The following table illustrates a typical remote tuning
session. You issue the SQL tuning statement on the standby database.
DBMS_SQLTUNE uses the database link both to
fetch data from the primary database, and store data in the primary
database.
Table 26-2 Using DBMS_SQLTUNE on a Standby Database to Remotely Tune the Primary Database
| Step | Statement Issued on Standby Database | Result |
|---|---|---|
| 1 | CREATE_TUNING_TASK |
DBMS_SQLTUNE creates the task
data in the primary database using the
standby-to-primary database link.
|
| 2 | EXECUTE_TUNING_TASK |
DBMS_SQLTUNE uses the database
link to read the SQL Tuning Advisor task data
stored in the primary database. The tuning
analysis occurs on the standby database, but
DBMS_SQLTUNE writes the results
remotely to the primary database.
|
| 3 | REPORT_TUNING_TASK |
DBMS_SQLTUNE uses the database
link to read the SQL Tuning Advisor report data
from the primary database, and then constructs the
report locally on the standby database.
|
| 4 | ACCEPT_SQL_PROFILE |
DBMS_SQLTUNE uses the database
link to write the SQL profile data remotely to the
primary database.
|
Using Enterprise Manager Cloud Control to Tune an Active Standby Query Workload
Prerequisites
- Enterprise Manager must be discovered and must be connected to an Active Data Guard Standby Database.
- The SQL tuning statement used must be created on the primary database.
- A non-public database link that points to the
primary database must be created on the primary database for
user
SYS$UMF. In each case, in order to execute tuning tasks from an Active Data Guard Standby Database in a PDB, a separate database link must be created for that PDB. For example:CREATE DATABASE LINK lnk_to_pri CONNECT TO SYS$UMF IDENTIFIED BY <password> USING \ '(DESCRIPTION=(ADDRESS=(PROTOCOL=TCP)(HOST=<fully_qualified_hostname>)(PORT=<port_number>)) \ (CONNECT_DATA=(SERVICE_NAME=<fully_qualified_service_name>)))';You select this database link in SQL Tuning Advisor on the standby.
- The
SYS$UMFaccount must be unlocked with password set to the same password as the database link.
Note:
In all cases in this section, the "standby" refers to an Active Data Guard Standby Database.Steps
- Log in to the standby database as a user with privileges to
execute
DBMS_SQLTUNEprocedures, such as theSYSuser. - There are several different ways to select the query you
want to tune. From the Performance menu, one
way is to click Performance Hub, and then
Ash Analytics. Find and select the
query, then click Tune SQL to bring the query
into SQL Tuning Advisor.
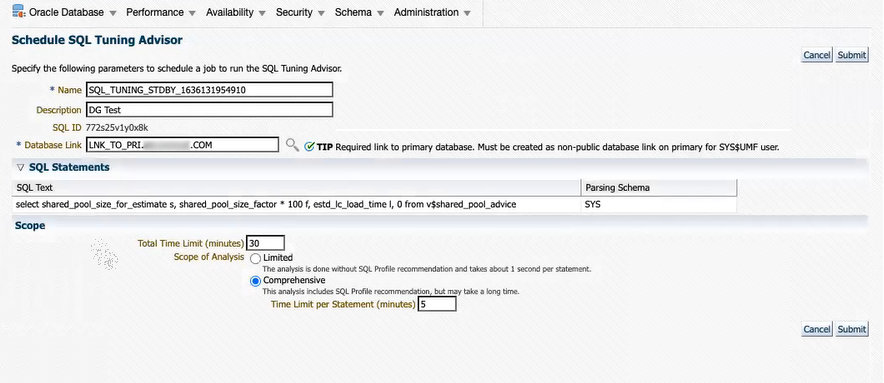
Description of the illustration sql_advisor_from_standbyem.pngNote:
The Database Link field shown above appears only in SQL Tuning Advisor on the standby. It is not visible from a primary database. - You can either accept the default tuning task name or
change it. The default name includes an "
_STDBY_" segment so that you can distinguish tasks created on the standby from those created on the primary. If you change it, be sure to give it a name which indicates that the task was created from the standby. - In the Database Link field, select the database link
to the primary database. This must be a
SYS$UMFlink. - Click Submit.
- When the task is done, the SQL Tuning Result Summary page displays. After reviewing the results, click SQL Profile. (See Viewing the Result of a SQL Tuning Task at the end of this topic, which shows an example of a result summary.)
- On the SQL Result Details page, click View Recommendations.
- On the Recommendation for SQL <ID name> page, click Implement.
- On the Confirmation page, click Yes. ( You may choose to implement the new profile with forced matching if you want this to impact the same SQL, but with different values ).
Note:
You can access previously-created SQL tuning tasks by navigating to Advisors Home. From there, you can view all tasks that were created on both the primary database and on the standby. You can select and implement SQL Profile recommendations for tuning tasks that were created from the standby.SQL Tuning Advisor Limitations From the Active Data Guard Standby Database
- You can only implement SQL Profile recommendations for tasks that were created on the standby. (This is why it is important that the name of a task includes some indicator that it was created on the standby.)
- You cannot implement recommendations for the
SYS_AUTO_SQL_TUNING_TASKor any other task that was created from the primary database. - You cannot collect optimizer statistics.
- You cannot implement index recommendations.
- A tuning task can tune only a single SQL statement (not a SQL tuning set).
The image below shows the Advisor Tasks section of Advisors Home. By default, user-created tasks include "_STDBY_" in the task name, as shown in this list. The tasks that do not include that segment in the name are presumed to tasks that were created from the primary database. SQL Profile recommendations for these tasks cannot be implemented from the standby database. The SYS_AUTO_SQL_TUNING_TASK also cannot be implemented from the standby database.
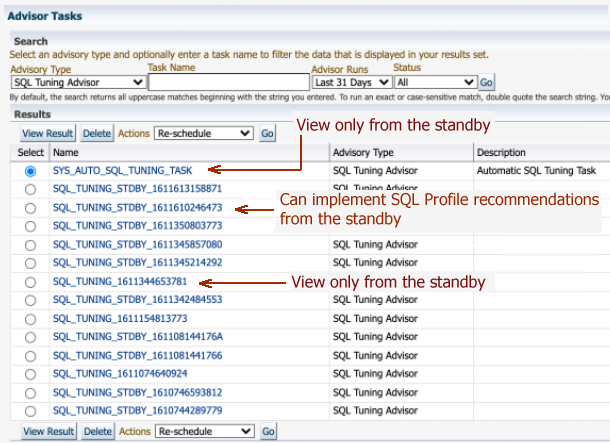
Description of the illustration sql_advisor_home2.png
Viewing the Result of a SQL Tuning Task
The SQL Tuning Task Result Summary displays after a SQL Tuning Task completes and also when you select a tuning task from the Advisor Central page.
On an Active Data Guard Standby database you can view the result summary of a completed SQL tuning task that was executed on the same standby. You can click SQL Profiles view and implement recommended SQL profiles. The Index and Statistics links are view only.
Managing the Automatic SQL Tuning Task
When your goal is to identify SQL performance problems proactively, configuring SQL Tuning Advisor as an automated task is a simple solution. The task processes selected high-load SQL statements from AWR that qualify as tuning candidates.
See Also:
Oracle AI Database Administrator’s Guide to learn more about automated maintenance tasks
About the Automatic SQL Tuning Task
By default, the Automatic SQL Tuning task runs for in a nightly maintenance window.
See Also:
Oracle AI Database Administrator’s Guide to learn more about automatic maintenance tasks
Purpose of Automatic SQL Tuning
Configuring automatic SQL tuning instead of tuning manually decreases cost and increases manageability
Many DBAs do not have the time needed for the intensive analysis required for SQL tuning. Even when they do, SQL tuning involves several manual steps. Because several different SQL statements may be high load on any given day, DBAs may have to expend considerable effort to monitor and tune them. .
The automated SQL tuning task does not process the following types of SQL:
-
Ad hoc SQL statements or SQL statements that do not repeat within a week
-
Parallel queries
-
Queries that take too long to run after being SQL profiled, so that it is not practical for SQL Tuning Advisor to test execution
-
Recursive SQL
You can run SQL Tuning Advisor on demand to tune the preceding types of SQL statements.
Automatic SQL Tuning Concepts
Oracle Scheduler uses the automated maintenance tasks infrastructure (known as AutoTask) to schedules tasks to run automatically.
By default, the Automatic SQL Tuning task runs for at most one hour in a nightly maintenance window. You can customize attributes of the maintenance windows, including start and end time, frequency, and days of the week.
Automatic SQL Tuning Advisor data is stored in the CDB root and is only visible to a common user whose current container is the root. It might have results about SQL statements executed in a PDB that were analyzed by the advisor, but these results are not included if the PDB is unplugged. The results cannot be viewed when the current container is a PDB.
See Also:
-
Oracle AI Database Administrator’s Guide to learn about Oracle Scheduler
-
Oracle AI Database PL/SQL Packages and Types Reference to learn about
DBMS_AUTO_TASK_ADMIN
Command-Line Interface to SQL Tuning Advisor
On the command line, you can use PL/SQL packages to perform SQL tuning tasks.
The following table describes the most relevant packages.
Table 26-3 SQL Tuning Advisor Packages
| Package | Description |
|---|---|
|
|
Enables you run SQL Tuning Advisor, manage SQL profiles, manage SQL tuning sets, and perform real-time SQL performance monitoring. To use this API, you must have the |
|
|
Provides an interface to |
See Also:
Oracle Database PL/SQL Packages and Types Reference to learn about DBMS_SQLTUNE ad DBMS_AUTO_TASK_ADMIN
Basic Tasks for Automatic SQL Tuning
This section explains the basic tasks in running SQL Tuning Advisor as an automatic task.
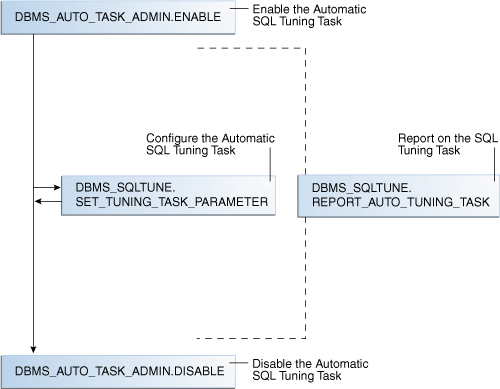
The following graphic shows the basic workflow.
As shown in Figure 26-12, the basic procedure is as follows:
-
Enable the Automatic SQL Tuning task.
-
Optionally, configure the Automatic SQL Tuning task.
-
Display the results of the Automatic SQL Tuning task.
-
Disable the Automatic SQL Tuning task.
Enabling and Disabling the Automatic SQL Tuning Task
You can enable or disable the Automatic SQL Tuning task using Cloud Control (preferred) or a command-line interface.
Enabling and Disabling the Automatic SQL Tuning Task Using Cloud Control
You can enable and disable all automatic maintenance tasks, including the Automatic SQL Tuning task, using Cloud Control.
To enable or disable the Automatic SQL Tuning task using Cloud Control:
-
Log in to Cloud Control with the appropriate credentials.
-
Under the Targets menu, select Databases.
-
In the list of database targets, select the target for the Oracle Database instance that you want to administer.
-
If prompted for database credentials, then enter the minimum credentials necessary for the tasks you intend to perform.
-
From the Administration menu, select Oracle Scheduler, then Automated Maintenance Tasks.
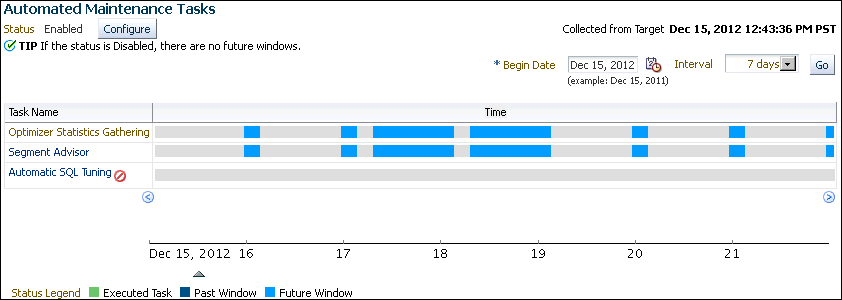
The Automated Maintenance Tasks page appears.
This page shows the predefined tasks. You access each task by clicking the corresponding link to get more information about the task.
-
Click Automatic SQL Tuning.
The Automatic SQL Tuning Result Summary page appears.
The Task Status section shows whether the Automatic SQL Tuning Task is enabled or disabled. In the following graphic, the task is disabled:
-
In Automatic SQL Tuning, click Configure.
The Automated Maintenance Tasks Configuration page appears.
By default, Automatic SQL Tuning executes in all predefined maintenance windows in
MAINTENANCE_WINDOW_GROUP. -
Perform the following steps:
-
In the Task Settings for Automatic SQL Tuning, select either Enabled or Disabled to enable or disable the automated task.
-
To disable Automatic SQL Tuning for specific days in the week, check the appropriate box next to the window name.
-
To change the characteristics of a window, click Edit Window Group.
-
Click Apply.
-
Enabling and Disabling the Automatic SQL Tuning Task from the Command Line
If you do not use Cloud Control to enable and disable the Automatic SQL Tuning task, then you must use the command line.
You have the following options:
-
Run the
ENABLEorDISABLEprocedure in theDBMS_AUTO_TASK_ADMINPL/SQL package.This package is the recommended command-line technique. For both the
ENABLEandDISABLEprocedures, you can specify a particular maintenance window with thewindow_nameparameter. -
Set the
STATISTICS_LEVELinitialization parameter toBASICto disable collection of all advisories and statistics, including Automatic SQL Tuning Advisor.Because monitoring and many automatic features are disabled, Oracle strongly recommends that you do not set
STATISTICS_LEVELtoBASIC.
To enable or disable Automatic SQL Tuning using DBMS_AUTO_TASK_ADMIN:
-
Connect SQL*Plus to the database with administrator privileges, and then do one of the following:
-
To enable the automated task, execute the following PL/SQL block:
BEGIN DBMS_AUTO_TASK_ADMIN.ENABLE ( client_name => 'sql tuning advisor' , operation => NULL , window_name => NULL ); END; / -
To disable the automated task, execute the following PL/SQL block:
BEGIN
  DBMS_AUTO_TASK_ADMIN.DISABLE (
    client_name => 'sql tuning advisor'
,   operation   => NULL
,   window_name => NULL
);
END;
/
-
-
Query the data dictionary to confirm the change.
For example, query
DBA_AUTOTASK_CLIENTas follows (sample output included):COL CLIENT_NAME FORMAT a20 SELECT CLIENT_NAME, STATUS FROM DBA_AUTOTASK_CLIENT WHERE CLIENT_NAME = 'sql tuning advisor'; CLIENT_NAME STATUS -------------------- -------- sql tuning advisor ENABLED
To disable collection of all advisories and statistics:
-
Connect SQL*Plus to the database with administrator privileges, and then query the current statistics level setting.
The following SQL*Plus command shows that
STATISTICS_LEVELis set toALL:sys@PROD> SHOW PARAMETER statistics_level NAME TYPE VALUE ------------------------------------ ----------- ----- statistics_level string ALL -
Set
STATISTICS_LEVELtoBASICas follows:sys@PROD> ALTER SYSTEM SET STATISTICS_LEVEL ='BASIC'; System altered.
See Also:
Oracle AI Database PL/SQL Packages and Types Reference for complete reference information
Configuring the Automatic SQL Tuning Task
You can configure the Automatic SQL Tuning task using Cloud Control or the command line.
Configuring the Automatic SQL Tuning Task Using Cloud Control
You can enable and disable all automatic maintenance tasks, including the Automatic SQL Tuning task, using Cloud Control. You must perform the operation as SYS or have the EXECUTE privilege on the PL/SQL package DBMS_AUTO_SQLTUNE.
To configure the Automatic SQL Tuning task using Cloud Control:
-
Log in to Cloud Control with the appropriate credentials.
-
Under the Targets menu, select Databases.
-
In the list of database targets, select the target for the Oracle Database instance that you want to administer.
-
If prompted for database credentials, then enter the minimum credentials necessary for the tasks you intend to perform.
-
From the Administration menu, click Oracle Scheduler, then Automated Maintenance Tasks.
The Automated Maintenance Tasks page appears.
This page shows the predefined tasks. You access each task by clicking the corresponding link to get more information about the task itself.
-
Click Automatic SQL Tuning.
The Automatic SQL Tuning Result Summary page appears.
-
Under Task Settings, click Configure next to Automatic SQL Tuning (
SYS_AUTO_SQL_TUNING_TASK).The Automated Maintenance Tasks Configuration page appears.
-
Under Task Settings, click Configure next to Automatic SQL Tuning.
The Automatic SQL Tuning Settings page appears.
-
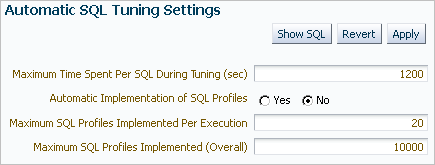
Make the desired changes and click Apply.
Configuring the Automatic SQL Tuning Task Using the Command Line
The DBMS_AUTO_SQLTUNE package enables you to configure automatic SQL tuning by specifying the task parameters using the SET_AUTO_TUNING_TASK_PARAMETER procedure.
Because the task is owned by SYS, only SYS can set task parameters.
The ACCEPT_SQL_PROFILE tuning task parameter specifies whether to implement SQL profiles automatically (true) or require user intervention (false). The default is AUTO, which means true if at least one SQL statement exists with a SQL profile and false if this condition is not satisfied.
Note:
When automatic implementation is enabled, the advisor only implements recommendations to create SQL profiles. Recommendations such as creating new indexes, gathering optimizer statistics, and creating SQL plan baselines are not automatically implemented.
Assumptions
This tutorial assumes the following:
-
You want the database to implement SQL profiles automatically, but to implement no more than 50 SQL profiles per execution, and no more than 50 profiles total on the database.
-
You want the task to time out after 1200 seconds per execution.
To set Automatic SQL Tuning task parameters:
-
Connect SQL*Plus to the database with the appropriate privileges, and then optionally query the current task settings.
For example, connect SQL*Plus to the database with administrator privileges and execute the following query:
COL PARAMETER_NAME FORMAT a25
COL VALUE FORMAT a10

SELECT PARAMETER_NAME, PARAMETER_VALUE AS "VALUE"
FROM   DBA_ADVISOR_PARAMETERS
WHERE  ( (TASK_NAME = 'SYS_AUTO_SQL_TUNING_TASK') AND
         ( (PARAMETER_NAME LIKE '%PROFILE%') OR
           (PARAMETER_NAME = 'LOCAL_TIME_LIMIT') OR
           (PARAMETER_NAME = 'EXECUTION_DAYS_TO_EXPIRE') ) );
Sample output appears as follows:
PARAMETER_NAME VALUE ------------------------- ---------- EXECUTION_DAYS_TO_EXPIRE 30 LOCAL_TIME_LIMIT 1000 ACCEPT_SQL_PROFILES FALSE MAX_SQL_PROFILES_PER_EXEC 20 MAX_AUTO_SQL_PROFILES 10000 -
Set parameters using PL/SQL code of the following form:
BEGIN
  DBMS_SQLTUNE.SET_TUNING_TASK_PARAMETER (
    task_name => 'SYS_AUTO_SQL_TUNING_TASK'
,   parameter => parameter_name
,   value     => value
);
END;
/
Example 26-3 Setting SQL Tuning Task Parameters
The following PL/SQL block sets a time limit to 20 minutes, and also automatically implements SQL profiles and sets limits for these profiles:
BEGIN
  DBMS_SQLTUNE.SET_TUNING_TASK_PARAMETER('SYS_AUTO_SQL_TUNING_TASK',
    'LOCAL_TIME_LIMIT', 1200);
  DBMS_SQLTUNE.SET_TUNING_TASK_PARAMETER('SYS_AUTO_SQL_TUNING_TASK',
    'ACCEPT_SQL_PROFILES', 'true');
  DBMS_SQLTUNE.SET_TUNING_TASK_PARAMETER('SYS_AUTO_SQL_TUNING_TASK',
    'MAX_SQL_PROFILES_PER_EXEC', 50);
  DBMS_SQLTUNE.SET_TUNING_TASK_PARAMETER('SYS_AUTO_SQL_TUNING_TASK',
    'MAX_AUTO_SQL_PROFILES', 10002);
END;
/
See Also:
Oracle Database PL/SQL Packages and Types Reference for complete reference information for DBMS_AUTO_SQLTUNE
Viewing Automatic SQL Tuning Reports
At any time during or after the running of the Automatic SQL Tuning task, you can view a tuning report.
The tuning report contains information about all executions of the automatic SQL tuning task. Depending on the sections that were included in the report, you can view information in the following sections:
-
General information
This section has a high-level description of the automatic SQL tuning task, including information about the inputs given for the report, the number of SQL statements tuned during the maintenance, and the number of SQL profiles created.
-
Summary
This section lists the SQL statements (by their SQL identifiers) that were tuned during the maintenance window and the estimated benefit of each SQL profile, or the execution statistics after performing a test execution of the SQL statement with the SQL profile.
-
Tuning findings
This section contains the following information about each SQL statement analyzed by SQL Tuning Advisor:
-
All findings associated with each SQL statement
-
Whether the profile was implemented on the database, and why
-
Whether the SQL profile is currently enabled on the database
-
Detailed execution statistics captured when testing the SQL profile
-
-
Explain plans
This section shows the old and new explain plans used by each SQL statement analyzed by SQL Tuning Advisor.
-
Errors
This section lists all errors encountered by the automatic SQL tuning task.
Viewing Automatic SQL Tuning Reports Using the Command Line
To generate a SQL tuning report as a CLOB, execute the DBMS_SQLTUNE.REPORT_AUTO_TUNING_TASK function.
You can store the CLOB in a variable and then print the variable to view the report.
Assumptions
This section assumes that you want to show all SQL statements that were analyzed in the most recent execution, including recommendations that were not implemented.
To create and access an Automatic SQL Tuning Advisor report:
-
Connect SQL*Plus to the database with administrator privileges, and then execute the
DBMS_SQLTUNE.REPORT_AUTO_TUNING_TASKfunction.The following example generates a text report to show all SQL statements that were analyzed in the most recent execution, including recommendations that were not implemented:
VARIABLE my_rept CLOB; BEGIN :my_rept :=DBMS_SQLTUNE.REPORT_AUTO_TUNING_TASK ( begin_exec => NULL , end_exec => NULL , type => 'TEXT' , level => 'TYPICAL' , section => 'ALL' , object_id => NULL , result_limit => NULL ); END; / PRINT :my_rept -
Read the general information section for an overview of the tuning execution.
The following sample shows the Automatic SQL Tuning task analyzed 17 SQL statements in just over 7 minutes:
MY_REPT ------------------------------------------------------------------------ GENERAL INFORMATION SECTION ------------------------------------------------------------------------ Tuning Task Name : SYS_AUTO_SQL_TUNING_TASK Tuning Task Owner : SYS Workload Type : Automatic High-Load SQL Workload Execution Count : 6 Current Execution : EXEC_170 Execution Type : TUNE SQL Scope : COMPREHENSIVE Global Time Limit(seconds) : 3600 Per-SQL Time Limit(seconds) : 1200 Completion Status : COMPLETED Started at : 04/16/2012 10:00:00 Completed at : 04/16/2012 10:07:11 Number of Candidate SQLs : 17 Cumulative Elapsed Time of SQL (s) : 8 -
Look for findings and recommendations.
If SQL Tuning Advisor makes a recommendation, then weigh the pros and cons of accepting it.
The following example shows that SQL Tuning Advisor found a plan for a statement that is potentially better than the existing plan. The advisor recommends implementing a SQL profile.
------------------------------------------------------------------------
SQLs with Findings Ordered by Maximum (Profile/Index) Benefit, Object ID
------------------------------------------------------------------------
ob ID  SQL ID        stats profile(benefit) index(benefit) restructure
------ ------------- ----- ---------------- -------------- -----------
    82 dqjcc345dd4ak                 58.03%
    72 51bbkcd9zwsjw                                                 2
    81 03rxjf8gb18jg

------------------------------------------------------------------------
DETAILS SECTION
------------------------------------------------------------------------
 Statements with Results Ordered by Max (Profile/Index) Benefit, Obj ID
------------------------------------------------------------------------
Object ID  : 82
Schema Name: DBA1
SQL ID     : dqjcc345dd4ak
SQL Text   : SELECT status FROM dba_autotask_client WHERE client_name=:1

------------------------------------------------------------------------
FINDINGS SECTION (1 finding)
------------------------------------------------------------------------

1- SQL Profile Finding (see explain plans section below)
--------------------------------------------------------
  A potentially better execution plan was found for this statement.
  The SQL profile was not automatically created because the verified
  benefit was too low.

  Recommendation (estimated benefit: 58.03%)
  ------------------------------------------
  - Consider accepting the recommended SQL profile.
    execute dbms_sqltune.accept_sql_profile(task_name =>
         'SYS_AUTO_SQL_TUNING_TASK', object_id => 82, replace => TRUE);

  Validation results
  ------------------
  The SQL profile was tested by executing its plan and the original
  plan and measuring their respective execution statistics. A plan
  may have been only partially executed if the other could be run
  to completion in less time.

                           Original Plan  With SQL Profile  % Improved
                           -------------  ----------------  ----------
  Completion Status:            COMPLETE          COMPLETE
  Elapsed Time(us):               26963              8829      67.25 %
  CPU Time(us):                   27000              9000      66.66 %
  User I/O Time(us):                 25                14         44 %
  Buffer Gets:                      905               380      58.01 %
  Physical Read Requests:             0                 0
  Physical Write Requests:            0                 0
  Physical Read Bytes:                0                 0
  Physical Write Bytes:            7372              7372          0 %
  Rows Processed:                     1                 1
  Fetches:                            1                 1
  Executions:                         1                 1

  Notes
  -----
  1. The original plan was first executed to warm the buffer cache.
  2. Statistics for original plan were averaged over next 9 executions.
  3. The SQL profile plan was first executed to warm the buffer cache.
  4. Statistics for the SQL profile plan were averaged over
     next 9 executions.
See Also:
Oracle AI Database PL/SQL Packages and Types Reference for complete reference information.
Running SQL Tuning Advisor On Demand
You can run SQL Tuning Advisor on demand.
About On-Demand SQL Tuning
On-demand SQL tuning is defined as any invocation of SQL Tuning Advisor that does not result from the Automatic SQL Tuning task.
Purpose of On-Demand SQL Tuning
Typically, you invoke SQL Tuning Advisor to run ADDM proactively, or to tune SQL statement reactively when users complain about suboptimal performance.
In both the proactive and reactive scenarios, running SQL Tuning Advisor is usually the quickest way to fix unexpected SQL performance problems.
User Interfaces for On-Demand SQL Tuning
The recommended user interface for running SQL Tuning Advisor manually is Cloud Control.
Accessing the SQL Tuning Advisor Using Cloud Control
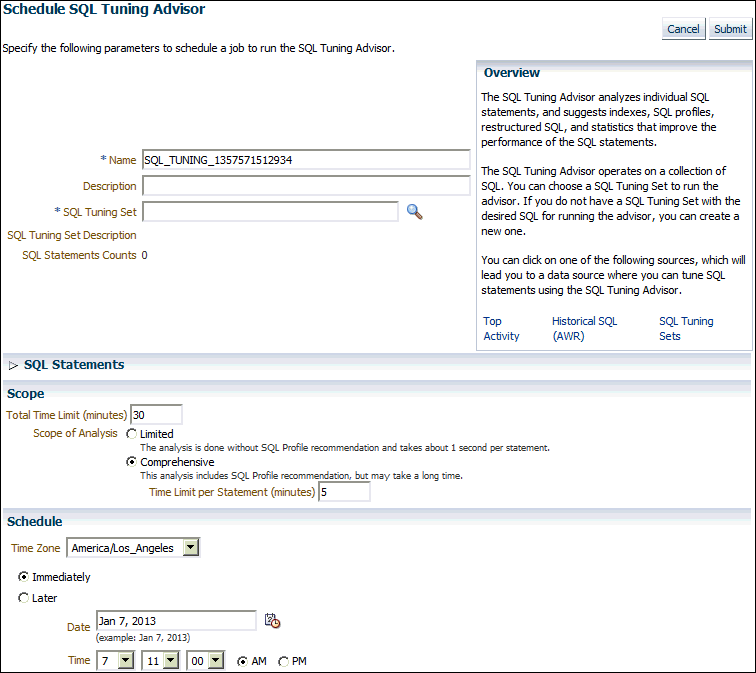
Automatic Database Diagnostic Monitor (ADDM) automatically identifies high-load SQL statements. If ADDM identifies such statements, then click Schedule/Run SQL Tuning Advisor on the Recommendation Detail page to run SQL Tuning Advisor.
To tune SQL statements manually using SQL Tuning Advisor:
-
Log in to Cloud Control with the appropriate credentials.
-
Under the Targets menu, select Databases.
-
In the list of database targets, select the target for the Oracle Database instance that you want to administer.
-
If prompted for database credentials, then enter the minimum credentials necessary for the tasks you intend to perform.
-
From the Performance menu, click SQL, then SQL Tuning Advisor.
The Schedule SQL Tuning Advisor page appears.
See Also:
Oracle AI Database Get Started with Performance Tuning to learn how to configure and run SQL Tuning Advisor using Cloud Control.
Command-Line Interface to On-Demand SQL Tuning
If Cloud Control is unavailable, then you can run SQL Tuning Advisor using procedures in the DBMS_SQLTUNE package.
To use the APIs, the user must have the ADVISOR privilege.
See Also:
Oracle AI Database PL/SQL Packages and Types Reference for complete reference information
Basic Tasks in On-Demand SQL Tuning
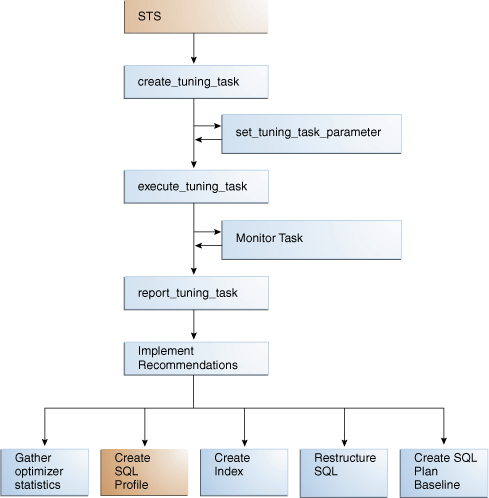
This section explains the basic tasks in running SQL Tuning Advisor using the DBMS_SQLTUNE package.
The following graphic shows the basic workflow when using the PL/SQL APIs.
As shown in Figure 26-12, the basic procedure is as follows:
-
Prepare or create the input to SQL Tuning Advisor. The input can be either:
-
The text of a single SQL statement
-
A SQL tuning set that contains one or more statements
-
-
Create a SQL tuning task.
See "Creating a SQL Tuning Task".
-
Optionally, configure the SQL tuning task that you created.
-
Execute a SQL tuning task.
See "Executing a SQL Tuning Task".
-
Optionally, check the status or progress of a SQL tuning task.
-
Display the results of a SQL tuning task.
-
Implement recommendations as appropriate.
See Also:
Oracle AI Database Get Started with Performance Tuning to learn how to tune SQL using Cloud Control
Creating a SQL Tuning Task
To create a SQL tuning task execute the DBMS_SQLTUNE.CREATE_TUNING_TASK function.
You can create tuning tasks from any of the following:
-
The text of a single SQL statement
-
A SQL tuning set containing multiple statements
-
A SQL statement selected by SQL identifier from the shared SQL area
-
A SQL statement selected by SQL identifier from AWR
The scope parameter is one of the most important for this function. You can set this parameter to the following values:
-
LIMITEDSQL Tuning Advisor produces recommendations based on statistical checks, access path analysis, and SQL structure analysis. SQL profile recommendations are not generated.
-
COMPREHENSIVESQL Tuning Advisor carries out all the analysis it performs under limited scope plus SQL profiling.
Assumptions
This tutorial assumes the following:
-
You want to tune as user
hr, who has theADVISORprivilege. -
You want to tune the following query:
SELECT /*+ ORDERED */ * FROM employees e, locations l, departments d WHERE e.department_id = d.department_id AND l.location_id = d.location_id AND e.employee_id < :bnd; -
You want to pass the bind variable
100to the preceding query. -
You want SQL Tuning Advisor to perform SQL profiling.
-
You want the task to run no longer than 60 seconds.
To create a SQL tuning task:
-
Connect SQL*Plus to the database with the appropriate privileges, and then run the
DBMS_SQLTUNE.CREATE_TUNING_TASKfunction.For example, execute the following PL/SQL program:
DECLARE my_task_name VARCHAR2(30); my_sqltext CLOB; BEGIN my_sqltext := 'SELECT /*+ ORDERED */ * ' || 'FROM employees e, locations l, departments d ' || 'WHERE e.department_id = d.department_id AND ' || 'l.location_id = d.location_id AND ' || 'e.employee_id < :bnd'; my_task_name := DBMS_SQLTUNE.CREATE_TUNING_TASK ( sql_text => my_sqltext , bind_list => sql_binds(anydata.ConvertNumber(100)) , user_name => 'HR' , scope => 'COMPREHENSIVE' , time_limit => 60 , task_name => 'STA_SPECIFIC_EMP_TASK' , description => 'Task to tune a query on a specified employee' ); END; / -
Optionally, query the status of the task.
The following example queries the status of all tasks owned by the current user, which in this example is
hr:COL TASK_ID FORMAT 999999 COL TASK_NAME FORMAT a25 COL STATUS_MESSAGE FORMAT a33 SELECT TASK_ID, TASK_NAME, STATUS, STATUS_MESSAGE FROM USER_ADVISOR_LOG;Sample output appears below:
TASK_ID TASK_NAME                 STATUS      STATUS_MESSAGE
------- ------------------------- ----------- --------------
    884 STA_SPECIFIC_EMP_TASK     INITIAL
In the preceding output, the
INITIALstatus indicates that the task has not yet started execution.
See Also:
Oracle AI Database PL/SQL
Packages and Types Reference to learn about the DBMS_SQLTUNE.CREATE_TUNING_TASK function
Configuring a SQL Tuning Task
To change the parameters of a tuning task after it has been created, execute the DBMS_SQLTUNE.SET_TUNING_TASK_PARAMETER function.
This tutorial assumes the following:
-
You want to tune with user account
hr, which has been granted theADVISORprivilege. -
You want to tune the
STA_SPECIFIC_EMP_TASKcreated in "Creating a SQL Tuning Task". -
You want to change the maximum time that the SQL tuning task can run to 300 seconds.
To configure a SQL tuning task:
-
Connect SQL*Plus to the database with the appropriate privileges, and then run the
DBMS_SQLTUNE.SET_TUNING_TASK_PARAMETERfunction.For example, execute the following PL/SQL program to change the time limit of the tuning task to 300 seconds:
BEGIN DBMS_SQLTUNE.SET_TUNING_TASK_PARAMETER ( task_name => 'STA_SPECIFIC_EMP_TASK' , parameter => 'TIME_LIMIT' , value => 300 ); END; / -
Optionally, verify that the task parameter was changed.
The following example queries the values of all used parameters in task
STA_SPECIFIC_EMP_TASK:COL PARAMETER_NAME FORMAT a25 COL VALUE FORMAT a15 SELECT PARAMETER_NAME, PARAMETER_VALUE AS "VALUE" FROM USER_ADVISOR_PARAMETERS WHERE TASK_NAME = 'STA_SPECIFIC_EMP_TASK' AND PARAMETER_VALUE != 'UNUSED' ORDER BY PARAMETER_NAME;Sample output appears below:
PARAMETER_NAME            VALUE
------------------------- ---------------
DAYS_TO_EXPIRE            30
DEFAULT_EXECUTION_TYPE    TUNE SQL
EXECUTION_DAYS_TO_EXPIRE  UNLIMITED
JOURNALING                INFORMATION
MODE                      COMPREHENSIVE
SQL_LIMIT                 -1
SQL_PERCENTAGE            1
TARGET_OBJECTS            1
TEST_EXECUTE              AUTO
TIME_LIMIT                300
Example 26-4 Tuning a Standby Database Workload Using a Database Link
Starting in Oracle Database 12c Release 2 (12.2), you can tune a standby database workload by specifying a database link in the database_link_to parameter. For security reasons, Oracle recommends using a private database link. The link must be owned by SYS and accessed by a privileged user. Oracle Database includes a default privileged user named SYS$UMF.
The following program, which is issued on the standby database, shows a sample SQL tuning session for a query of table1. The database_link_to parameter specifies the name of the standby-to-primary database link.
VARIABLE tname VARCHAR2(30);
VARIABLE query VARCHAR2(500);

EXEC :tname := 'my_task';
EXEC :query := 'SELECT /*+ FULL(t)*/ col1 FROM table1 t WHERE col1=9000';

BEGIN
:tname := DBMS_SQLTUNE.CREATE_TUNING_TASK(
            sql_text         => :query
          , task_name        => :tname
          , database_link_to => 'lnk_to_pri' );
END;
/

EXEC DBMS_SQLTUNE.EXECUTE_TUNING_TASK(:tname);

SELECT DBMS_SQLTUNE.REPORT_TUNING_TASK(:tname) FROM DUAL;

BEGIN
  DBMS_SQLTUNE.ACCEPT_SQL_PROFILE(
    task_name        => :tname
,   name             => 'prof'
,   task_owner       => 'SYS'
,   replace          => TRUE
,   database_link_to => 'lnk_to_pri' );
END;
/
Note that the bind_list parameter of CREATE_TUNING_TASK is not supported on a standby database.
See Also:
-
Oracle Data Guard Concepts and Administration to learn how to perform remote tuning in a Data Guard environment
-
Oracle AI Database PL/SQL Packages and Types Reference for
DBMS_SQLTUNE.SET_TUNING_TASK_PARAMETERsyntax and semantics
Executing a SQL Tuning Task
To execute a SQL tuning task, use the DBMS_SQLTUNE.EXECUTE_TUNING_TASK function. The most important parameter is task_name.
Note:
You can also execute the automatic tuning task SYS_AUTO_SQL_TUNING_TASK using the EXECUTE_TUNING_TASK API. SQL Tuning Advisor performs the same analysis and actions as it would when run automatically.
Assumptions
This tutorial assumes the following:
-
You want to tune as user
hr, who has theADVISORprivilege. -
You want to execute the
STA_SPECIFIC_EMP_TASKcreated in "Creating a SQL Tuning Task".
To execute a SQL tuning task:
-
Connect SQL*Plus to the database with the appropriate privileges, and then run the
DBMS_SQLTUNE.EXECUTE_TUNING_TASKfunction.For example, execute the following PL/SQL program:
BEGIN DBMS_SQLTUNE.EXECUTE_TUNING_TASK(task_name=>'STA_SPECIFIC_EMP_TASK'); END; / -
Optionally, query the status of the task.
The following example queries the status of all tasks owned by the current user, which in this example is
hr:COL TASK_ID FORMAT 999999 COL TASK_NAME FORMAT a25 COL STATUS_MESSAGE FORMAT a33 SELECT TASK_ID, TASK_NAME, STATUS, STATUS_MESSAGE FROM USER_ADVISOR_LOG;Sample output appears below:
TASK_ID TASK_NAME                 STATUS      STATUS_MESSAGE
------- ------------------------- ----------- --------------
    884 STA_SPECIFIC_EMP_TASK     COMPLETED
See Also:
Oracle AI Database PL/SQL
Packages and Types Reference for complete reference information about the DBMS_SQLTUNE.EXECUTE_TUNING_TASK function
Monitoring a SQL Tuning Task
When you create a SQL tuning task in Cloud Control, no separate monitoring step is necessary. Cloud Control displays the status page automatically.
If you do not use Cloud Control, then you can monitor currently executing SQL tuning tasks by querying the data dictionary and dynamic performance views. The following table describes the relevant views.
Table 26-4 DBMS_SQLTUNE.EXECUTE_TUNING_TASK Parameters
| View | Description |
|---|---|
|
|
Displays information about tasks owned by the current user. The view contains one row for each task. Each task has a name that is unique to the owner. Task names are just informational and no uniqueness is enforced within any other namespace. |
|
|
Displays information about the progress of advisor execution. |
Assumptions
This tutorial assumes the following:
-
You tune as user
hr, who has theADVISORprivilege. -
You monitor the
STA_SPECIFIC_EMP_TASKthat you executed in "Executing a SQL Tuning Task".
To monitor a SQL tuning task:
-
Connect SQL*Plus to the database with the appropriate privileges, and then determine whether the task is executing or completed.
For example, query the status of
STA_SPECIFIC_EMP_TASKas follows:SELECT STATUS FROM USER_ADVISOR_TASKS WHERE TASK_NAME = 'STA_SPECIFIC_EMP_TASK';The following output shows that the task has completed:
STATUS ----------- EXECUTING -
Determine the progress of an executing task.
The following example queries the status of the task with task ID
884:VARIABLE my_tid NUMBER; EXEC :my_tid := 884 COL ADVISOR_NAME FORMAT a20 COL SOFAR FORMAT 999 COL TOTALWORK FORMAT 999 SELECT TASK_ID, ADVISOR_NAME, SOFAR, TOTALWORK, ROUND(SOFAR/TOTALWORK*100,2) "%_COMPLETE" FROM V$ADVISOR_PROGRESS WHERE TASK_ID = :my_tid;Sample output appears below:
   TASK_ID ADVISOR_NAME         SOFAR TOTALWORK %_COMPLETE
---------- -------------------- ----- --------- ----------
       884 SQL Tuning Advisor       1         2         50
See Also:
Oracle AI Database
Reference to learn about the V$ADVISOR_PROGRESS view
Displaying the Results of an SQL Tuning Task
To report the results of a tuning task, use the DBMS_SQLTUNE.REPORT_TUNING_TASK function.
The report contains all the findings and recommendations of SQL Tuning Advisor. For each proposed recommendation, the report provides the rationale and benefit along with the SQL statements needed to implement the recommendation.
Assumptions
This tutorial assumes the following:
-
You want to tune as user
hr, who has theADVISORprivilege. -
You want to access the report for the
STA_SPECIFIC_EMP_TASKexecuted in "Executing a SQL Tuning Task".
To view the report for a SQL tuning task:
-
Connect SQL*Plus to the database with the appropriate privileges, and then run the
DBMS_SQLTUNE.REPORT_TUNING_TASKfunction.Note:
As of Oracle DB 23ai, forSELECTs that do not require table access,FROM DUALis now implicit when there is noFROMclause.FROM DUALis supported but is no longer required.SELECT <expr_list>;is sufficient.For example, you run the following statements:
SET LONG 1000
SET LONGCHUNKSIZE 1000
SET LINESIZE 100
SELECT DBMS_SQLTUNE.REPORT_TUNING_TASK( 'STA_SPECIFIC_EMP_TASK' )
FROM   DUAL;
Truncated sample output appears below:
DBMS_SQLTUNE.REPORT_TUNING_TASK('STA_SPECIFIC_EMP_TASK') ------------------------------------------------------------------------ GENERAL INFORMATION SECTION ------------------------------------------------------------------------ Tuning Task Name : STA_SPECIFIC_EMP_TASK Tuning Task Owner : HR Workload Type : Single SQL Statement Execution Count : 11 Current Execution : EXEC_1057 Execution Type : TUNE SQL Scope : COMPREHENSIVE Time Limit(seconds): 300 Completion Status : COMPLETED Started at : 04/22/2012 07:35:49 Completed at : 04/22/2012 07:35:50 ------------------------------------------------------------------------ Schema Name: HR SQL ID : dg7nfaj0bdcvk SQL Text : SELECT /*+ ORDERED */ * FROM employees e, locations l, departments d WHERE e.department_id = d.department_id AND l.location_id = d.location_id AND e.employee_id < :bnd Bind Variables : 1 - (NUMBER):100 ------------------------------------------------------------------------ FINDINGS SECTION (4 findings) ----------------------------------------------- -
Interpret the results.
See Also:
-
"Viewing Automatic SQL Tuning Reports Using the Command Line"
-
Oracle AI Database PL/SQL Packages and Types Reference for complete reference information
The Automatic SQL Tuning Set
The Automatic SQL Tuning Set (ASTS) is a system-maintained record of SQL execution plans and SQL statement performance metrics seen by the database.
The ASTS is required by automatic features such as automatic indexing and automatic SQL plan management. Over time, it accumulates information on all SQL statements executed on the system (including details of all execution plans).
ASTS and AWR
ASTS is complementary to AWR. Both are core manageability infrastructure components of Oracle AI Database.
Like AWR, the ASTS is a historic record of SQL execution plans and SQL statement performance metrics. It differs from the Automatic Workload Repository (AWR) because it is not limited to statements that consume significant system resources. Over time, ASTS will include examples of all queries seen on the system. However, it does impose a limit on the collection of non-reusable statements such as ad-hoc queries or statements that use literals instead of bind variables.
ASTS is particularly useful for diagnosing and potentially correcting SQL performance regressions in situations where the regression is caused by a plan change. In cases like this, the better plan may not be available in AWR, but it is likely to be available in ASTS. This is significant because, for example, SQL plan management can be used to locate, test, and enforce better SQL execution plans contained in ASTS. Automatic SQL plan management implements this entire workflow without manual intervention.
Example 26-5 How to View Captured SQL statements in ASTS
CopySelect  sql_text
From  dba_sqlset_Statements
Where  sqlset_name = 'SYS_AUTO_STS';
Example 26-6 Enabling the ASTS Task
CopyBegin
   DBMS_Auto_Task_Admin.Enable(
       Client_Name => 'Auto STS Capture Task',
       Operation => NULL,
       Window_name => NULL);
End;
/
Example 26-7 Disabling the ASTS Task
CopyBegin
   DBMS_Auto_Task_Admin.Disable(
       Client_Name => 'Auto STS Capture Task',
       Operation => NULL,
       Window_name => NULL);
End;
/
Example 26-8 Viewing Task Status
CopySelect Task_Name, Enabled
From   DBA_AutoTask_Schedule_Control
Where  Task_Name = 'Auto STS Capture Task';
See Also:
The Oracle AI Database Reference for the following views.
