7.3.3 Using the Geographical Layout
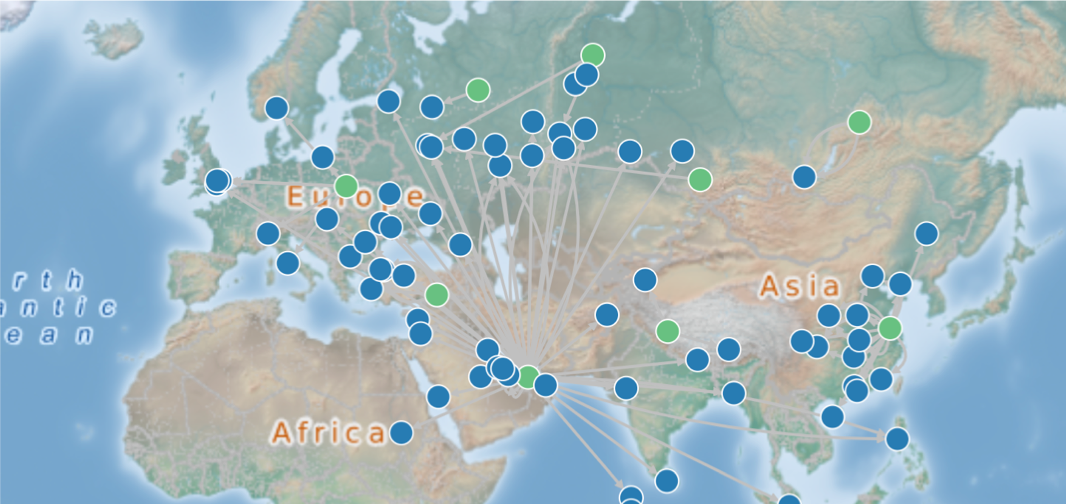
The Graph Visualization application offers a choice of layouts for rendering graphs. One of them is the Geographical layout that will show the graph (vertices and edges) on a global map.
The following figure shows a graph rendered on a geographical layout in the Graph
Visualization application:
In order to view your vertices on a map, they must include a geographical
location, in the form of a pair of properties that contain the longitude and latitude
coordinates for that vertex. For
example:
+-------------------------------------------------+
| iata | city        | longitude    | latitude    |
+-------------------------------------------------+
| SIN  | Singapore   | 103.994003   | 1.35019     |
| LAX  | Los Angeles | -118.4079971 | 33.94250107 |
| MUC  | Munich      | 11.7861      | 48.353802   |
| CDG  | Paris       | 2.55         | 49.012798   |
| LHR  | London      | -0.461941    | 51.4706     |
+-------------------------------------------------+
Note:
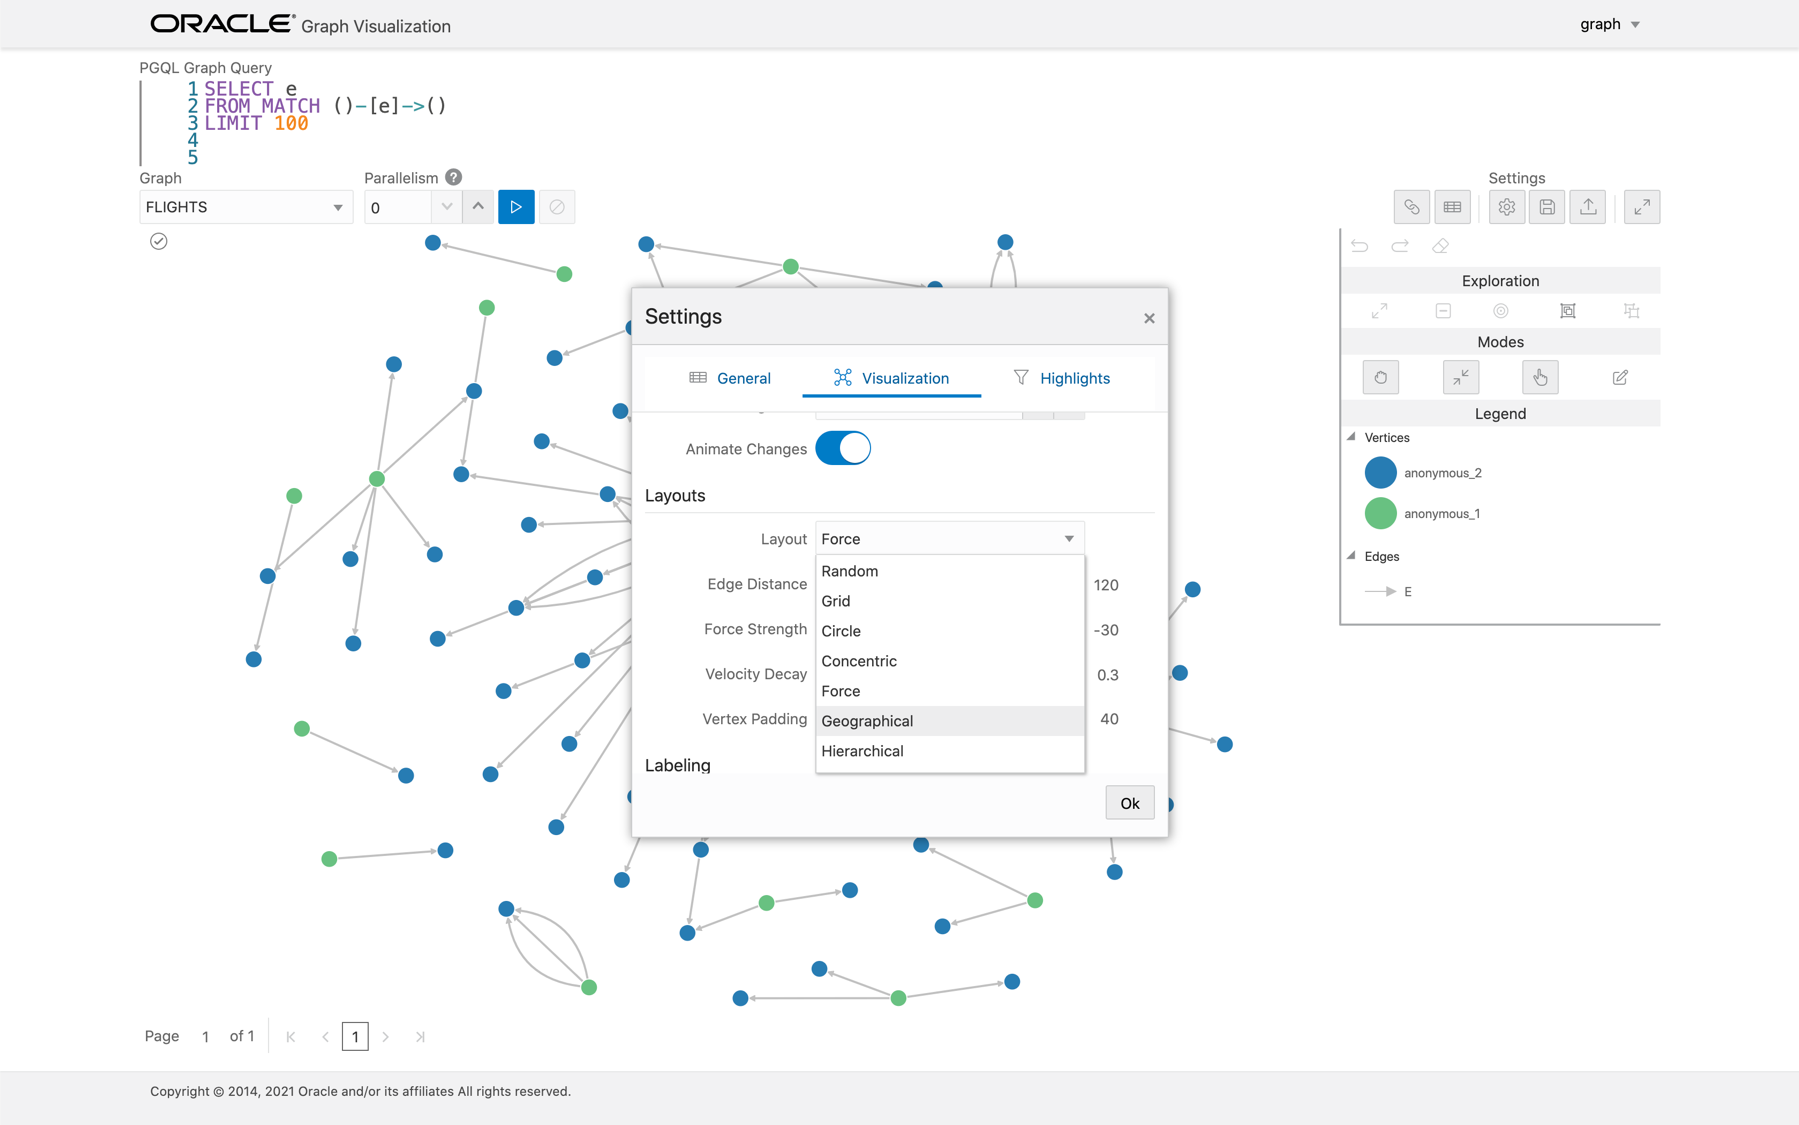
You can use any name for the longitude and latitude properties (such as X and Y, or long and lat). But, you must ensure that the longitude/latitude pair are in the WGS84 system (GPS coordinates), and the coordinates are expressed in decimal degrees.You can select the geographical layout in the Graph Visualization settings window as
shown:
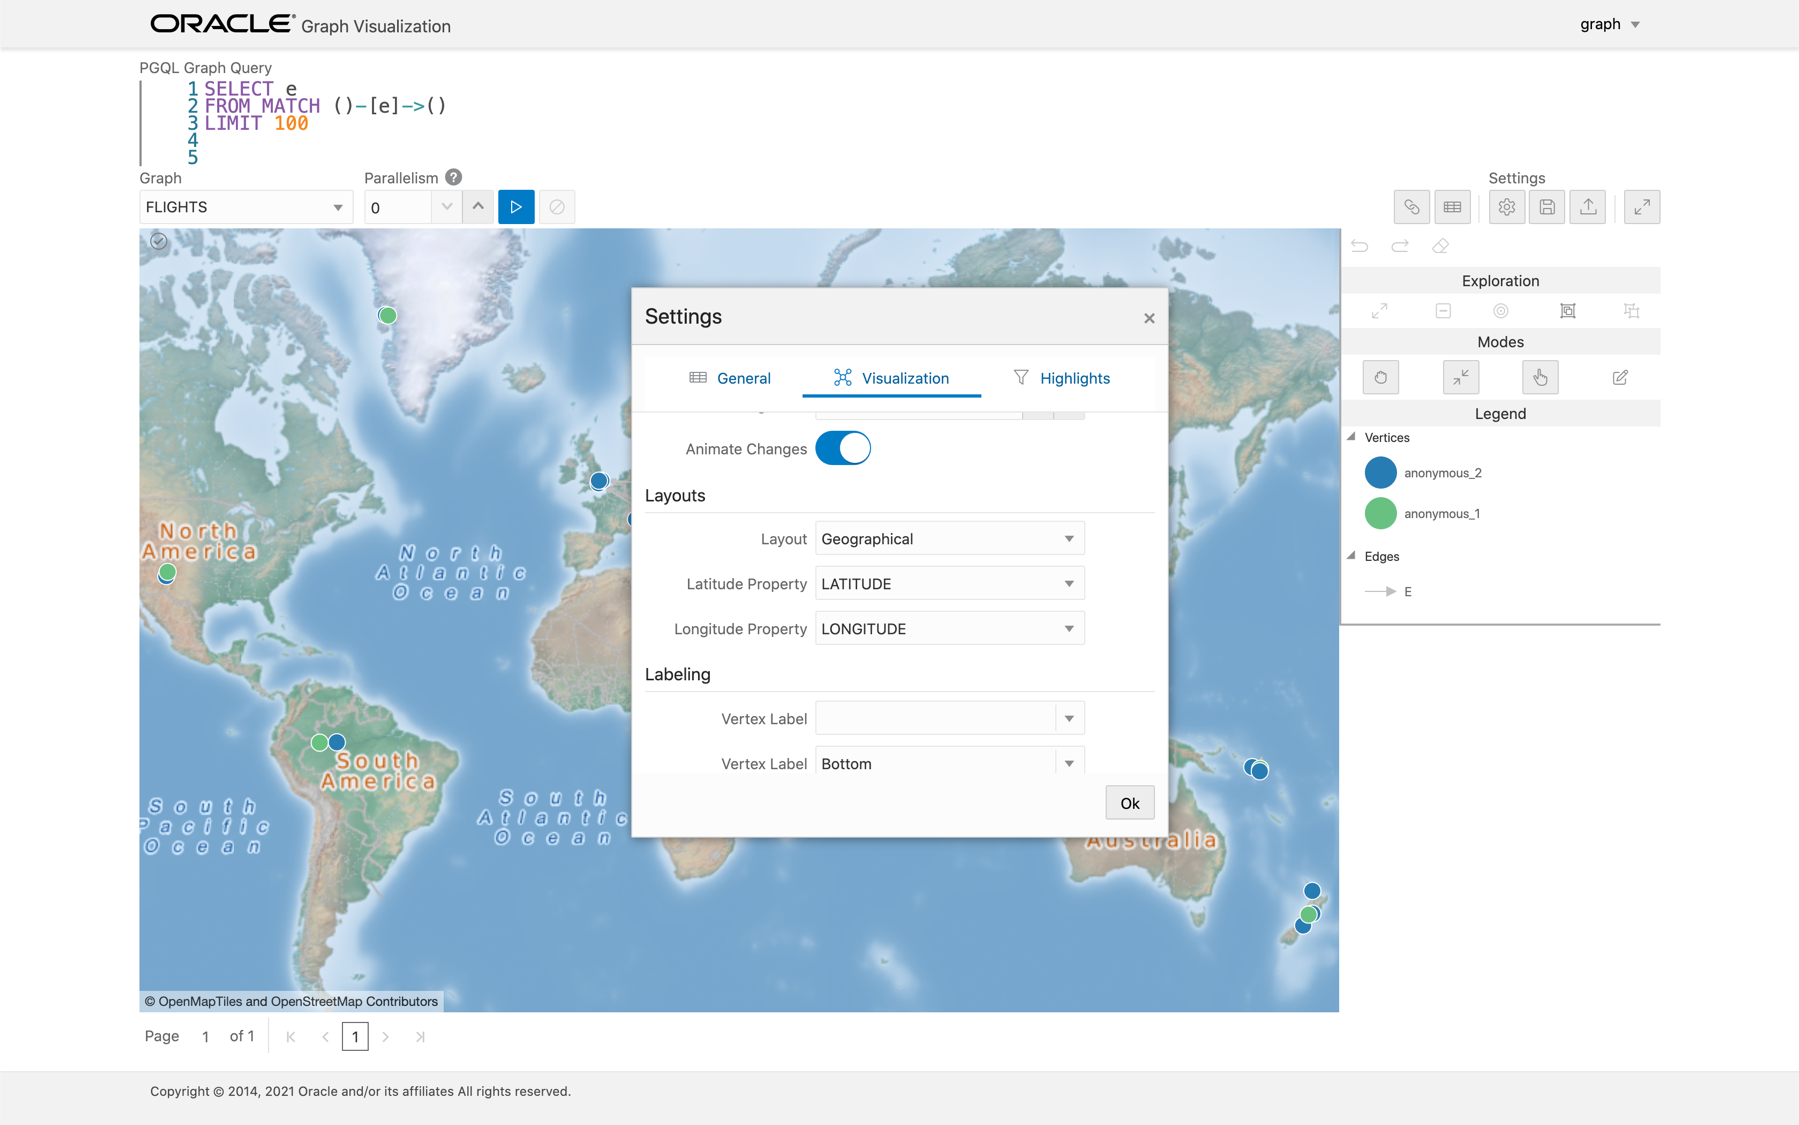
Then, select the properties in your vertices that contain the geographical coordinates as shown:
Figure 7-6 Selecting the Coordinates for the Geographical layout

Description of "Figure 7-6 Selecting the Coordinates for the Geographical layout"
You can now move around the map and zoom in/out using your mouse or trackpad. From now on, whenever you enter a new PGQL query, the map will automatically center and zoom the vertices returned by the query.
Parent topic: Using the Graph Visualization Application

