7.3 Using the Graph Visualization Application
The principal points of entry for the Graph Visualization application are the query editor and the graph lists.
When you start the graph visualization application, the graph list will be populated with the graphs loaded in PGX. To run queries against a graph, select that graph. The query lets you write PGQL queries that can be visualized. (PGQL is the SQL-like query language supported by the Graph Visualization application.)
Note:
Graph Visualization application supports only PGQLSELECT queries.
Modifying a graph using a PGQL INSERT, UPDATE or
DELETE query is not supported.
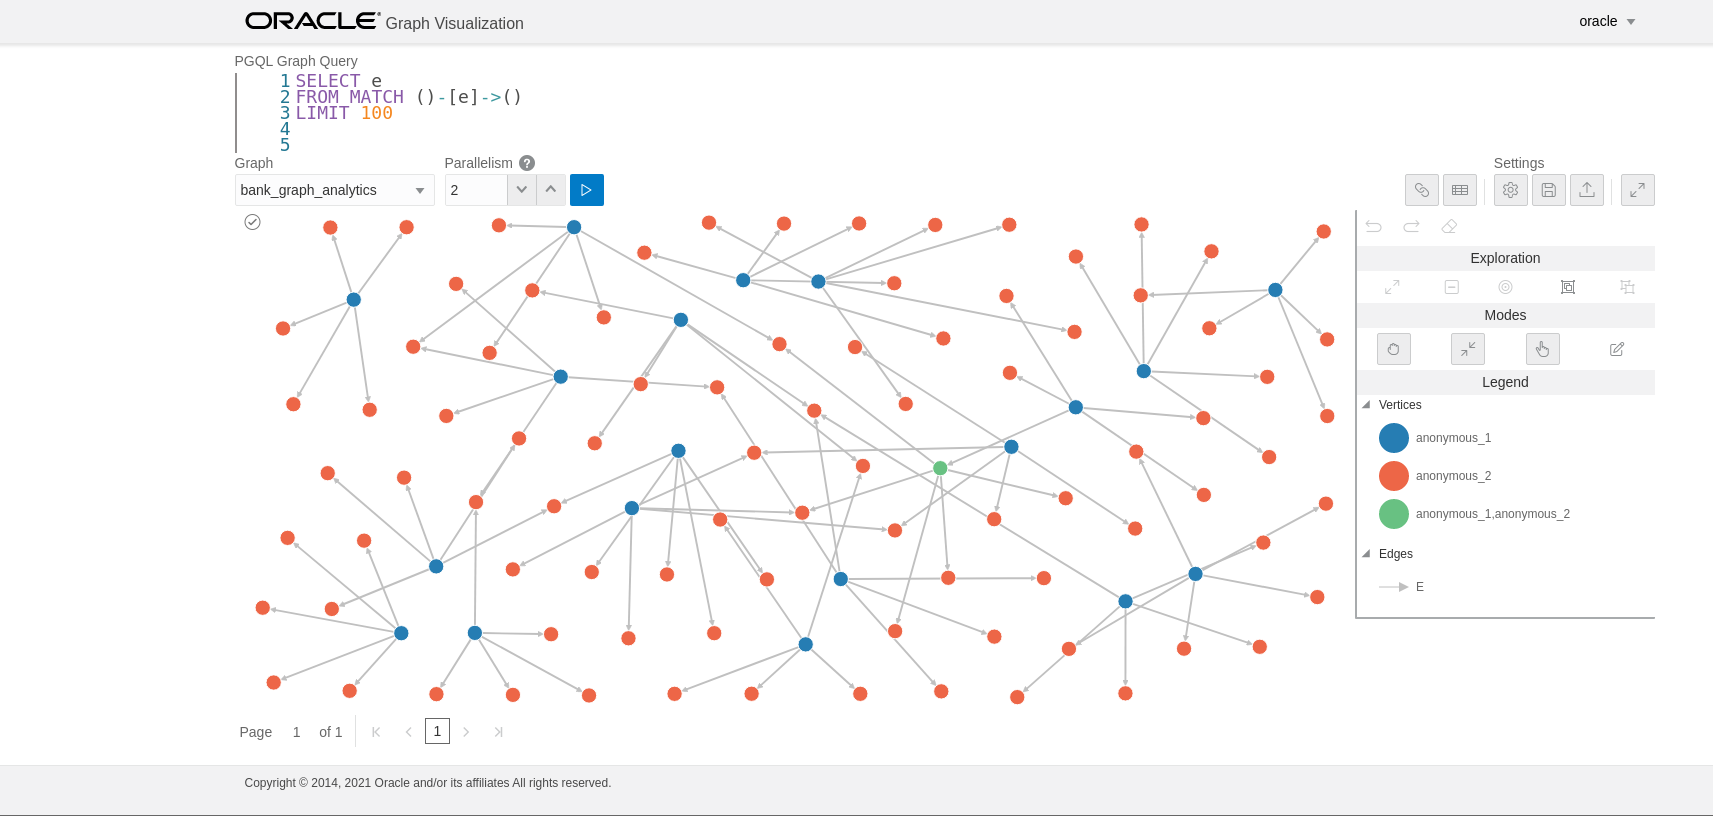
Once the query is ready and the desired graph is selected, click the Run icon to execute the query. The following figure shows a query visualization identifying all edges that are directed edges from any vertex in the graph to any other vertex.
When a query is successful, the graph visualization is displayed, including nodes and their connections. You can right-click a node or connection to display tooltip information, and you can drag the nodes around.
- Graph Visualization Modes
The buttons on the right let you switch between two modes: Graph Manipulation and Zoom/Move. - Graph Visualization Settings
You can click the Settings gear icon to display the Graph Visualization settings window. - Using the Geographical Layout
The Graph Visualization application offers a choice of layouts for rendering graphs. One of them is the Geographical layout that will show the graph (vertices and edges) on a global map. - Using Live Search
Live Search lets you to search the displayed graph and add live fuzzy search score to each item, so you can create a Highlight which visually shows the results of the search in the graph immediately. - Using URL Parameters to Control the Graph Visualization Application
You can provide the Graph Visualization application input data through URL parameters instead of using the form fields of the user interface.
Parent topic: Graph Visualization Application
