1 Introduction to Property Graphs
Property graphs give you a different way of looking at your data.
You can model your data as a graph by making data entities vertices in the graph, and relationships between them as edges in the graph. For example, in a bank, customer accounts can be vertices, and cash transfer relationships between them can be edges.
When you view your data as a graph, you can analyze your data based on the connections and relationships between them. You can run graph analytics algorithms like PageRank to measure the relative importance of data entities based on the relationships between them (for instance, links between web pages).
- What Are Property Graphs?
A property graph consists of a set of objects or vertices, and a set of arrows or edges connecting the objects. - About the Property Graph Feature of Oracle Database
The Property Graph feature delivers advanced graph query and analytics capabilities in Oracle Database. - Overview of Property Graph Architecture
The property graph feature of Oracle Database supports the following architecture models. - Learn About the Graph Server (PGX)
The in-memory graph server layer enables you to analyze property graphs using parallel in-memory execution. - Security Best Practices with Graph Data
Several security-related best practices apply when working with graph data. - About Oracle Graph Server and Client Accessibility
This section provides information on the accessibility features for Oracle Graph Server and Client.
Parent topic: Getting Started with Oracle Property Graphs
1.1 What Are Property Graphs?
A property graph consists of a set of objects or vertices, and a set of arrows or edges connecting the objects.
Vertices and edges can have multiple properties, which are represented as key-value pairs.
Each vertex has a unique identifier and can have:
-
A set of outgoing edges
-
A set of incoming edges
-
A collection of properties
Each edge has a unique identifier and can have:
-
An outgoing vertex
-
An incoming vertex
-
A text label that describes the relationship between the two vertices
-
A collection of properties
For vertices and edges, each property is identified with a unique name.
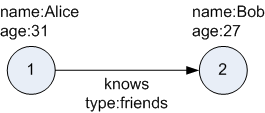
The following figure illustrates a very simple property graph with two vertices and one edge. The two vertices have identifiers 1 and 2. Both vertices have properties name and age. The edge is from the outgoing vertex 1 to the incoming vertex 2. The edge has a text label knows and a property type identifying the type of relationship between vertices 1 and 2.
A property graph can have self-edges (that is, an edge whose source and destination vertex are the same), as well as multiple edges between the same source and destination vertices.
A property graph can also have different types of vertices and edges in the same graph. For example a graph can have a set of vertices with label Person and a set of vertices with label Place, with different properties relevant to these two sets of vertices.
The property graph data model is similar to the W3C standards-based Resource Description Framework (RDF) graph data model; however, the property graph data model is simpler and less precise than RDF.
The property graph data model features and analytic APIs make property graphs a good candidate for use cases such as these:
-
Identifying influencers in a social network
-
Predicting trends and customer behavior
-
Discovering relationships based on pattern matching
-
Identifying clusters to customize campaigns
Parent topic: Introduction to Property Graphs
1.2 About the Property Graph Feature of Oracle Database
The Property Graph feature delivers advanced graph query and analytics capabilities in Oracle Database.
This feature supports graph operations, indexing, queries, search, and in-memory analytics.
Graphs manage networks of linked data as vertices, edges, and properties of the vertices and edges. Graphs are commonly used to model, store, and analyze relationships found in social networks, cybersecurity, utilities and telecommunications, life sciences and clinical data, and knowledge networks.
Typical graph analyses encompass graph traversal, recommendations, finding communities and influencers, and pattern matching. Industries including telecommunications, life sciences and healthcare, security, media, and publishing can benefit from graphs.
The property graph features of Oracle Database support those use cases with the following capabilities:
- A scalable graph database
- Developer-based APIs based upon PGQL and Java graph APIs
- A parallel, in-memory graph server (PGX) for running graph queries and graph analytics
- A fast, scalable suite of social network analysis functions that include ranking, centrality, recommender, community detection, and path finding
- Parallel bulk load and export of property graph data in Oracle-defined flat files format
- A powerful Graph Visualization application
- Notebook support through integration with Jupyter
Parent topic: Introduction to Property Graphs
1.3 Overview of Property Graph Architecture
The property graph feature of Oracle Database supports the following architecture models.
- Architecture Model for Running Graph Queries in the Database
Using any of the supported client tools, you can directly interact with the graph data stored in the relational tables in the database. - Architecture Model for Running Graph Analytics
You can load your property graph into the graph server (PGX) in order to perform specialized graph computations. - Developing Applications Using Graph Server Functionality as a Library
The graph functions available with the graph server (PGX) can be used as a library in your application.
Parent topic: Introduction to Property Graphs
1.3.1 Architecture Model for Running Graph Queries in the Database
Using any of the supported client tools, you can directly interact with the graph data stored in the relational tables in the database.
This approach runs graph queries, as shown in the following figure.
Figure 1-2 Property Graph Architecture for Running Graph Queries
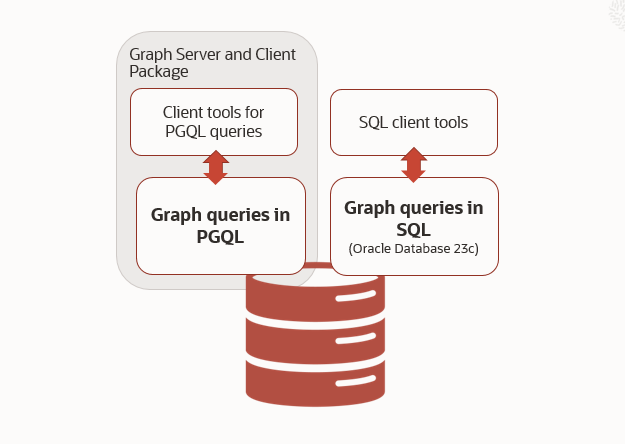
Description of "Figure 1-2 Property Graph Architecture for Running Graph Queries"
This model allows you to create a property graph using any one of the following supported options:
- Create a SQL property graph directly over existing database schema objects using SQL DDL statement. See SQL Property Graphs for more information.
- Create a property graph view directly over the graph data in the tables. See Property Graph Views for more information.
You can directly query the graphs, without loading the graphs into the graph
server (PGX), using PGQL. Additionally, you can also run graph pattern matching queries
on SQL property graphs using the GRAPH_TABLE operator. See SQL GRAPH_TABLE Queries for more information.
However, if you want to run graph analytics algorithms, then you must load this graph into the graph server (PGX). You can configure the graph server to periodically fetch data updates from the database to keep the graph synchronized. Note that loading the graph into the graph server (PGX) and performing graph synchronization operations are supported only for property graph views.
Parent topic: Overview of Property Graph Architecture
1.3.2 Architecture Model for Running Graph Analytics
You can load your property graph into the graph server (PGX) in order to perform specialized graph computations.
Figure 1-3 Property Graph Architecture for Running Graph Analytics
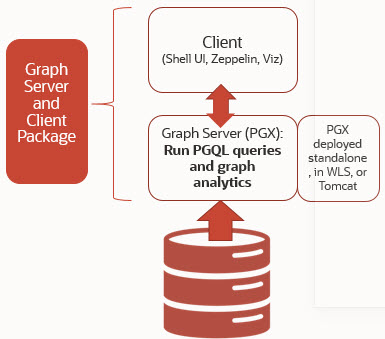
Description of "Figure 1-3 Property Graph Architecture for Running Graph Analytics"
As seen in the preceding architecture design, the graph server (PGX) is a mid-tier server that can run as a standalone, or in a container like Oracle WebLogic Server or Apache Tomcat. Using this approach, you can load your property graph into the graph server (PGX). This allows you to run graph queries and analytical operations in memory in the graph server.
The graph can be created directly from the relational tables, or loaded from a property graph view which stores the graph in the database. You can modify the graph in memory (insert, update, and delete vertices and edges, and create new properties for results of executing an algorithm). The graph server does not write the modifications back to the relational tables.
Property Graph Sizing Recommendations
You can compute the memory required by the graph server (PGX) by using this calculator, Graph Size Estimator.
For example, the following table shows the memory estimated by the calculator for the given input:
Table 1-1 Graph Size Estimator
| Number of vertices | Number of Edges | Properties per Vertex | Properties per Edge | Estimated graph size |
|---|---|---|---|---|
10M |
100M |
|
|
15 GB |
100M |
1B |
|
|
140 GB |
Note:
- Reading a graph into memory can take upto twice the amount of memory needed to represent it in memory. So when you calculate the memory required for running PGX it is recommended that you double the amount of memory of the estimated graph size.
- CPU Processors: The recommended number of CPU processors for a graph with 10M vertices and 100M edges is 2-4 processors, and up to 16 processors for more compute-intensive workloads. Increasing CPU processors will improve performance.
Parent topic: Overview of Property Graph Architecture
1.3.3 Developing Applications Using Graph Server Functionality as a Library
The graph functions available with the graph server (PGX) can be used as a library in your application.
After the rpm install of the graph server, all the jar files can be found in
/opt/oracle/graph/lib. In this case, the server installation and
the client user application are in the same machine.
For such use cases, development and testing can be done using the interactive Java shell or the Python shell in embedded (local) mode. This means a local PGX instance is created and runs in the same JVM as the client. If you start the shell without any parameters it will start a local PGX instance and run in embedded mode.
See Using the Graph Server (PGX) as a Library for more information to obtain reference to a local PGX instance.
Parent topic: Overview of Property Graph Architecture
1.4 Learn About the Graph Server (PGX)
The in-memory graph server layer enables you to analyze property graphs using parallel in-memory execution.
It provides over 60 analytic functions. Examples of the categories and specific functions include:
- Centrality - Degree Centrality, Eigenvector Centrality, PageRank, Betweenness Centrality, Closedness Centrality
- Component and Community - Strongly Connected Components (Tarjan's and Kosaraju's). Weakly Connected Components
- Twitter's Who-To-Follow, Label Propagation.
- Path Finding - Single source all destination (Bellman-Ford), Dijsktra's shortest path, Hop Distance (Breadth-first search)
- Community Evaluation - Coefficient (Triangle Counting), Conductance, Modularity, Adamic-Adar counter.
- Overview of the Graph Server (PGX)
The Graph Server (PGX) is an in-memory accelerator for fast, parallel graph query and analytics. The server uses light-weight in-memory data structures to enable fast execution of graph algorithms.
Parent topic: Introduction to Property Graphs
1.4.1 Overview of the Graph Server (PGX)
The Graph Server (PGX) is an in-memory accelerator for fast, parallel graph query and analytics. The server uses light-weight in-memory data structures to enable fast execution of graph algorithms.
There are multiple options to load a graph into the graph server either from Oracle Database or from files.
The graph server can be deployed standalone (it includes an embedded Apache Tomcat instance), or deployed in Oracle WebLogic Server or Apache Tomcat.
Parent topic: Learn About the Graph Server (PGX)
1.4.1.1 Design of the Graph Server (PGX)
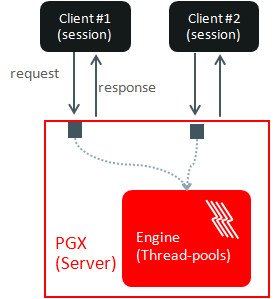
The design of the graph server (PGX) is based on a Server-Client usage model. See Usage Modes of the Graph Server (PGX) for more details on the different graph server (PGX) execution modes.
The following figure shows the graph server (PGX) design:
The core concepts of the graph server (PGX) design are as follows:
- Multiple graph clients can connect to the graph server at the same time.
- Each client request is processed by the graph server asynchronously. The client requests are queued up first and processed later, when resources are available. The client can poll the server to check if a request has been finished.
- Internally, the server maintains its own engine (thread pools) for running parallel graph algorithms and queries. The engine tries to process each analytics request concurrently with as many threads as possible.
Isolation Between Concurrent Clients
The graph server (PGX) supports data isolation between concurrent clients. Each client has its own private workspace, called session. Sessions are isolated from each other. Each client can load a graph instance into its own session, independently from other clients. Therefore, each client can load a graph instance (as well as its properties) into its own session, independently from other clients.
Parent topic: Overview of the Graph Server (PGX)
1.4.1.2 Usage Modes of the Graph Server (PGX)
This section presents an overview of the different usage modes of the graph server (PGX). The graph server can be executed in one of the following usage modes.
Remote Server Mode
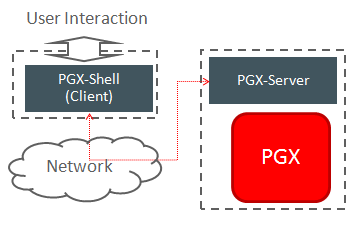
In the remote server mode, the main PGX execution engine is deployed as a RESTful application on a powerful server machine, and you can connect to it remotely from your machine using graph shell. Also, multiple clients can connect to the same graph server (PGX) at the same time and therefore the graph server is time-shared among these clients.
See Interactive Graph Shell CLIs for more information on the graph shell.
The following figure shows the graph server (PGX) in a remote execution mode:The remote server mode is useful for the following situations where you want to:
- Perform graph analysis on a large data set with a powerful server-class machine that has many cores and a large memory.
- The server-class machine is shared by multiple clients.
See Starting the Graph Server (PGX) for instructions on how to start the graph server (PGX) in remote server mode.
Using Graph Server (PGX) as a Library
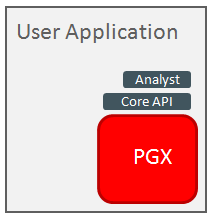
You can also include the graph server (PGX) as a normal Java library in your application.
The following figure shows the graph server (PGX) used as a library in an application:
The embedded mode is useful when you want to build an application having graph analysis as a part of its functionality.
See Using the Graph Server (PGX) as a Library for more information.
Deploying Graph Server (PGX) as Servlet Web Application
You can deploy the graph server (PGX) as a web application using Apache Tomcat or Oracle WebLogic Server.
See Deploying Oracle Graph Server to a Web Server for instructions to deploy the graph server (PGX) in Apache Tomcat or Oracle WebLogic Server.
Parent topic: Overview of the Graph Server (PGX)
1.5 Security Best Practices with Graph Data
Several security-related best practices apply when working with graph data.
Sensitive Information
Graph data can contain sensitive information and should therefore be treated with the same care as any other type of data. Oracle recommends the following considerations when using a graph product:
- Avoid storing sensitive information in your graph if that information is not required for analysis. If you have existing data, only model the relevant subset you need for analysis as a graph, either by applying a preprocessing step or by using subgraph and filtering techniques that are part of graph product.
- Model your graph in a way that vertex and edge identifiers are not considered sensitive information.
- Do not deploy the product into untrusted environments or in a way that gives access to untrusted client connections.
- Make sure all communication channels are encrypted and that authentication is always enabled, even if running within a trusted network.
Least Privilege Accounts
The database user account that is being used by the graph server (PGX) to read data should be a low-privilege, read-only account. PGX is an in-memory accelerator that acts as a read-only cache on top of the database, and it does not write any data back to the database.
If your application requires writing graph data and later analyzing it using PGX, make sure you use two different database user accounts for each component.
Public Health Endpoint Security
Unless you run multiple graph servers behind a load balancer (Deploying Oracle Graph Server Behind a Load Balancer), it is a good security practice to disable the public endpoint of the graph server, which load balancers need to determine the health of the graph servers.
To disable the endpoint:
- Locate the
WARfile of the graph server. If you installed the graph server via RPM, then the file is located at/opt/oracle/graph/pgx/server/pgx-webapp-<version>.war. - Unzip the
.warfile into a location of your choice and then edit theWEB-INF/web.xmlfile inside the unzipped directory with a text editor of your choice. - Locate the
pgx.auth.exceptionsparameter in the file. The list of public endpoints can be seen as shown:<init-param> <param-name>pgx.auth.exceptions</param-name> <param-value>isReady;isRunning;auth/token</param-value> </init-param> - Remove the
isReadyendpoint from the list of public endpoints as shown:<init-param> <param-name>pgx.auth.exceptions</param-name> <param-value>isRunning;auth/token</param-value> </init-param> - Save your changes, repackage the
WARfile and redeploy the file to its original location. - Restart the graph server.
Parent topic: Introduction to Property Graphs
1.6 About Oracle Graph Server and Client Accessibility
This section provides information on the accessibility features for Oracle Graph Server and Client.
- For information on addressing accessibility for the Java and Python command line interfaces, which are installed on Oracle Linux, see Working With Accessibility Features in Oracle Linux 7.
- For information on keyboard shortcuts for the Java command line interface, which is built on top of the Java Shell (JShell), see Keyboard Shortcuts for JShell.
- For information on addressing accessibility for the Graph Visualization Application, which is based on Oracle JET, see About Oracle JET and Accessibility.
- You can enable accessibility in the Graph Visualization application by
selecting the Accessibility Mode check box option from the user account
drop-down menu on the top-right of the user interface. Once enabled, the query
output is always displayed in a tabular layout as shown:
Figure 1-7 Enabling Accessibility in the Graph Visualization Application
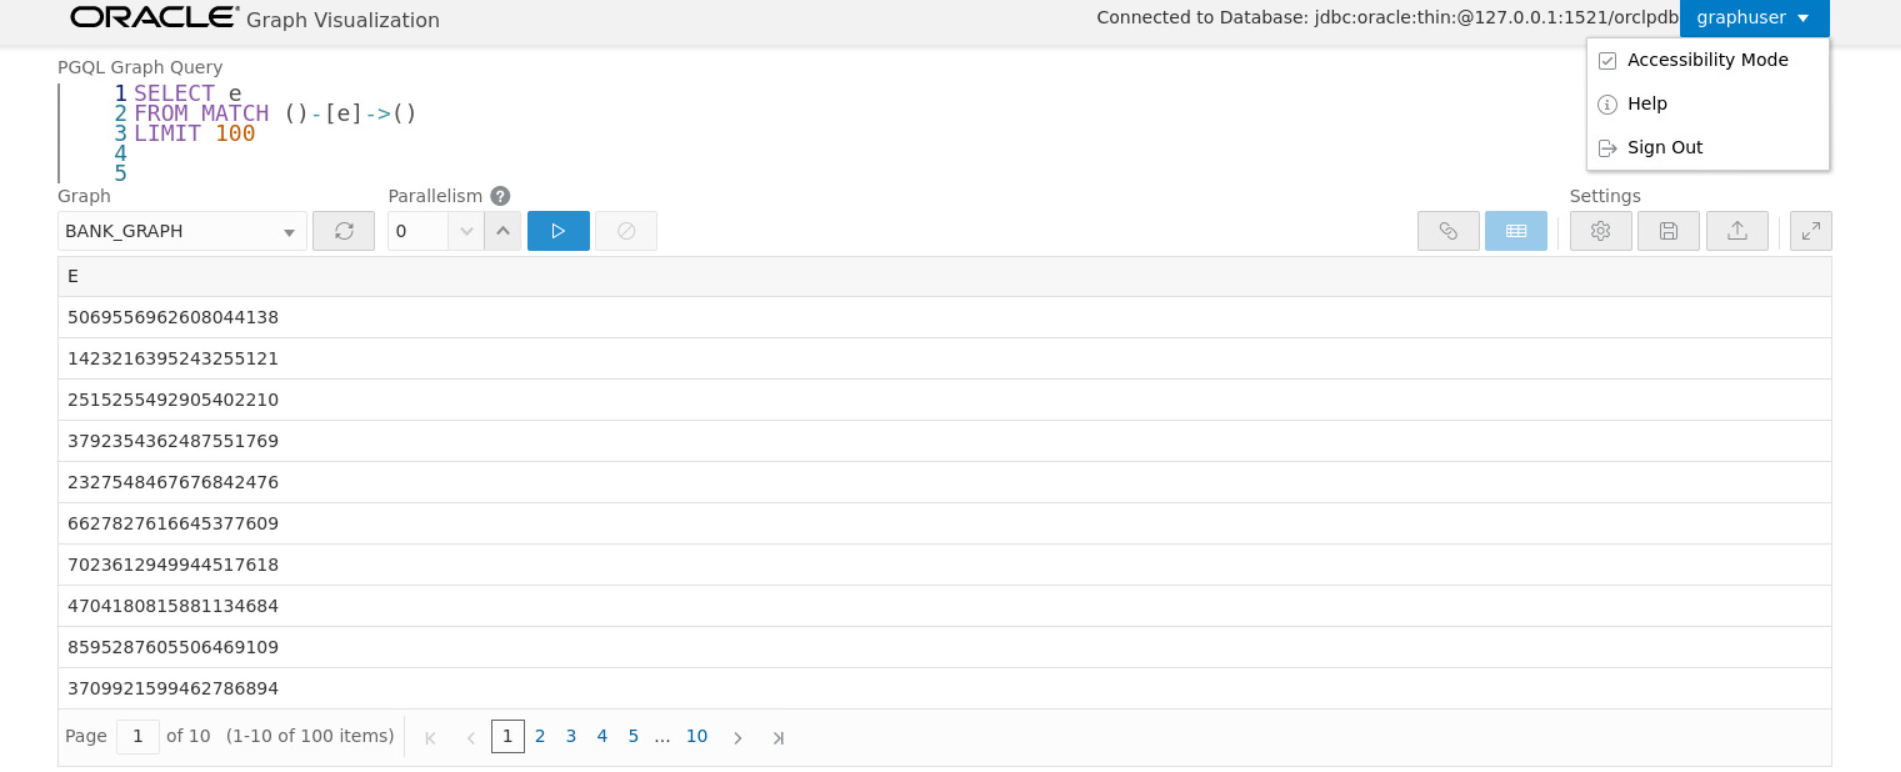
Description of "Figure 1-7 Enabling Accessibility in the Graph Visualization Application"
Parent topic: Introduction to Property Graphs
