8.3 Configure Attributes for the APEX Graph Visualization Plug-in

Learn how to customize your graph visualization using the Graph Visualization plug-in attributes in your APEX application.

You can configure the attributes for the plug-in component in the Attributes tab (Property Editor) on the right pane of the Page Designer.
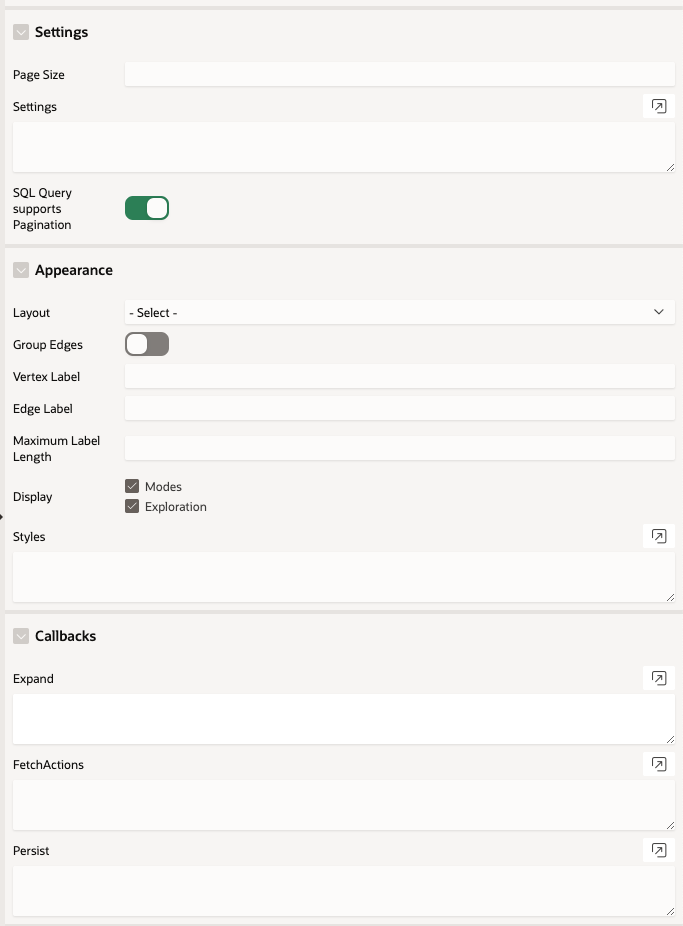
Description of apex_plugin_attr.png follows
Description of the illustration apex_plugin_attr.png

See the Interface page in Graph JavaScript API Reference for Property Graph Visualization which describes the interface mapping for the plugin attributes.

The attributes are grouped as per their scope in the following panels:

Settings

Attribute Description
Page Size Specify the number of vertices and edges to be displayed per page.
Settings Specify the graph settings in JSON format. See Settings for more information.
SQL Query supports Pagination Switch on this toggle if you are implementing the paginate interface.

Appearance

Attribute Description
Layout Specify the graph layout.
Group Edges Switch on this toggle to group edges.
Vertex Label Specify the property to be used for the vertex label.
Edge Label Specify the property to be used for the edge label.
Maximum Label Length Specify the maximum length of the label.
Display Modes Select this checkbox to display the modes panel with the following options:
  • Select:
  • Fit to Screen
  • Toggles Sticky Mode
Display Exploration Select this checkbox to display the following graph exploration actions:
  • Drop - Delete selected vertices
  • Group - Group selected vertices
  • Ungroup - Ungroup selected vertices
  • Undo last action
  • Redo last action
  • Reset the visualization to its default state
Styles Specify the styles configuration in JSON format. See Styles for more information.

Callbacks

Attribute Description
Expand To expand a selected vertex in the graph visualization, see Expand for more information.
FetchActions To retrieve the graph actions from a data source, refer to fetchActions for more information.
Persist To persist the graph actions to a data source, refer to persist for more information.

8.3.1 Settings

You can apply different graph settings such as switching layouts, grouping edges, or showing the evolution of the graph entities based on a property using the Settings attribute in the Property Editor of the Page Designer.

  1. Select the graph visualization component in the Rendering tab on the left pane of the Page Designer.
  2. Select Attributes in the Property Editor on the right pane of the Page Designer.
  3. Enter the input for the desired action in JSON format in the Settings input box in the Settings panel.
    See settings in Oracle Graph JavaScript API Reference for Property Graph Visualization for more information on the Settings interface.

    For instance, the following JSON example provides the layout and pageSize configurations:

    { 
    "pageSize": 10,
    "layout": "concentric"
    }

    Note:

    If the JSON input contains the settings for properties that are already set in the Appearance panel (such as Layout or Group Edges) or Settings panel (Page Size), then the property values that are provided directly will override the JSON values.

    The following JSON example shows a sample configuration for adding network evolution to the graph visualization. The evolution of the graph data is based on the HireDate property:

    {
        "evolution": {
            "chart": "line",
            "unit": "year",
            "vertex": "properties.HireDate"
        }
    }

8.3.2 Styles

You can style a graph using the Styles attribute in the Property Editor of the Page Designer.
  1. Select the graph visualization component in the Rendering tab on the left pane of the Page Designer.
  2. Select Attributes in the Property Editor on the right pane of the Page Designer.
  3. Enter the input for styling in JSON format in the Styles input box.
    See styles in Oracle Graph JavaScript API Reference for Property Graph Visualization for more information on the Style interface.

    The following example shows the JSON input to add a vertex style.

    {
       "vertex":{
          "size":12,
          "label":"${properties.FirstName} ${properties.LastName}",
          "color":"#d5445a",
          "icon":"fa-user"
        }
    }

    Note:

    If the JSON input contains styling for properties that are already set in the Appearance panel (such as Vertex Label, Edge Label, or Maximum Label Length), then the property values that are provided directly will override the JSON values.

8.3.3 Expand

You can expand a selected vertex in the graph and fetch the adjacent vertices using the Expand attribute in the Property Editor of the Page Designer.

  1. Switch to the Processing tab on the left pane of the Page Designer and navigate to the After Submit node.
  2. Right-click and select Create Process from the context menu.
  3. Enter the process Name.
  4. Specify Type as Execute Code.
  5. Select the source Location as Local Database.
  6. Select the source Language as PL/SQL and enter the following code in the PL/SQL input box.
    DECLARE data clob;
        id VARCHAR2(100) := apex_application.g_x01;
        graph VARCHAR2(100) := '<graph_name>';
        hops NUMBER := <no_of_hops>;
        n NUMBER := hops - 1;
        match_clause VARCHAR2(100);
        query VARCHAR2(1000);
    
    BEGIN
        IF n = 0 THEN
            match_clause := ' MATCH (x) -[e]-> (z) ';
        ELSE
            match_clause := ' MATCH (x) ->{,' || n || '} (y) -[e]-> (z) ';
        END IF;
    
        query := 'SELECT id_x, id_e, id_z
                  FROM GRAPH_TABLE (' || graph ||  match_clause  || 
                  'WHERE JSON_value(vertex_id(x), ''$.ELEM_TABLE'') || json_query(vertex_id(x), ''$.KEY_VALUE'' returning varchar2) = '''|| id ||'''
                  COLUMNS (vertex_id(x) as id_x, edge_id(e) as id_e, vertex_id(z) as id_z))';
        SELECT <helper_function>(query) INTO data FROM sys.dual;
        htp.p(data);
    END;

    In the preceding code:

    • <graph_name>: Name of the graph
    • <hops>: Number of hops to be expanded
    • <helper_function>: Name of the function that provides the CURSOR for the SQL graph query as input to the ORA_SQLGRAPH_TO_JSON function and obtains the JSON output for visualization.
    Note that the process takes the vertex id to be expanded as input and returns the resulting output as JSON.
  7. Select the execution Point as Ajax Callback.
  8. Switch to the Rendering tab on the left pane of the Page Designer and select the graph visualization component.
  9. Switch to the Attributes tab on the right pane and enter the following code in the Expand input box in the Callbacks panel.
    const data = await apex.server.process('<process_name>', {
        x01: ids[0]
    }, { dataType: 'text' });
    try {
        return JSON.parse(data);
    } catch (error) {
        return [];
    }

    In the preceding code, <process_name> refers to the name of process that was provided at step-3.

  10. Click Save.
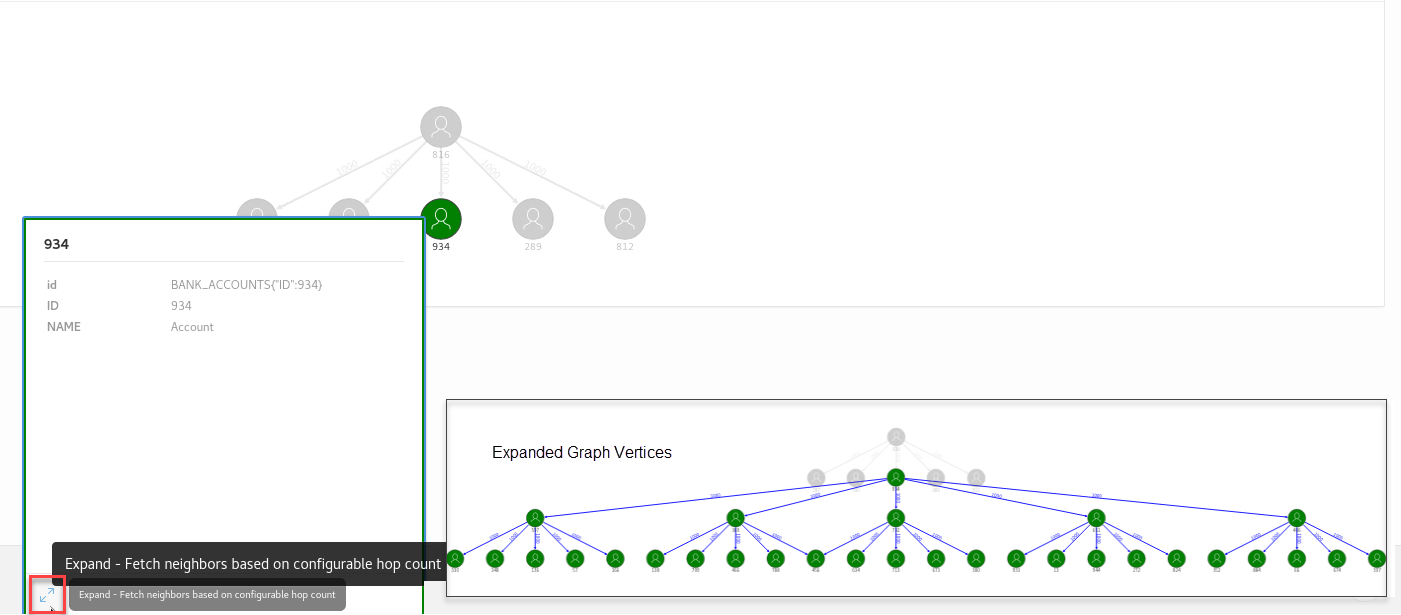
  11. Run the application page and you can now click expand (as shown highlighted in the following figure) on any specific vertex in the graph.

    Figure 8-3 Expanding on a Specific Graph Vertex

    Description of Figure 8-3 follows
    Description of "Figure 8-3 Expanding on a Specific Graph Vertex"

    The inset image in the preceding figure shows the graph with expanded vertices as rendered by the plug-in.