Query Visualization Settings
You can configure settings for you graph visualization by clicking the Settings gear icon in the Query Visualization tab.
The Visualization Settings slider contains the following four tabs:
General Tab
The General tab contains the following configurations:
Figure: General Tab
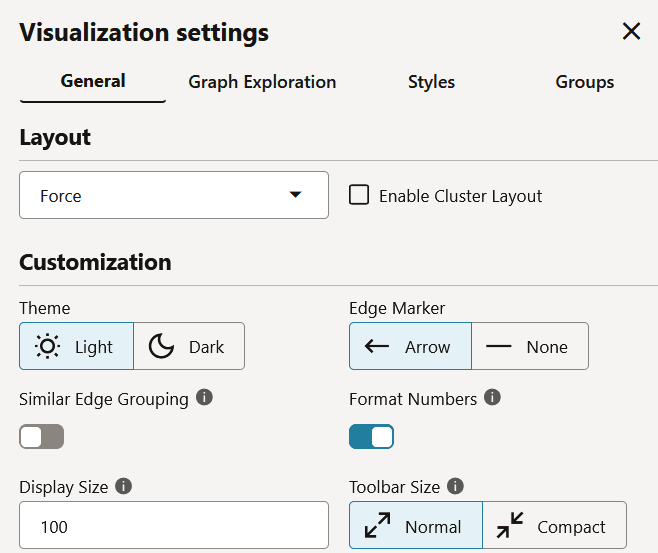
Description of the illustration query_viz_general_tab.png
Table: General Tab Attributes
| Attribute | Description |
|---|---|
| Layout | Supported layouts are: Circle, Concentric, Force (default), Grid, Hierarchical, Preset, Radial, Random, and Geographical. The Force layout also supports a clustering option, which allows you to visualize a graph with clustered vertices. See Layouts in Property Graph Visualization Developer's Guide and Reference for more information. |
| Theme | Supported themes are:
|
| Edge Marker | Supported edge markers are:
|
| Similar Edge Grouping | When this option is enabled, multiple edges between the same source and target vertices are grouped in the graph. Grouped edges appear as a single edge labeled with a number indicating how many edges were grouped.<p>For example, the following image shows two graph visualizations side by side in Graph Explorer. The visualization on the left displays multiple edges from the source vertex (ID=816) to the destination vertices (ID=287 and ID=289). The visualization on the right shows edges with the same source and target vertex IDs grouped together because Similar Edge Grouping is enabled in the visualization settings. </p>Figure: Grouping Similar Edges {: #GUID-1F5C5D34-391B-443C-84BD-56D154CC4B1A__FIG_TMV_FR4_S3C .titleinfigure} 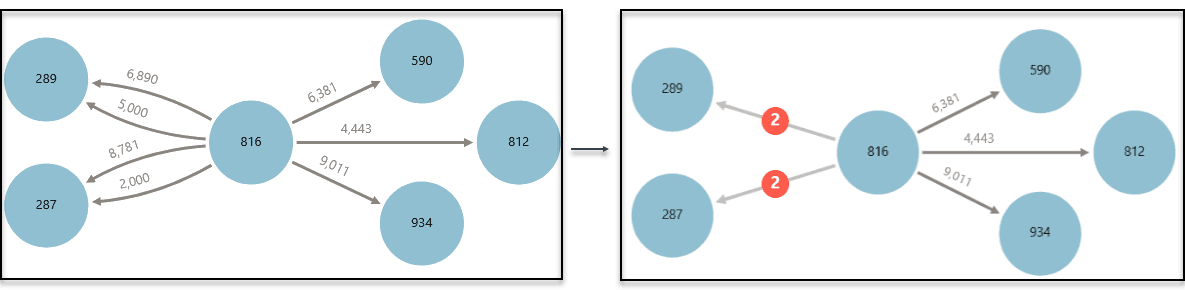 |
| Format Numbers | By default, this option is enabled so that numbers are displayed according to your regional or language settings, such as decimal and grouping separators. |
| Display Size | Determines the number of graph elements to be visualized on a page from the result set. |
| Toolbar Size | Determines the size of the buttons and search box placed in the toolbar. |
Graph Exploration Tab
Figure: Graph Exploration
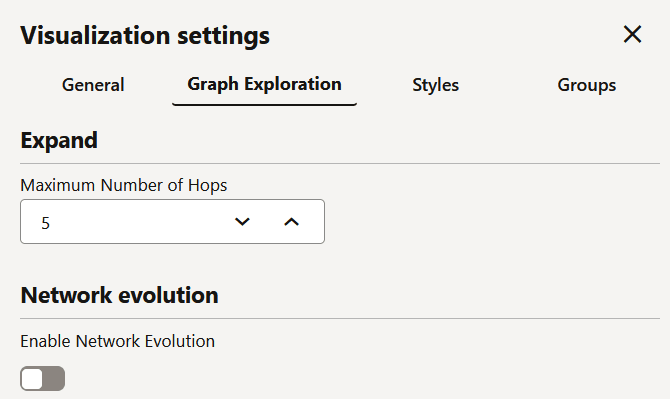
Description of the illustration query_viz_graph_explorer_tab.png
The Graph Exploration tab supports the following configurations:
-
You can configure the hop count when expanding one or more selected vertices using the Maximum Number of Hops drop-down in the Expand section.
-
You can enable and configure Network Evolution in the Graph Exploration tab in Visualization Settings. See Using Network Evolution in Graph Visualization for more information.
Styles Tab
You can configure and manage vertex and edge styles to customize the appearance of vertices and edges in the graph. The Styles tab in Visualization Settings displays both the default and custom vertex and edge styles.
You can perform the following actions in this tab:
-
Add a new custom vertex style.
-
Add a new custom edge style.
-
Edit the default styling of a vertex or an edge element.
-
Edit or delete the custom styling of a vertex or an edge element.
-
Restore the default style settings. Figure: Styles Tab
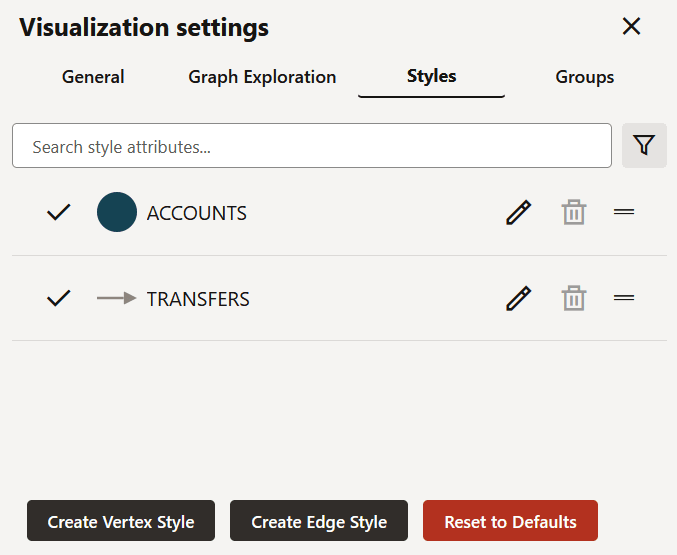
Description of the illustration query_viz_styles_tab.png
Adding a new custom style for a vertex or an edge
To add a new vertex or an edge style, click Create Vertex Style or Create Edge Style as required. The following shows the screenshot for configuring a new vertex style.
Figure: Adding a new Vertex Style
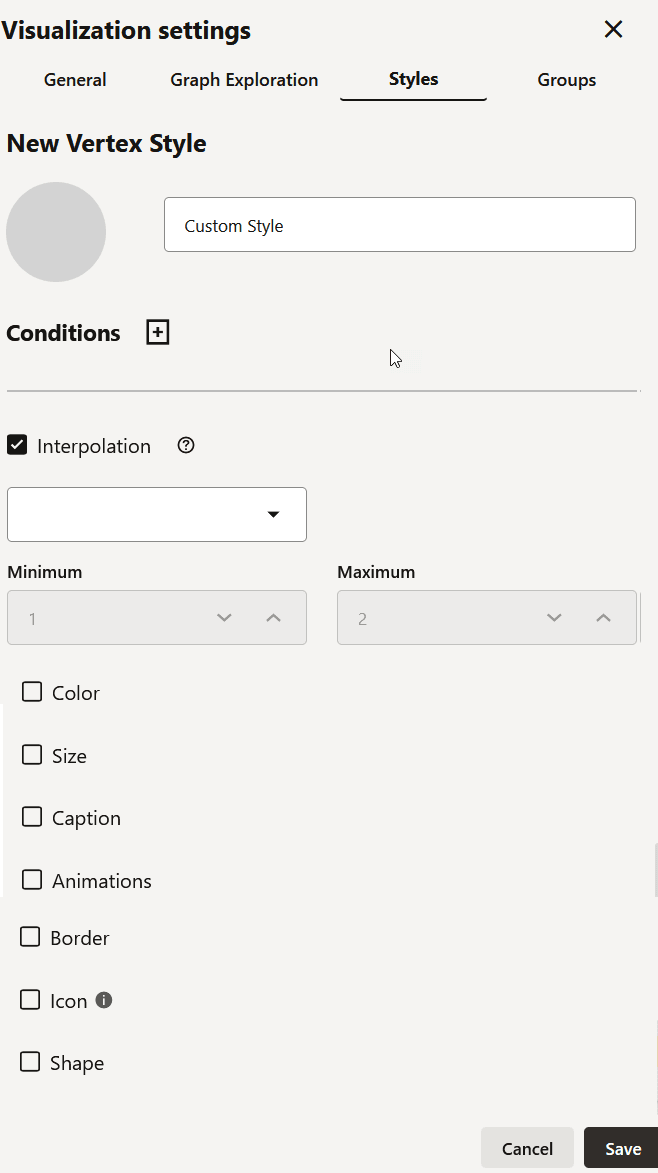
Description of the illustration custom_vertex_style.png
You can configure the following values as appropriate:
-
Name: Name of the style
-
Conditions: Click + to add a condition for an element (vertex or edge) and provide the following values:
-
Property of the vertex or edge element.
-
Operator to be applied. The following operators are supported:
-
=(equal to) -
<(less than) -
<=(less than or equal to) -
>(greater than) -
>=(greater than or equal to) -
!=(not equal to) -
~(filter is a regular expression) -
CONTAINS(applies for labels only) -
CONTAINS_REGEX(applies for labels only)
Also, note the changes in the behavior of the following operator groups:
-
Equality operators (
=,!=):-
When applied on a property that holds a string array value and a condition that holds a simple string, text matching will be performed based on equality instead of contains.
CONTAINSoperator can be used for checking if the simple string is a substring of the property string value. -
When applied on a property that holds a number value and a condition that holds a non-numeric string, text matching will yield an empty result.
-
When applied on a property that holds a boolean value and a condition that holds a non-boolean string, text matching will yield an empty result.
-
-
Comparison operators (
>,>=,<,<=): When applied on a property that holds a string array value and a condition that holds a simple string, text comparison will yield an empty result. -
Regex operator (
~):-
When applied on a property that holds a string array value and a condition that holds a simple string, text matching will yield an empty result. Instead, you can use the
CONTAINS_REGEXoperator. -
When applied on a property that holds a number value and a condition that holds a simple string, text matching will yield an empty result.
-
When applied on a property that holds a boolean value and a condition that holds a simple string, text matching will yield an empty result.
-
-
-
Value that needs to be fulfilled for the property and the operator
You can add as many conditions as required. For all elements that meet the conditions, you can configure any of the following styling highlights:
- Interpolation: Configure interpolation based on the size or color of the vertices or edges. Interpolation will be applied proportionally, between the Minimum and Maximum values. The following figure shows linear color interpolation based on the
AMOUNTproperty between the minimum (4000) and maximum (10000) values. Figure: Interpolation in Graph Visualization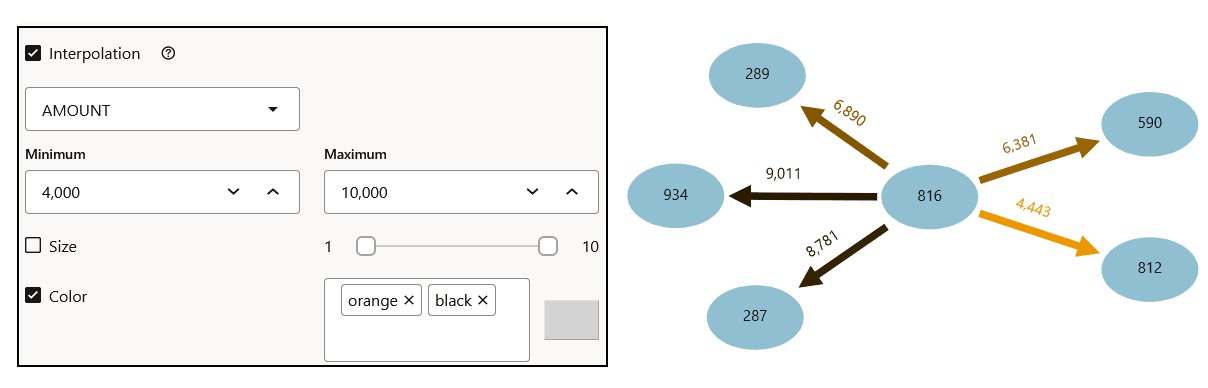
-
Color: Specify the color of the vertex or edge.
-
Size: Specify the size of the vertex or edge.
-
Caption: Specify the caption for the vertex or edge. You can also configure the caption font size, color, orientation, and maximum length.
-
Animations: Specify the animation type, such as Pulsating or Flashing, and the duration of the animation cycle.
-
Border: Specify the border color and width of the displayed vertex. This option does not apply for edges.
-
Icon: Specify an image for the vertex. This option does not apply for edges. Click the information icon to get the link to the icon library.
- Shape: Specify the shape of the vertex. Supported values are Circle, Ellipse Square, Rectangle, Triangle, Diamond, Pentagon, Hexagon, and Octagon. This option does not apply to edges.
-
Groups Tab
You can configure rule-based groups in the Groups tab to organize vertices and edges according to specific conditions. You can also include aggregated data within these groups.
Figure: Groups Tab
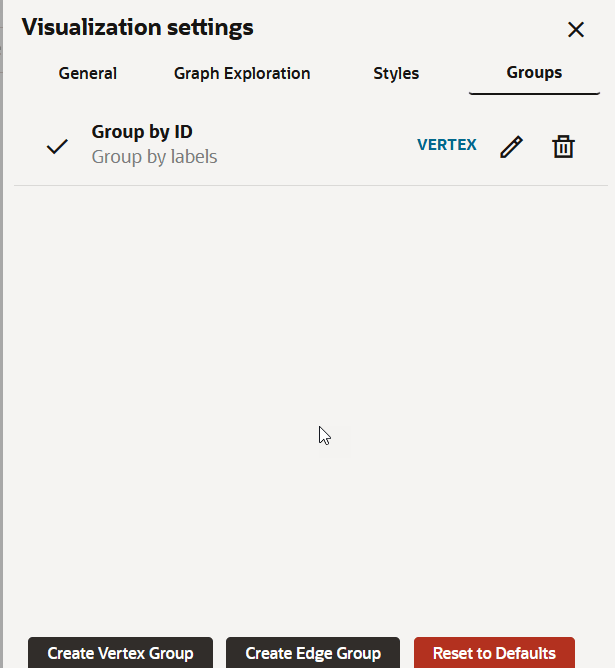
Description of the illustration explorer_groups_tab.png
To add a new vertex or edge group, click New Vertex Group or New Edge Group as required and configure the following values:
-
Name: Name of the group.
-
Property to group by (optional): Property to group elements by. If specified, then one group per each available value of the specified property from all vertices or edges fulfilling the given conditions is created. Otherwise, the grouping results in just one group containing all allowable vertices or edges.
-
Apply group on load: Switch ON this toggle if you wish the grouping to be automatically applied each time the graph is loaded.
-
Conditions: Click + Add more to define one or more conditions that determine which vertices or edges are included in the group. For each condition, specify:
-
Property of the vertex or edge element.
-
Operator to be applied. The following operators are supported:
-
=(equal to) -
<(less than) -
<=(less than or equal to) -
>(greater than) -
>=(greater than or equal to) -
!=(not equal to) -
~(filter is a regular expression)
-
-
Value that needs to be fulfilled for the property and the operator
-
-
Aggregations: Click + Add aggregation to define aggregated properties for the group. For each aggregation, specify:
-
Property: The property to aggregate.
-
Aggregation: The aggregation function to apply. Supported values are:
average,min,max,sum,countanddistinctCount.
-
-
Click Save.
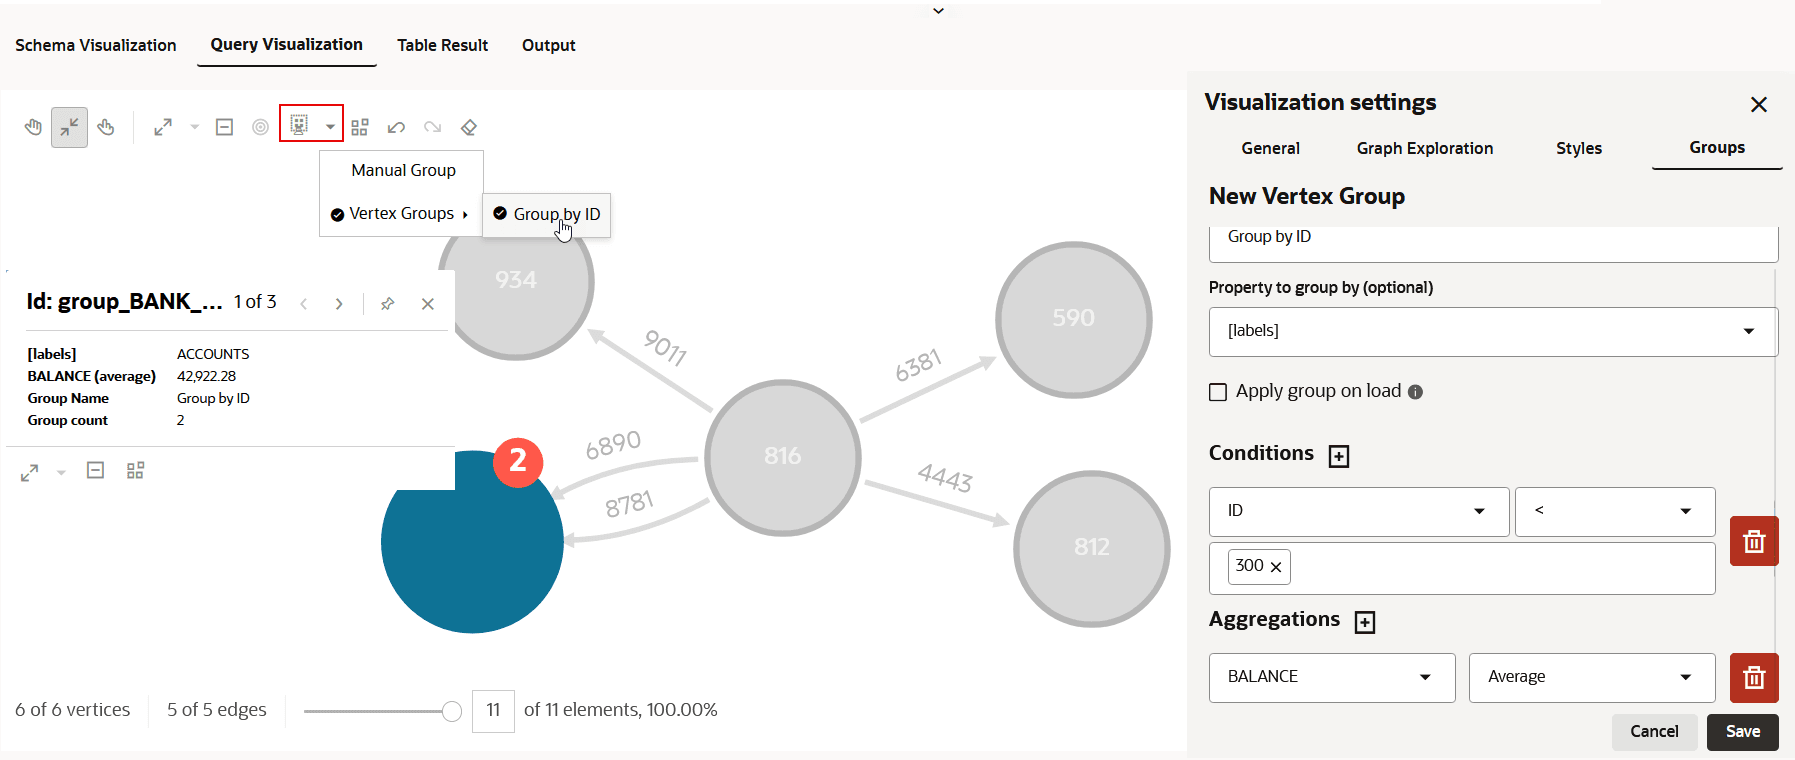
The following example shows the configuration of a vertex group. The configuration creates one grouped vertex for each vertex label, considering only vertices with ID < 300, and calculates the average aggregation of the BALANCE property in each group.
If the grouping is configured to be automatically applied during graph loading, then the conditional grouping is applied on the whole graph displayed in the visualization panel.
Otherwise, you can apply the predefined group as shown:
-
Click the Select Group Option list in the graph visualization toolbar.
-
Select the group name.
Figure: Rule-based Grouping
Description of the illustration explorer_rule_based_groups.png
In the preceding visualization, the grouping criterion is
ID < 300. All vertices whose ID is less than300are combined into a single grouped vertex. The tooltip shows the group count and the aggregated property value.