3.10.8 Configuring a Map Visualization
Learn how to configure the settings for your map visualization.
You can configure the map visualization settings, by clicking  , the Settings icon in the map tool bar.
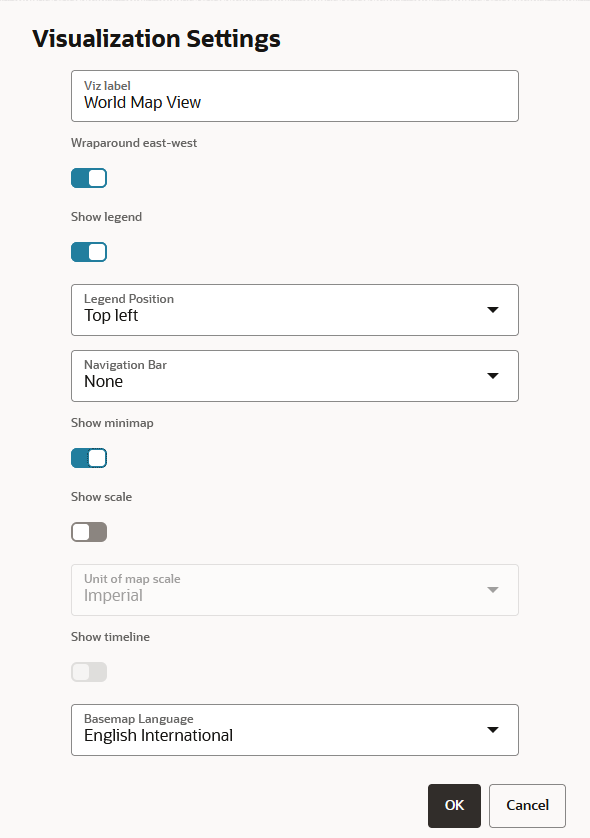
The Visualization Settings dialog opens with the default configuration values as shown as shown:
Spatial Studio supports the configuration of the following values:
- Viz label: You can define the label for your map visualization.
- Wraparound east-west: By default, the map is continuous, that is, the map displayed for visualization is east-west wrap around. You can choose to disable this option if you prefer to display the map in a non-repeating mode.
- Show legend: The legend displays the map layers that are used in the visualization.
- Legend Position: This determines where the legend gets displayed on the map.
- Navigation Bar: This displays zoom and compass controls on the map.
- Show minimap: You can enable this option if you want to view an overview of the main map as an inset within the main map.
- Show scale: You can enable this option if you want to configure a specific scale for the map.
- Unit of map scale: Supported scale types are:
- Imperial
- Metric
- Nautical
- Show timeline: By enabling the slider, you can display the time slider on the map.
- Basemap Language: This option appears only if you are using one of the three built-in MapTiler vector basemaps as a map background. You can then set the language for your basemap.
Parent topic: Visualization in Oracle Spatial Studio
