- Guide
- Using Oracle Spatial Studio
- Visualization in Oracle Spatial Studio
- Using a Map Visualization
- About Custom Map Regions Visualization
- Creating Custom Regions for Visualization
3.10.2.4.1 Creating Custom Regions for Visualization
You can create custom polygon regions on the source dataset that
contains polygon type geometries and apply them on a target dataset using the follow
steps:
The instructions assume that the source and target datasets are already
added to your Project in the ActiveProject page.
- Click the Visualizations tab on the left pane in the Active Project
page.This lists the various visualization options.
- Click and drag Map from the list to the visualization window on the
right to create a map visualization.A default base map is displayed with no data visualization layers.
- Click the Data tab on the left pane in the Active Project page.This lists all the Datasets that are loaded for the project.
- Click and drag the desired source dataset from the list to the map view
on the right.A map layer with polygon shapes is created.
- Create the required custom regions by performing the following steps as many
times as required:
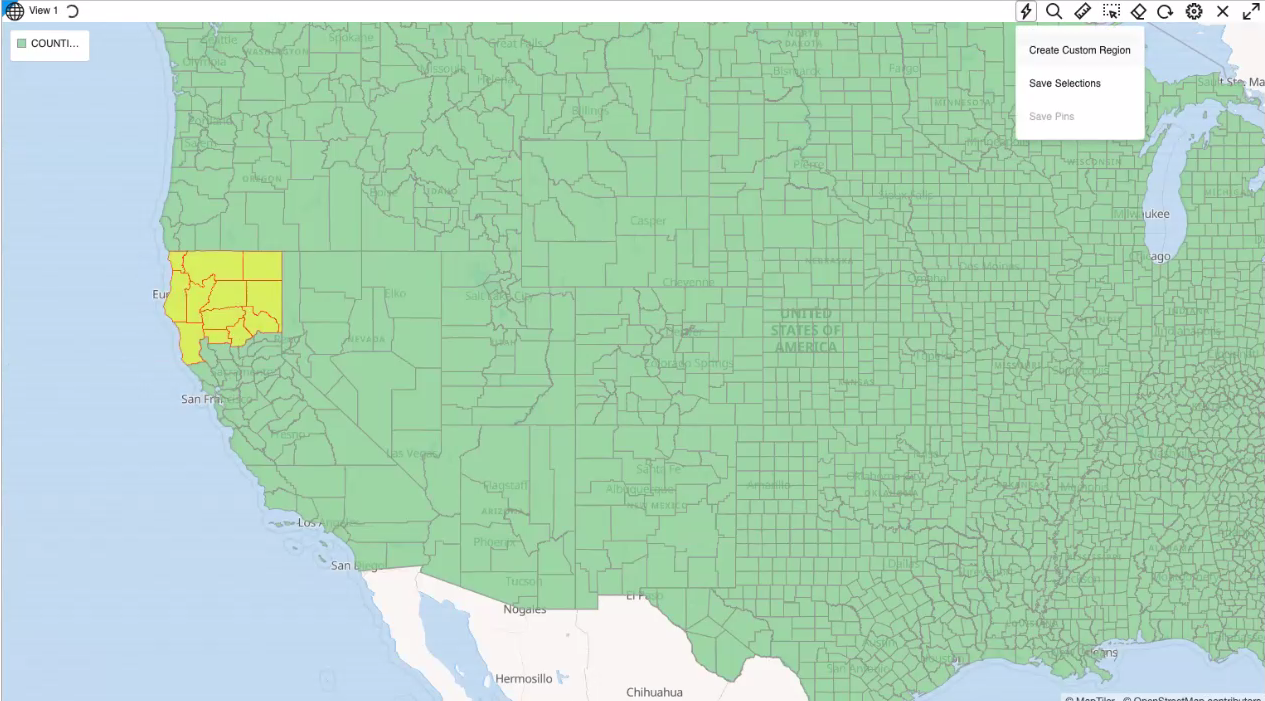
- Select the regions for aggregation using the polygon selection tool in
the map tool bar.
Tip:
Alternatively, you can also select multiple polygons by using the keyboard shortcutCtrl + Clickon a Windows system. - Click
 , Actions icon on the map tool bar and
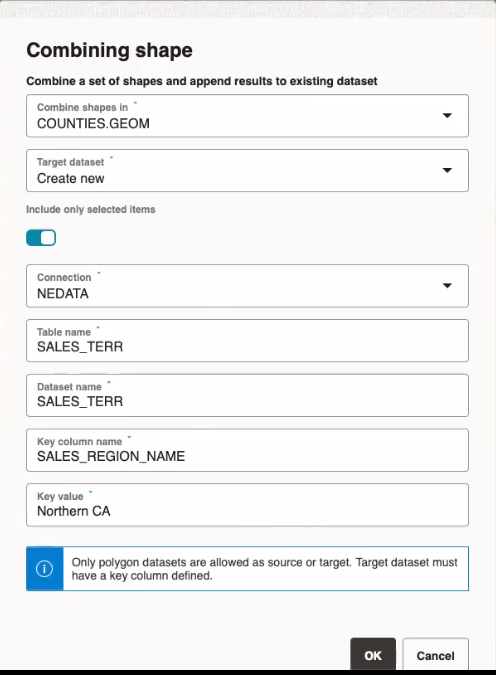
select Create Custom Region.Combining shape dialog opens as shown:
 - Select the source dataset from the Combine shapes in drop-down list.
- Select one of the following desired options for Target
dataset:
- Create new: To create a new target
dataset:
- Enter Connection, Table name, and Dataset name details for the new target dataset.
- Enter the Key column name and the Key value that uniquely identifies the custom map region.
- Append to existing: To
append the custom polygon shapes to an existing target
dataset:
- Select an existing target dataset from the Append result to dataset drop-down list.
- Click Enter new shape attributes and enter a unique key value for the Key column name of the target dataset.
- Create new: To create a new target
dataset:
- Optionally, switch on or off the Include only selected items
toggle button:
Caution:
The whole source dataset may be aggregated into one region if Include only selected items is switched off. In this case the process may run for a long time depending on the number of features in the source dataset. Therefore, use this option only if required. - Click OK to create the custom map region.
- Select the regions for aggregation using the polygon selection tool in
the map tool bar.
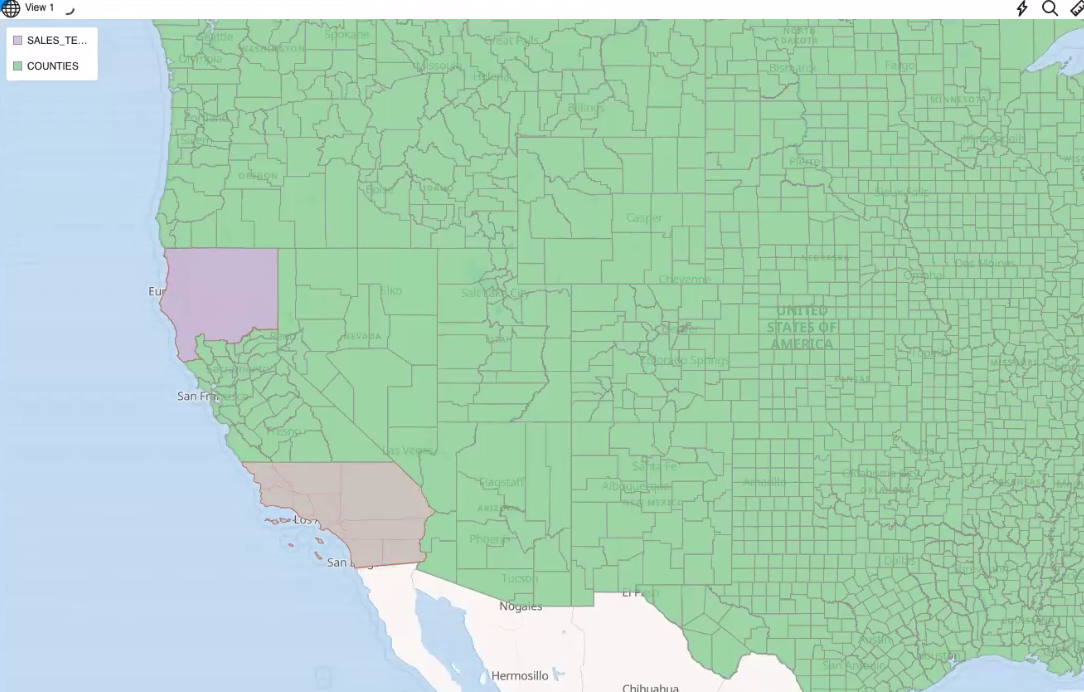
- Drag and drop the target dataset to the map view on the right to view
the newly created custom regions.The following figure shows the newly defined custom regions that were inserted into the target dataset.
Figure 3-51 Displaying the Custom Shapes on the Target Dataset

Description of "Figure 3-51 Displaying the Custom Shapes on the Target Dataset"
Parent topic: About Custom Map Regions Visualization

