3.10.2.5.1 Enabling Spatiotemporal for a Dataset
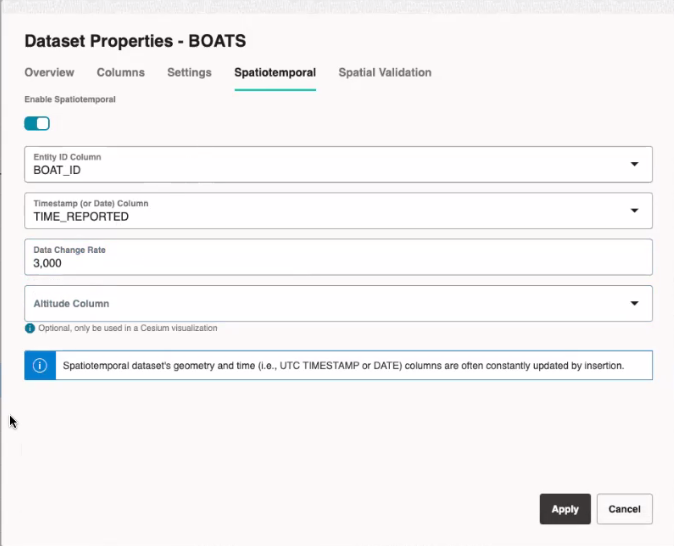
In order to visualize and animate moving objects, you must enable Spatiotemporal for the dataset containing spatiotemporal data on the Datasets page.
Spatial Studio considers a dataset to
contain spatiotemporal data only if it meets the following requirements:
- It must be based on a geometry table or view with a geometry column or pair of latitude/longitude columns.
- There must be one or more “moving objects” or entities uniquely identified by one of the columns.
- There must be a column of the type
TIMESTAMP, that stores the UTC datetime of the entities as they are being observed and recorded. Alternatively, date-type columns are also supported. - The dataset's underlying table or view must have ongoing inserts with recently obtained location data of entities being observed or monitored.
You can perform the following steps to enable spatiotemporal for a dataset. The instructions assume that the dataset containing spatiotemporal data is already existing in your database schema.
Your dataset is now enabled for spatiotemporal data visualization.
Parent topic: Visualizing a Moving Object
