3.10.6 Visualizing Map Data Over Time
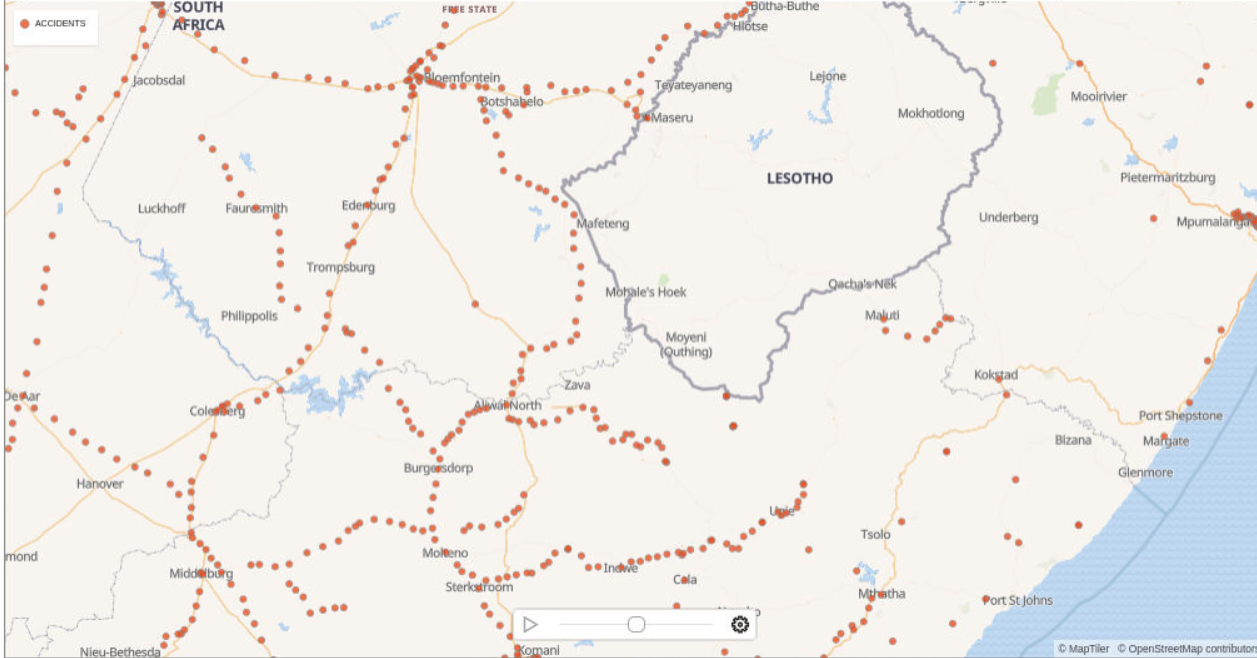
Spatial Studio allows you to perform dynamic map visualizations.
In order to visualize map data over time, your dataset must contain a date
column or a time column or both. You can then use the time slider feature to interact
with the map.
Note:
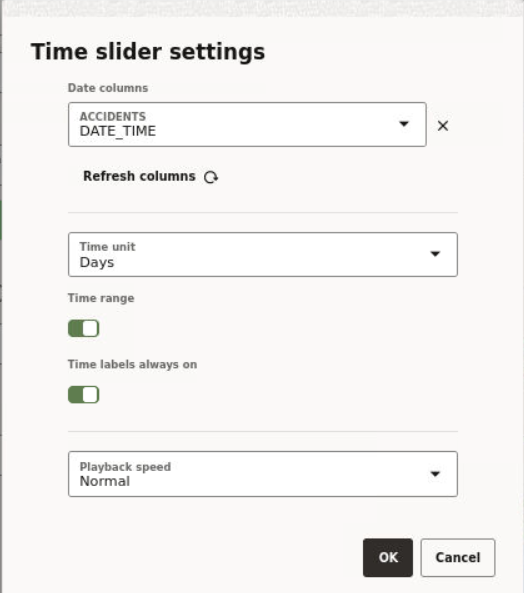
The time slider is applicable only for datasets containing event points or simple shapes over time, such as earthquakes or storm paths. It does not apply for datasets containing a fixed set of shapes with attributes varying over time, such as countries with population.The following steps allow you to configure and use a time slider for your map visualization.
The instructions assume that you have a project linked to a dataset containing
date or time data and the project is opened on your Active Project page.
Parent topic: Visualization in Oracle Spatial Studio

