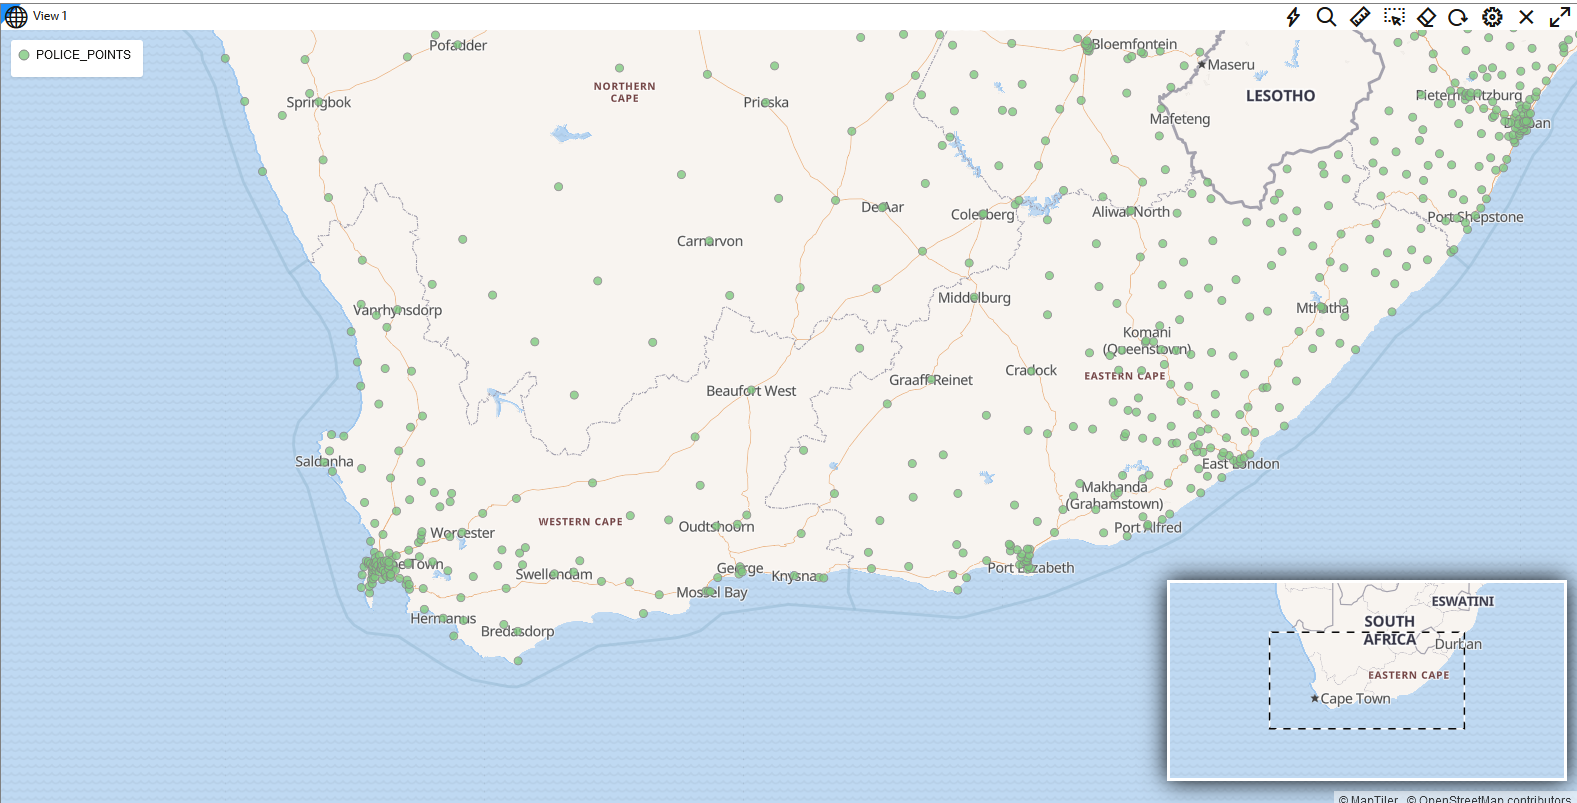
3.10.2.1 Visualizing a Point Map

Spatial Studio allows you to visualize the location of geographic data as points on maps.
To display your geographic data as maps, you must perform the following steps.
The instructions assume that the dataset for visualization is already added to the project in the Active Project page.
  1. Click the Visualizations tab on the left pane in the Active Project page.
    This lists the various visualization options.
  2. Click and drag Map from the list to the visualization window on the right to create a map visualization.
    A default base map is displayed with no data visualization layers.
  3. Click the Data tab on the left pane in the Active Project page.
    This lists all the Datasets that are loaded for the project.
  4. Click and drag the desired dataset from the list to the map view on the right.

    Tip:

    You can drag and drop multiple datasets in a single action to your map view.
    The map layer displays the data points for visualization.
  5. Optionally, you can click Settings in the map tool bar and enable Show minimap in the Visualization Settings dialog.

    An inset map showing the overview of the main map is displayed as shown in the preceding figure.

    See Also:

    Applying a Render Style For a Point Layer to render your map using different rendering styles.