3.2 Working with JSON-Relational Duality Views

A JSON-relational duality view exposes data stored in relational database tables as JSON documents. These documents are generated on demand. Duality views organize your data both relationally and hierarchically. This means that applications can access (create, query, modify) the same data as a set of JSON documents or as a set of related tables and columns, and both approaches can be employed at the same time.

For more information about JSON- Relational Duality Views, see Oracle® Database JSON-Relational Duality Developer's Guide.

In the SQL Developer extension for VS Code, Duality View is treated as an object type and is available as a separate node in the Connections panel. The tasks that you can perform are:

  • Create a duality view using the Duality View Builder.
  • Edit a duality view.
  • Insert a data record in a duality view.
  • Edit a data record in a duality view.
  • Display the JSON Data Guide Diagram for a duality view.

3.2.1 Create a Duality View

You can use the Duality View Builder to create a duality view.

Note:

The tables used to define a duality view must satisfy certain requirements. If these requirements are not met, an error is raised when you try to create the view.

Also, see Restrictions for JSON-Relational Duality Views.

  1. In the Connections panel, right-click the Duality Views node and select Duality View Builder.

    The Duality View Builder interface appears. It consists of three parts: the diagram panel, the preview panel, and the definition panel. Enter a name for the duality view in the Name field on top, and click Save to File to save and continue working at a later time.

Diagram Panel

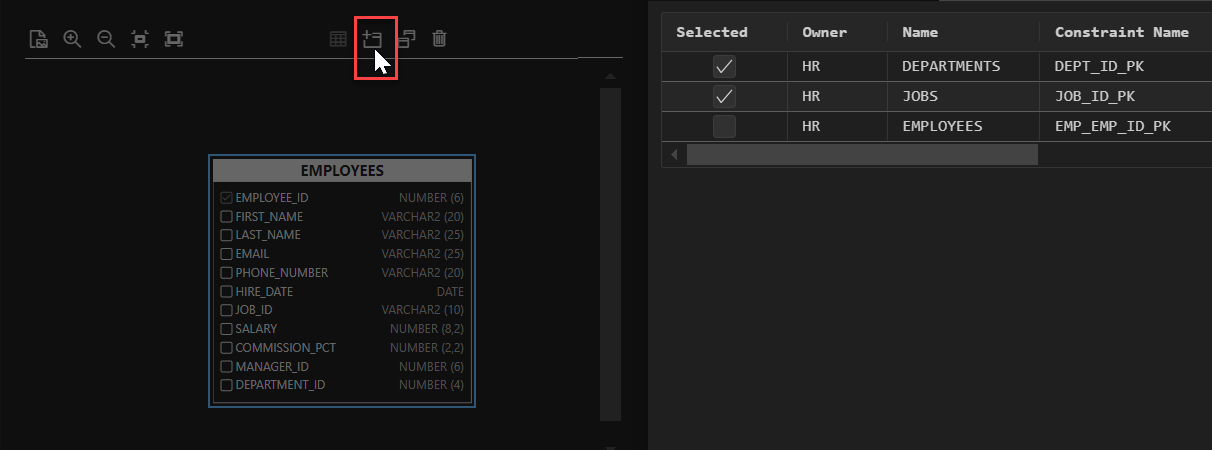
  1. From the toolbar, select Add Root Table. In the following figure, the table Employees is selected.
    Select root table
  2. In the Select Root Table pane, select the checkbox for the root table that you want, and click Apply.

    The selected table appears in the diagram pane. You can zoom in and zoom out and export to SVG format using the icons in the toolbar.

  3. You can now select Parent and Child Tables. Select the table in the diagram (when selected, a blue border appears around the table) and from the toolbar, and select Add Parent Table(s). Following this, if you want to add child tables, select the parent table and select Add Child Table(s) from the toolbar.

    In the following figure, Departments and Jobs are selected as parent tables.

    Select parent tables

Preview Panel

  1. You can select additional columns for the table by selecting the appropriate checkbox in the diagram panel. As you select, these changes instantly appear in the preview panel. Select an object in the preview panel to set additional properties such as Alias, Nested Key Name, Allow Update, Allow Insert, Allow Delete, Check, and Filter.

    In the following figure, the First_Name column is selected in the diagram panel and it immediately appears in the preview panel. Select First_Name in the preview panel to set additional properties such as Nested Key Name, Check and Allow Update.

    Preview panel

Definition Panel

  1. In the Definition tab, the duality view definition is automatically generated in GraphQL format. If GraphQL is not selected, then the definition is displayed in SQL statement format.
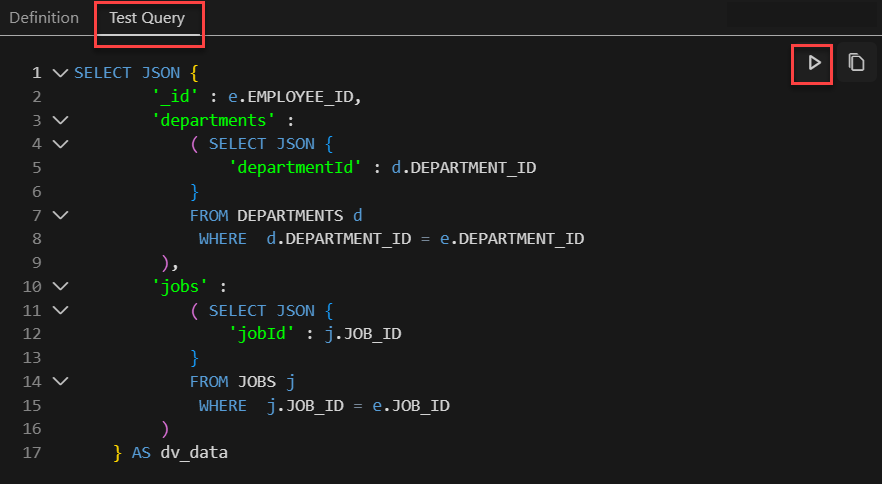
  2. To test the SELECT statement, select the Test Query tab and click the Run Query icon.
    Test query

    The output is displayed below the defintion panel.

Create Duality View

  1. After confirming the output, you can create the duality view. In the top right corner, click Create Duality View.

    To view the newly created duality view, refresh the Connections panel and expand the Duality View node. Click the duality view name to open it in the right panel.

3.2.2 Edit a Duality View

You can use the Duality View Builder to edit a duality view.
  1. In the Connections panel, expand the Duality Views node, right-click the name of the duality view to edit, and select Edit.

    The duality view appears in the Duality View Builder interface.

  2. Some of the changes that you can make to the duality view are add or delete tables in the diagram panel, and add columns or set additional properties for objects in the preview panel.

    For more information about how to make these changes, see Create a Duality View.

3.2.3 Insert a Data Record in a Duality View

This section covers the steps to insert a data record in a duality view.
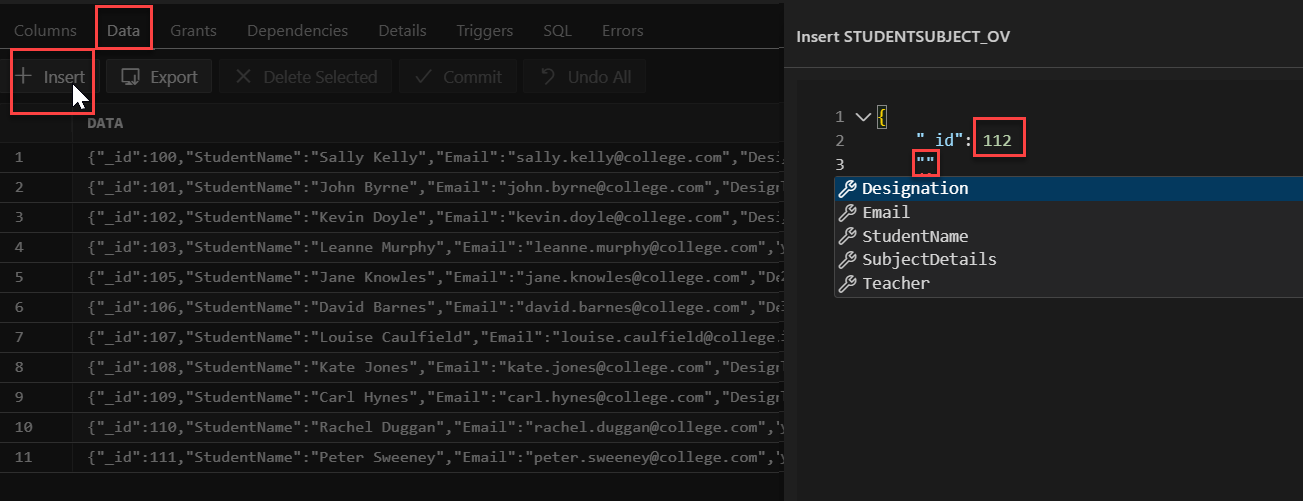
  1. In the Connections panel, expand the Duality Views node, and then click the duality view name to open it in the right panel.
  2. Select the Data tab.
  3. Click Insert.
  4. In the Insert panel, enter the value for the first property. Press the Enter key to move to the next line. When you enter quotation marks, the available properties that you can choose from are displayed in a list.
    Inserting data record

    If you add any new property that is not part of the schema, an error notification is displayed.

    After you complete entering all the details, click Save.

  5. Click Commit to commit the changes to the database.

3.2.4 Edit a Data Record in a Duality View

This section covers the steps to edit a data record in a duality view.
  1. In the Connections panel, expand the Duality Views node, and then click the duality view name to open it in the right panel.
  2. Select the Data tab.
  3. Position the cursor on the row that you want to edit, right-click and select Single Record View.

    Alternatively, click the Edit icon at the end of the row that you want to edit.

  4. In the Single Record View panel, click and type to complete the required changes.
    Edit data record

    To move to another record, you can use the move to next row or move to previous row icons.

    Note:

    When using the Single Record View option for a table with a column of JSON data type, note the following:

    • In a duality view, the metadata-related fields (such as etag, asof) are not available for editing.

    • For a regular table that has a column of JSON data type, this restriction does not hold and all the fields can be edited.

    • If the result of a SELECT statement in the worksheet is a duality view table or a table with a JSON data type column, then the table remains read-only and cannot be edited.

  5. After you have completed all your changes, click Save.

    A star symbol (*) appears next to the row number. This indicates that the changes to the row have not yet been committed to the database.

  6. Click Commit to commit the changes to the database.

3.2.5 Display the JSON Data Guide Diagram for a Duality View

The JSON data guide diagram represents the JSON schema for a duality view.

In the Connections panel, expand the Duality Views node, right-click the name of the duality view to edit, and select Show JSON Data Guide to display the diagram.

The following figure displays the JSON data guide diagram for the EMP_DV duality view that was created in Create a Duality View.
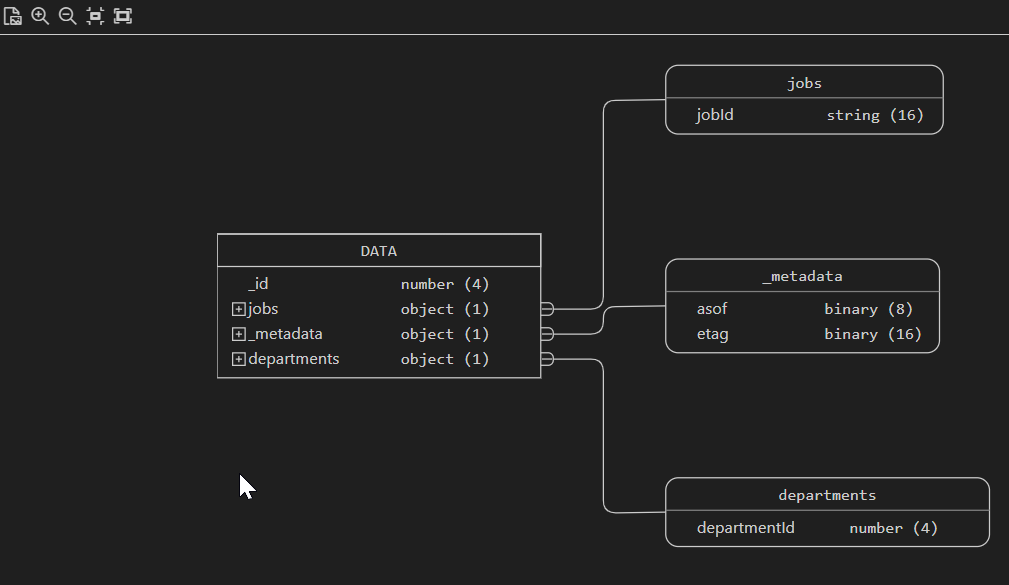
JSON data guide diagram