Data Storage
The intersection of one member from one Essbase dimension with one member from each of the other dimensions is a data value. Slicing the database in different ways gives you perspectives of the data based on member relationships. To store and access data, Essbase uses blocks and an index.
Note:
This information applies only to block storage (BSO) cubes, and not to aggregate storage (ASO) cubes.
Each data value in an Essbase database is stored in one cell. A particular data value is referenced by specifying its coordinates along each standard dimension.
Note:
Essbase does not store data for attribute dimensions. Essbase dynamically calculates attribute dimension data when a user retrieves the data.
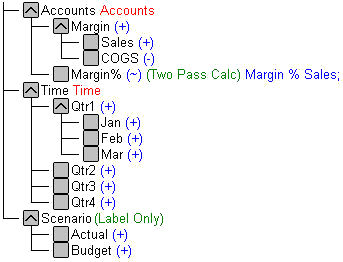
Consider the simplified database shown in Figure 2-13. This database has three dimensions: Accounts, Time, and Scenario:
-
The Accounts dimension has four members: Sales, COGS, Margin, and Margin%.
-
The Time dimension has four quarter members, and Qtr1 has three month members
-
The Scenario dimension has two child members: Budget for budget values and Actual for actual values.
Figure 2-13 A Multidimensional Database Outline
Data Values
The intersection of one member from one Essbase dimension with one member from each of the other dimensions represents a data value. A data value is the smallest data slice.
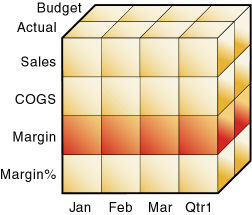
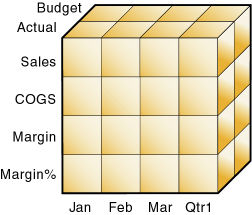
The example below has three dimensions (Accounts, Time, and Scenario); therefore, the dimensions and data values in the database can be represented as a cube.
Figure 2-14 Three-Dimensional Database
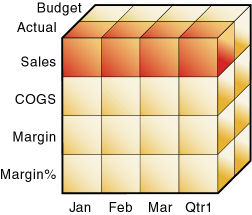
When you specify Sales, you are specifying the slice of the database that contains eight Sales values, where Sales intersect with Actual and Budget.
Figure 2-15 Sales Slice of the Database
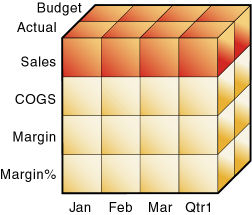
Slicing a database amounts to fixing one or more dimensions at a constant value while allowing the other dimensions to vary.
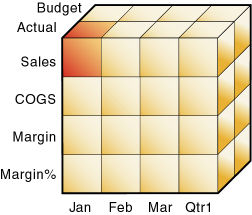
When you specify Actual Sales, you are specifying the slice of the database that contains four Sales values, where Actual and Sales intersect.
Figure 2-16 Actual, Sales Slice of the Database
A data value is stored in one cell in the database. To refer to a specific data value in a multidimensional database, you specify its member on each dimension. For example, the slice Sales, Jan, Actual consists of one data value. The data value can also be expressed, using the cross-dimensional operator (->), as Sales -> Actual -> Jan.
Figure 2-17 Sales->Jan->Actual Data Value
Data Blocks and the Index System
Essbase uses two types of internal structures to store and access data: data blocks and the index system.
Essbase creates a data block for each unique combination of sparse standard dimension members (providing that at least one data value exists for the sparse dimension member combination). The data block represents all the dense dimension members for its combination of sparse dimension members.
Essbase creates an index entry for each data block. The index represents the combinations of sparse standard dimension members. It contains an entry for each unique combination of sparse standard dimension members for which at least one data value exists.
For example, in the Sample.Basic database outline shown in Figure 2-18, Product and Market are sparse dimensions.
Figure 2-18 Product and Market Dimensions from the Sample.Basic Database
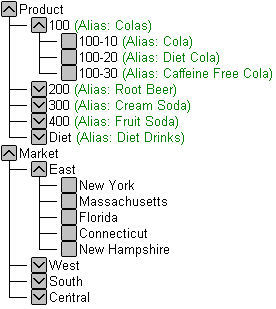
If data exists for Caffeine Free Cola in New York, Essbase creates a data block and an index entry for the sparse member combination of Caffeine Free Cola (100-30) -> New York. If Caffeine Free Cola is not sold in Florida, Essbase does not create a data block or an index entry for the sparse member combination: Caffeine Free Cola (100-30) -> Florida.
The data block Caffeine Free Cola (100-30) -> New York represents all the Year, Measures, and Scenario dimensions for Caffeine Free Cola (100-30) -> New York.
Each unique data value can be considered to exist in a cell in a data block. When Essbase searches for a data value, it uses the index to locate the appropriate data block. Then, within the data block, it locates the cell containing the data value. The index entry provides a pointer to the data block. The index handles sparse data efficiently because it includes only pointers to existing data blocks.
Figure 2-19 shows part of a data block for the Sample.Basic database. Each dimension of the block represents a dense dimension in the Sample.Basic database: Time, Measures, and Scenario. A data block exists for each unique combination of members of the Product and Market sparse dimensions (providing that at least one data value exists for the combination).
Figure 2-19 Part of a Data Block for the Sample.Basic Database
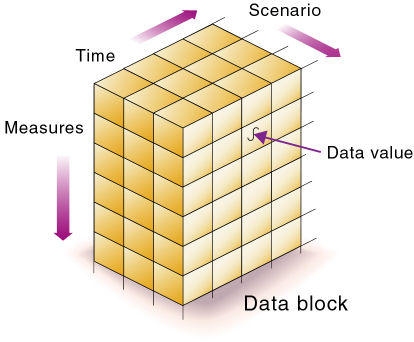
Each data block is a multidimensional array that contains a fixed, ordered location for each possible combination of dense dimension members. Accessing a cell in the block does not involve sequential or index searches. The search is almost instantaneous, resulting in optimal retrieval and calculation speed.
Essbase orders the cells in a data block according to the order of the members in the dense dimensions of the database outline.
A (Dense)
   a1
   a2
B (Dense)
   b1
       b11
       b12
   b2
       b21
       b22
C (Dense)
   c1
   c2
   c3
D (Sparse)
   d1
   d2
       d21
       d22
E (Sparse)
   e1
   e2
   e3
The block in Figure 2-20 represents the three dense dimensions from within the combination of the sparse members d22 and e3, from the preceding database outline. In Essbase, member combinations are denoted by the cross-dimensional operator. The symbol for the cross-dimensional operator is ->, so d22 -> e3 denotes the block for d22 and e3. The intersection of A, b21, and c3 is written as A -> b21 -> c3.
Figure 2-20 Data Block Representing Dense Dimensions for d22 -> e3
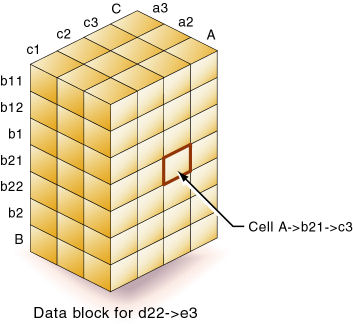
Essbase creates a data block for every unique combination of the members of the sparse dimensions D and E (providing that at least one data value exists for the combination).
Data blocks, such as the one in Figure 2-20, may include cells that do not contain data values. A data block is created if at least one data value exists in the block. Essbase compresses data blocks with missing values on disk, expanding each block fully as it brings the block into memory. Data compression is optional but is enabled by default.
By carefully selecting dense and sparse standard dimensions, you can ensure that data blocks do not contain many empty cells, minimizing disk storage requirements and improving performance. In Essbase, empty cells are known as #MISSING data.
Slices: Multiple Data Views
An Essbase database supports multiple views of data sets for users who need to analyze the relationships between data categories. Slicing the database in different ways gives you different perspectives of the data.
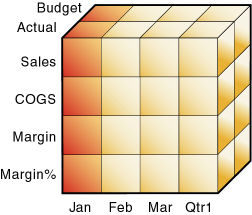
For example, in Figure 2-21, the slice for Jan examines all data values for which the Year dimension is fixed at Jan.
Figure 2-21 Data for January
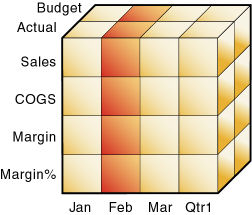
The slice in Figure 2-22 shows data for the month of Feb:
Figure 2-22 Data for February
The slice in Figure 2-23 shows data for profit margin:
Figure 2-23 Data for Profit Margin
