1.14.3.2 I/O Stat Detail
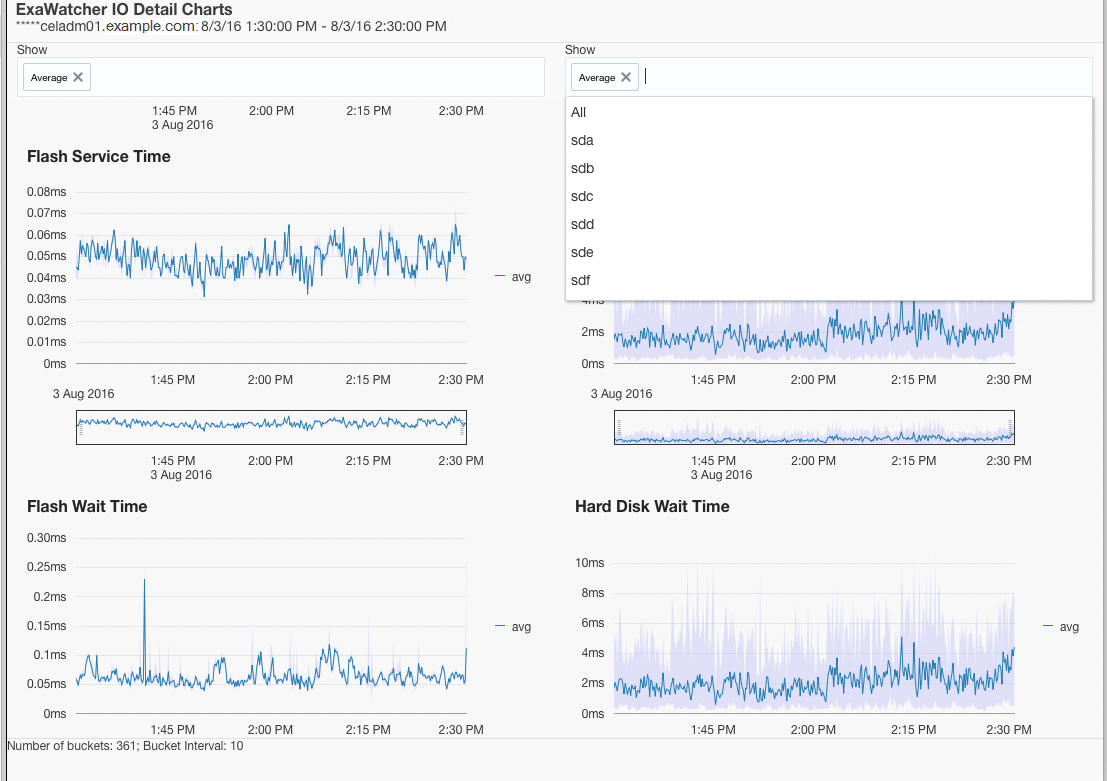
IOStat Detail shows performance for each disk on the storage server. The following charts are shown in this page:
Table 1-5 Statistics for IO Stat Detail
| Statistic | Description |
|---|---|
|
Flash Service Time Hard Disk Service Time |
Average service time per disk contrasted against the range of wait times. |
|
Flash Wait Time Hard Disk Wait Time |
Average wait time per disk |
By default, the charts include a line that depicts the average across all disks on the server. The shaded, background image indicates the minimum and maximum range for the statistic. You can choose to display individual disks by using the drop down selector.
If the background image has a wide range, then this can indicate possible differences in disk performance. You can use this metric to look more closely at each individual disk on the storage server to see if there is an imbalance. If the background image has a narrow range, then that indicates the disks are performing similarly.
The individual disk IOPs and MB/s for a storage server can also be compared to the data sheet numbers to see if the disks are potentially hitting their maximum capacity.
Parent topic: IO Charts
