Changing the Set of Visible Probes
By default, only probes in abnormal state are displayed in yellow for every time point. When the selected time point is marked red, a set of problems is active (see Problems or Anomalies), each with its own set of abnormal probes. At this point, only the description of the problem is displayed. Once a problem is selected, its associated set of abnormal probes are identified and displayed. This will be discussed further in Problems or Anomalies.
You may prefer to display all high probes at any time point, or perhaps explore visually the time series of every probe regardless of their state.
The following are the custom settings for the selection of probes:
- Display only abnormal probes (the "yellow" marked zone) or probes of a selected problem. This is the default behavior.
- Display always all abnormal probes (on "yellow" or "red").
- Display every existing probe regardless its state.
- Display all probes belonging to the same category (called "correlated probes").
- Display every abnormal probe in a specific time range. For more information, see Selecting Abnormal Probes in any Time Range .
- Display only a subset of existing probes (3) by their category. For more information, see Selecting Custom Set of Probes .
The following examples show how to select options (2), (3) and (4) from the above list. Use either floating menu or a Hot Key to change the mode in which probes are being displayed.
For example:
Figure 6-14 Changing the Set of Visible Probes
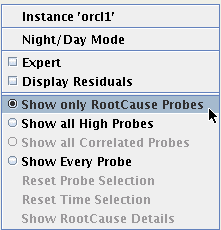
Either select "Show all High Probes" or press "a" to display every high probe at any point in time. Select "Show Every Probe" or press "A" to view every probe regardless of its state.
Figure 6-15: Changing the Set of Visible Probes
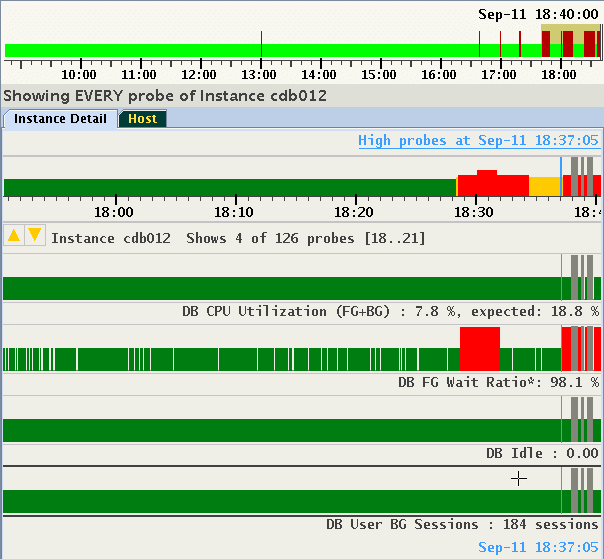
The number of probes may exceed the size of the display window. In this example, only four probes out of a total of 126 can be displayed. The Status label under the time line indicates which subset of probes is being shown and provides up or down arrows to navigate. In this example, probes 18, 19, 20 and 21 are displayed. Both up/down icons are highlighted indicating that scrolling both directions is available using cursor up/down or page up/down keys or using the mouse wheel.
It is also possible to display all probes belonging to the same category. Categories of probes will be explained in the section devoted to Expert Mode. Every probe may belong to one or more pre-defined categories. For example, "Buffer Cache," or "Global Cache Exceptions" are categories of probes associated with database instances.
Note that when the cursor hovers over any probe's timeline, its boundaries are highlighted as it gets focus. Alternatively, use the up or down arrow keys to move focus to a specific probe without moving the mouse pointer. Figure 13-17 focus is on "Log file sync":
Figure 6-16: Changing the Set of Visible Probes
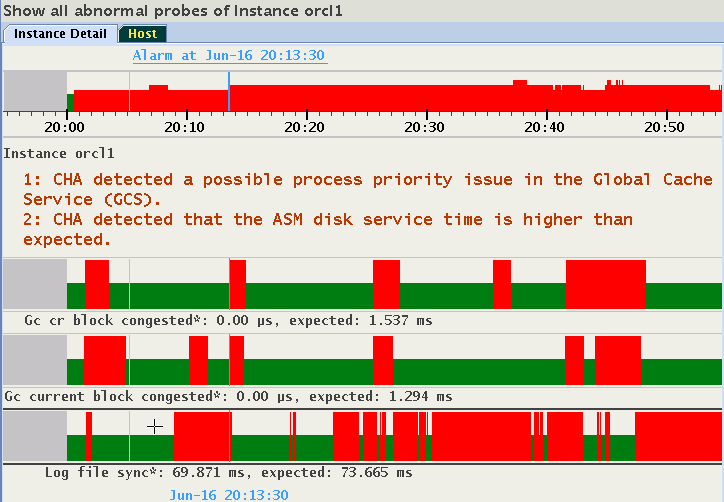
Use the right-click popup menu, or press "c" to display all correlated probes belonging to all "Log file sync" member categories.
Figure 6-17: Changing the Set of Visible Probes
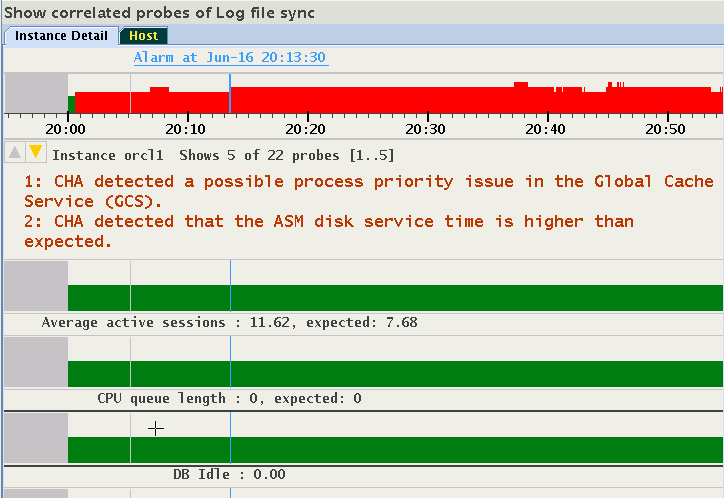
Should the number of probes not fit into the display, the up/down cursor icons appear and the status line shows details about visible subset of probes. See Expert Mode for the steps to select and create subsets of probes.