Problems or Anomalies
Whenever the timeline of the entity displays red, one or more problems exist at that timestamp. Every problem contains the following information:
- Name: This is an internal identifier.
- Description: An explanation of the nature of the diagnosed problem (displayed by default on the panel).
- Confidence probability in percentage (may differ at every time point).
- Root cause and diagnosis of the problem.
- Suggested corrective actions.
- Set of probes associated with the problem (may differ at every time point).
- Set of inference chains in Bayesian Network. One chain per probe associated with the problem.
- Set of tables with detailed information (optional, calculated per time point).
Portions of this information will be displayed only in the Expert Mode, described in Expert Mode. Below is an example of two problems indicated at 18:31:00:
Figure 6-20: Problems or Anomalies
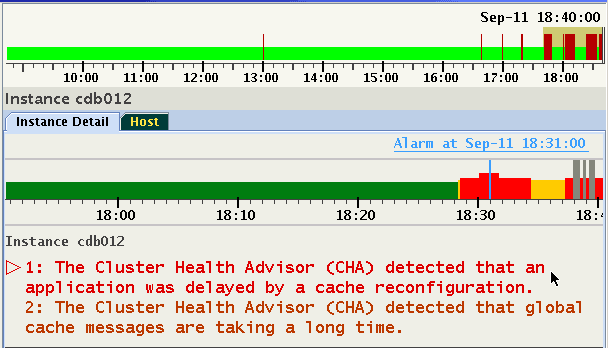
Problems are listed in the order of their confidence probability. Problems that have probes that are Key Performance Indicator (KPI) will be displayed at the top of the list regardless of their confidence probability. The order and set of problems may differ at each time point, and a set of probes raised for each problem may vary with every time point.
The problem with a focus is indicated by a color change and a right arrow to the left of its number. Focus may also be changed using the up or down arrow keys.
Each problem has a set of probes in abnormal state. As long a specific Problem is not selected, AHF Scope will not display any probes. This default preference for display of probes may be changed by using the right click pop-up menu, or by using a Hot Key. For example, when selecting radio button "Show all High Probes" or pressing "a", all abnormal probes across all problems at 18:31 are displayed.
Figure 6-21: Problems or Anomalies
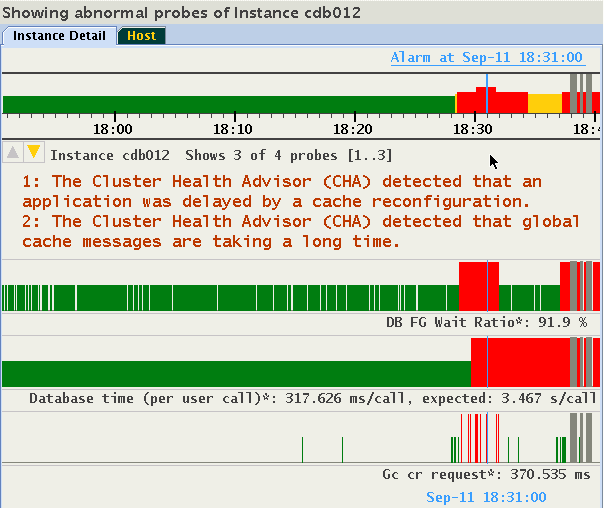
The highlighted up/down icons in the upper-left side of the panel indicates that not all probes can be displayed. In this example, the information bar displays "Shows 3 of 4 probes [1..3]". Use down/up Arrow or the page up/down keys to scroll through the probes while keeping same time position.
Probes specific to a problem are still available by returning to the default mode, and by selecting the problem of interest. Press "a" again to remove the display of all abnormal probes and return to the default mode.
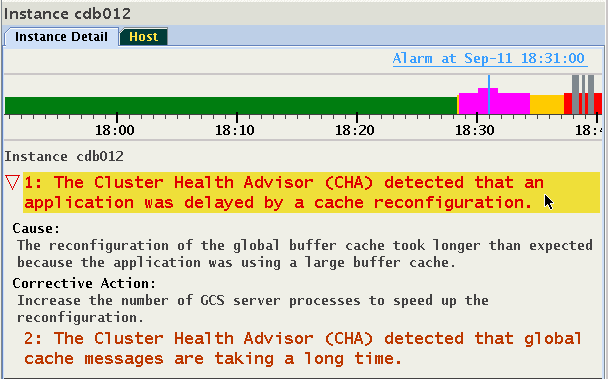
To step through the analysis of a problem in detail, highlight the problem and either click it, or hit the Enter key on your keyboard. This action selects the highlighted problem and displays the root cause diagnosis and a recommended corrective action. In addition, on the status timeline every occurrence of the same problem is displayed in magenta. In the example below, the top problem was indicated between 18:28 and 18:34:
Figure 6-22: Problems or Anomalies
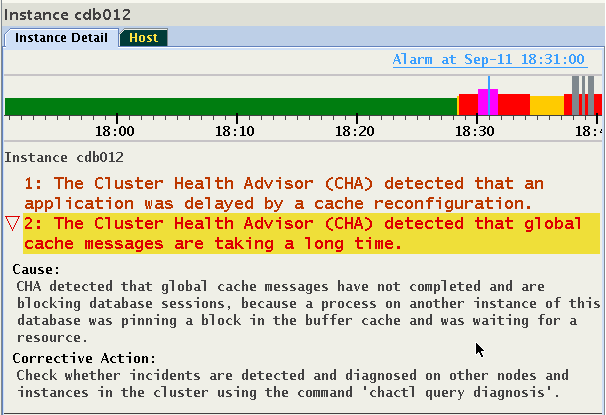
To switch to another problem, either click it, or use the up/down arrow to highlight it, and then hit the Enter key on your keyboard. Note how the magenta marked time period has changed on target's status timeline.
Figure 6-23: Problems or Anomalies
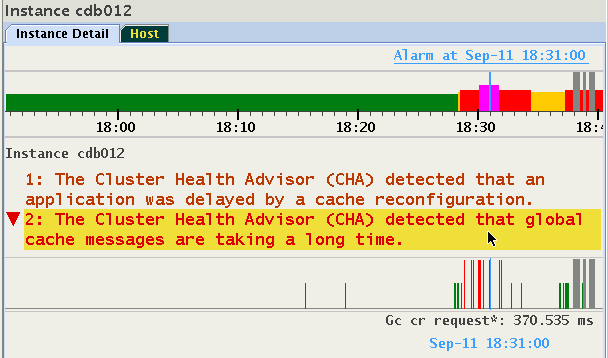
Click once more on the selected problem, or hit the Enter key on your keyboard to display the set of the probes providing evidence supporting the problem determination. In this example, the problem has only one probe, "Gc cr request":
Figure 6-24: Problems or Anomalies
Hit the Enter key again, and note that the display returns to its list of problems to facilitate analysis of the additional ones. There are the following three problem displays which cycle upon clicking or pressing Enter.
- Problem is highlighted (empty right arrow points to the problem name).
- Problem is selected, shows textual descriptions of cause, corrective action (empty down arrow points to the descriptions).
- Problem is selected, shows status timelines of probes associated with the problem (filled down arrow points to the probe timelines).
Note that when selecting a different problem by a mouse click or using Enter, the display mode stays the same allowing stepping through each problem in the same mode.