Cloud Control Interface for Monitoring the Recovery Appliance
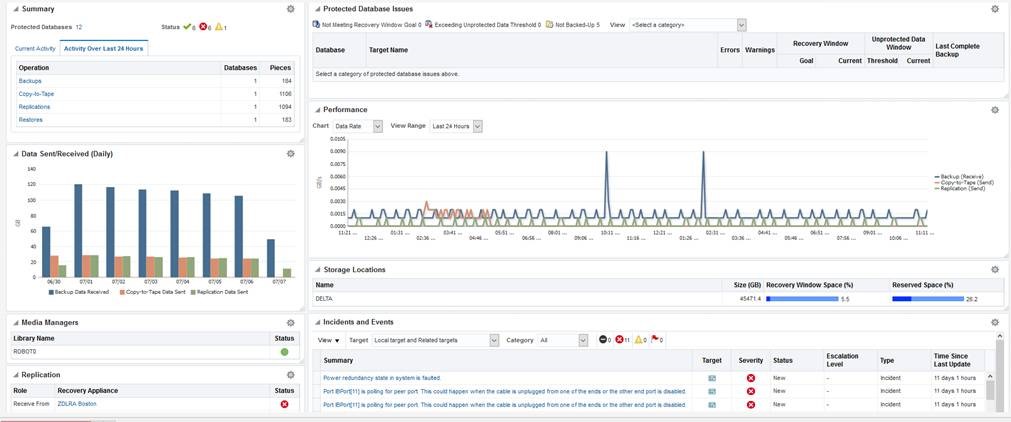
The primary interface for monitoring the Recovery Appliance is the Recovery Appliance Home page. The Home page lists any existing warnings and alerts, as shown in the following graphic:
The following sections of the Home page show monitoring information:
-
Summary
This section shows the number of databases with no issues, with alerts, and with warnings. In Cloud Control, an alert is an indicator that a particular metric condition has been encountered. For example, an alert might indicate that a metric threshold has been reached.
-
Media Managers and Replication
These sections show the status of copy-to-tape and Recovery Appliance replication services.
-
Protected Database Issues
This section summarizes the backup status for protected databases, and provides a category filter so you can view which databases are affected.
-
Incidents and Events
This section displays incidents and events reported for the Recovery Appliance and all associated targets. You can filter by target and category. You can click the Summary link to drill down to the Incident Manager to view detailed information about the incident.
Note:
Warnings automatically clear when the underlying issue is resolved.
See Also:
