Accessing the Recovery Appliance Home Page
The Recovery Appliance Home page is a command center that centralizes management of the Recovery Appliance environment. From this page, you can manage Recovery Appliance storage and performance, and view recent activity and issues that may need attention.
To access the Recovery Appliance Home page:
-
On the Cloud Control Login page, enter your
SYSMANuser name and password.See Also:
"User Accounts in the Recovery Appliance Environment" for more information on user accounts in the Recovery Appliance environment
-
From any Cloud Control page, select Targets, and then Recovery Appliances.
The Recovery Appliances page appears.
-
In the Name column, click the name of a Recovery Appliance.
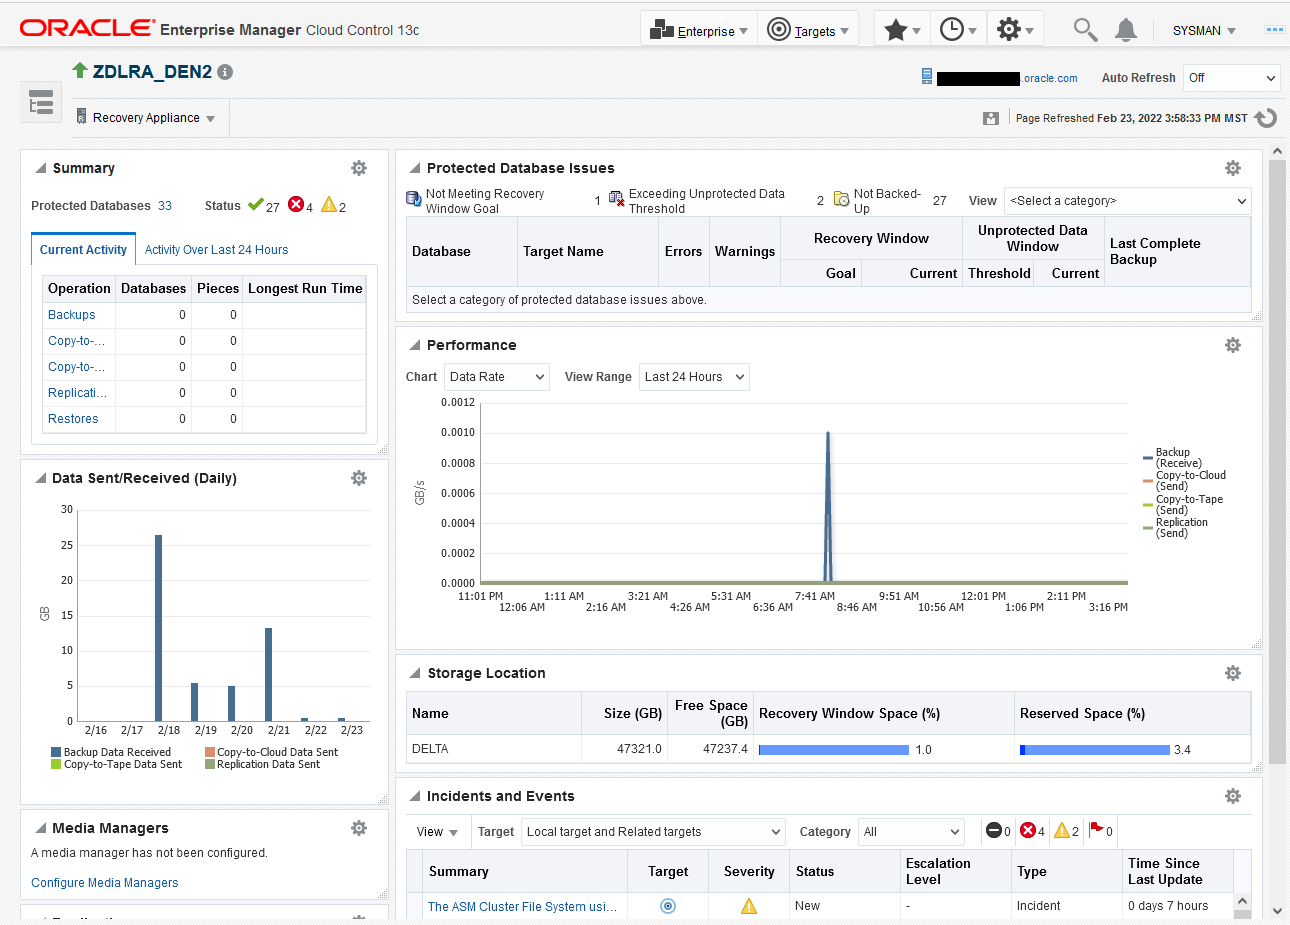
The Home page for the selected Recovery Appliance page appears. The following graphic shows part of a sample Home page:
From this page you can see a snapshot of the entire Recovery Appliance, and also click links to obtain more information about a particular area.
-
Optionally, to access the main menu, click Recovery Appliance.
The menu appears with many options, and many of those having additional fly-out menu options.
- Home
- Monitoring
- Diagnostics
- Control
- Job Activity
- Members
- Reports
- Protected Databases
- Protection Policies
- Replication
- Archival Backups
- Copy-to-Media Job Templates
- Media Managers
- Storage Location
- Configuration
- Compliance
- Target Setup
- Target Sitemap
- Target Information
From the preceding menu you can go to all pages relating to management, monitoring, and reporting for this Recovery Appliance.
The Recovery Appliance Home page is divided into the following sections:
-
Summary
This section shows the number of protected databases, and summarizes their health status, current activity, and activity within the last 24 hours. For more information, click the links in the Operation column: Backup, Copy-to-Tape, Replication, and Restore.
-
Protected Database Issues
This section highlights any issues relating to backup and recovery status for protected databases. The View menu filters the information on key categories.
-
Data Sent/Received (Daily)
This section displays daily throughput over the past week.
-
Performance
This section charts performance statistics for Data Rate and Queued Data. The statistics are filterable by day, week, or month.
-
Media Managers
This section displays the configured media manager for copy-to-tape operations.
-
Storage Locations
This section summarizes total available space and usage by indicating how much has been consumed to meet the disk recovery window goal for all databases, and what percentage of total space is reserved space for databases backing up to the specified storage location (see "How Recovery Appliance Manages Storage Space").
-
Replication
This section lists the downstream Recovery Appliances to which this Recovery Appliance is replicating, and also the upstream Recovery Appliances from which this Recovery Appliance is receiving backups (see "About Replication Partners and Users Accounts").
-
Incidents and Events
This section summarizes all warnings or alerts that have been generated by Cloud Control monitoring of all targets associated with the Recovery Appliance. From this section, drill down for further detail on the issues.
