4 Post-Discovery Configuration and Verification

Once the Oracle Exadata Database Machine has been discovered through Enterprise Manager Cloud Control 13c, you must complete post-discovery configuration on the following targets:

Note:

You must remove the SNMP notification on the cell, InfiniBand switch, ILOM, Cisco switch, and PDU manually if you remove these targets from Enterprise Manager.

Starting with Exadata plug-in Release 12.1.0.3.0, when the Exadata Database Machine target is deleted through Enterprise Manager Cloud Control, there is an option to remove the SNMP notification from the cells and InfiniBand switches.

Verify SNMP Subscription of the Oracle Management Agent to Exadata Storage Server

Exadata Storage Server SNMP configuration is performed using the cellcli command and can be run in batch using dcli from a compute node.

Note:

  • During the discovery process, you can optionally provide the necessary root credentials to subscribe for SNMP traps from Exadata Storage Servers. If you have done so, then you can skip the remaining steps of this section and proceed with Configure and Verify SNMP for InfiniBand Switch Targets.

  • While the public string is used for the SNMP examples in the following sections, it is supported to use any valid SNMP community string.

  • Use SNMP V3 subscriptions for IPv6-based Exadata Storage Server targets because of limitations in the SNMP V1 protocol.

Using the ALTER CELL Command

While using the ALTER CELL command, all existing subscribers should be specified along with the new subscriber being added. Similarly, you can also modify the notificationPolicy or notificationMethod attributes.

While using the ALTER CELL command, the host= and community= attribute values should be quoted, and type= is NOT quoted.

If you are using the DCLI utility to set up SNMP alerting, then any command containing punctuation, which will be interpreted by the local shell, must be enclosed with double quotation marks. If the command includes the following characters, then outer quotation marks and escape characters are required:

  • $ (dollar sign)
  • ' (quotation mark)
  • < (less than)
  • > (greater than)
  • ( ) (parentheses)

The backslash (\) is the escape character that allows the characters to be passed to the CellCLI utility without being interpreted by the remote shell.

Check Current SNMP Configuration

Check the current SNMP configuration using the following cellcli commands:

  1. To list the current subscribers for SNMP:
    # cellcli -e list cell attributes snmpSubscriber
    

    When correctly configured, this command should list the primary and backup agents for the cell target, for example:

    # cellcli -e list cell attributes snmpSubscriber
    ((host=[hostname.mycompany.com],port=3872,community=public),
    (host=[hostname2.mycompany.com],port=3872,community=public)) 
    
  2. To list the currently configured notification methods:
    # cellcli -e list cell attributes notificationMethod
    

    Possible values are snmp, mail and snmp,mail. When correctly configured, this command should return either snmp or snmp,mail, for example:

    # cellcli -e list cell attributes notificationMethod
    snmp,mail
    
  3. To list the currently configured notification policy for SNMP:
    # cellcli -e list cell attributes notificationPolicy
    

    Possible values are any or all of Critical, Warning, and Clear. When correctly configured, this command should return Critical, Warning, Clear, for example:

    # cellcli -e list cell attributes notificationPolicy
    Critical,Warning,Clear

Configure SNMP Values Using cellcli

To set the values of snmpSubscriber, notificationMethod and notificationPolicy:

  1. Set the snmpSubscriber value:
    • SNMP V1

      # cellcli -e "alter cell snmpSubscriber=((host='[host name]',port=[port]),(host='[host name]',port=[port]))"
      

      Where [host name] and [port] values are Agents monitoring your cell targets.

    • SNMP V3

      The process is same as above, but along with the host and port, an SNMP V3 user and type must be provided:

      ALTER CELL snmpSubscriber=((host='host1.example.com',port=[port], snmpUser='[v3user]', type=V3))
      

      Before you run the command, make sure that a v3user is a valid SNMP user on the cell. You can check by running following command:

      cellcli -e "list cell attributes snmpUser"
      

      If there is no valid SNMP user on the cell, then add a SNMP V3 user with the following command:

      ALTER CELL snmpUser=((name='[v3user]', authProtocol='MD5', authPassword='[passwd]', privProtocol='DES', privPassword='[passwd]'))
    • Oracle Auto Service Request (ASR) subscription

      The above two steps describe the process of adding an SNMP subscription for cell traps in MS MIB format. If you want to subscribe for SNMP traps in the Oracle Auto Service Request (ASR) format as well, then along with the entries mentioned above you must add another entry with type=ASR (for SNMP V3, it is type=V3ASR).

      For example, for SNMP V1:

      ALTER CELL snmpSubscriber=((host='host1.example.com',port=[port],community='[community string]'), (host='host1.example.com',port=[port],community='[community]',type=ASR))
      

      For example, for SNMP V3:

      ALTER CELL snmpSubscriber=(((host='host1.example.com',port=[port],community='[community string]'),(host='host1.example.com',port=[port], snmpUser='[v3user]', type=V3ASR))

    Note:

    Take special care not to overwrite existing settings for snmpSubsriber. If there are existing subscribers, then append the agent subscriptions. For example, if the cellcli -e list cell attributes snmpSubscriber command returned:

    # cellcli -e list cell attributes snmpSubscriber
     ((host=ilm-asr1.example.com,port=162,community=public,type=asr))
    

    Then you must append the Agent subscriptions:

    #cellcli -e "alter cell snmpSubscriber=((host='ilm-asr1.example.com',port=162,
    community=public,type=asr),(host='[host name]',port=[port]),(host='[host name]',port=[port]))"
  2. For SNMP V3, update the following in Enterprise Manager:
    • Ensure that the SNMP V3 monitoring credentials are set up on the cell target in Enterprise Manager which match the SNMP V3 user on the cell:

      • Log in to Enterprise Manager.

      • From the Setup menu, select Security, then select Monitoring Credentials.

      • Select the Exadata Storage Server type and click Manage Monitoring Credentials.

      • Select the cell and set the SNMP V3 credentials.

    • Ensure that the snmpengineid property is set up on the target in Enterprise Manager:

      • Log in to Enterprise Manager.

      • Go to the Exadata Storage Server home page.

      • From the Exadata Storge Server menu, select Monitoring Configuration.

      • If the snmpengineid property is not set, then set it manually in Enterprise Manager. You can obtain it from the cell with the following command

        list cell attributes snmpengineidhex
        

        All of the above steps are automatically taken care of it SNMP V3 subscription along with ASR option are selected during Exadata Database Machine discovery.

  3. Set the notificationMethod value:
    # cellcli -e "alter cell notificationMethod='snmp,mail'"
    
  4. Set the notificationPolicy value:
    # cellcli -e "alter cell notificationPolicy='Critical,Warning,Clear'"

Configure SNMP Values Using dcli (optional)

The SNMP configuration commands can be run using dcli to perform the configuration in batch on alll Exadata Storage Servers:

  1. Set the snmpSubscriber value:
    $ dcli -g cell_group -l root "cellcli -e \"alter cell snmpSubscriber=((host='[host name]',port=[port]),(host='[host name]',port=[port]))\""
    

    Where [host name] and [port] values are Agents monitoring your cell targets.

  2. Set the notificationMethod value:
    $ dcli -g cell_group -l root "cellcli -e \"alter cell notificationMethod='snmp,mail'\""
    
  3. Set the notificationPolicy value:
    $ dcli -g cell_group -l root "cellcli -e \"alter cell notificationPolicy='Critical,Warning,Clear'\""

Verify SSH Connectivity

Open a new terminal and verify whether the SSH connectivity was successfully established:

$ ssh -l cellmonitor <cell_ipaddress> cellcli -e 'list cell detail'
  • If you are not prompted for any password, then you can assume that the connectivity is established.

  • If you are asked to confirm whether you want to continue connecting, specify Yes.

Remove a Subscription

To remove the subscription, use the ALTER CELL command again by excluding the host name that you want to remove from the snmpsubscriber list.

Note:

The SNMP receivelet listens on a single address and port for all monitored targets. The port is the UDP port with the same number as the TCP port used in the EMD_URL.

By default, the SNMP receivelet listens on all addresses; if the property SnmpRecvletListenNIC is set in the emd.properties file, the receivelet will attempt to resolve the value as either a name or IP address, and listen on only that address.

This parameter is independent of AgentListenOnAllNICs and EMD_URL because in some installations, the Agent may need to communicate with the OMS and with managed targets on different networks.

Configure and Verify SNMP for InfiniBand Switch Targets

The SNMP configuration for Enterprise Manager monitoring of InfiniBand Switches is done automatically as part of the Enterprise Manager guided discovery process. It is good practice, however, to verify that SNMP configuration has been successful.

Note:

  • During the discovery process, you can optionally provide the necessary root credentials to set up SNMP trap for the InfiniBand Switch. If you have done so, then you can skip the remaining steps of this section and proceed with Configure the Compute Node ILOM SNMP for Enterprise Manager Monitoring.

  • ilom-admin is the preferred user when discovering an InfiniBand Switch target for full monitoring. If the switch is discovered using root or ilom-admin user, the community string provided during discovery is added to the switch, if it doesnt exist already.

  • During SNMP V3 discovery, the V3 user added by the (discovery) user during discovery is added to the switch if the discovery is perfomred using root or the ilom-admin user.

To configure (if necessary) and verify the SNMP configuration for an InfiniBand Switch:

  1. Log in to the InfiniBand Switch ILOM web interface using the URL https://<ib_switch_hostname> as root.

    Note:

    Try using Internet Explorer if the console does not display all fields/values in your browser of choice.

  2. Click Configuration, then System Management Access, and finally SNMP.
  3. Ensure the following values are set:
    State=Enabled
    Port=161
    Protocols=v1,v2c,v3
    

    If you need to make changes, make sure you click Save.

  4. Click Configuration, then System Management Access, then SNMP, and finally the Communities link. The page scrolls to the SNMP Communities table. In the SNMP Communities table, click Add.

    A new window opens.

  5. Type the community name into the Community Name field. Select the permissions from the Permission drop-down menu. Click Save.

    The community is created, and the window closes.

  6. Click Alert Management.
  7. If not already listed, for each Agent that monitors the InfiniBand Switch target, select an empty alert (one that has the Destination Summary 0.0.0.0, snmp v1, community 'public') and click Edit. Provide the following values:
    Level = Minor
    Type = SNMP Trap
    Address = [agent compute node hostname]
    Destination Port = [agent port]
    SNMP Version = v1
    Community Name = public
    

    Click Save.

  8. Verify the InfiniBand Switch SNMP configuration for Enterprise Manager monitoring:
    snmpget -v 1 -c <community_string> <hostname_of_IB_switch> 1.3.6.1.4.1.42.2.70.101.1.1.9.1.1.5
    

    For example:

    $ snmpget -v 1 -c public my_IB_switch.my_company.com 1.3.6.1.4.1.42.2.70.101.1.1.9.1.1.5
    SNMPv2-SMI::enterprises.42.2.70.101.1.1.9.1.1.5 = INTEGER: 1

    Note:

    If the Timeout message is displayed as a output for the above command, then it means that the InfiniBand Switch is not yet configured for SNMP.

    Note:

    To remove the subscription, follow steps 1 to 5 above (step 3 is not needed). In step 5, set the Agent compute node host name to 0.0.0.0 and the port to 0.

Configure the Compute Node ILOM SNMP for Enterprise Manager Monitoring

Note:

These instructions apply only for the Exadata Database Machine and are not applicable to the Oracle SuperCluster.

The compute node ILOM targets are responsible for displaying a number of disk failure alerts for their respective compute node that are received as SNMP traps. For Enterprise Manager to receive those traps, the /opt/oracle.cellos/compmon/exadata_mon_hw_asr.pl script must be run to configure SNMP subscriptions for the agents (both primary and backup agents) that have been configured to monitor the compute node ILOM targets. This step is applicable to Exadata plug-in Release 12.1.0.2.0 and later.

Note:

  • While configuring the SNMP traps for the ILOM telemetry source, if discovery is done using the root user, the entry is automatically added to the SNMP subscription table, provided there are free slots available. IF discovery is performed using a non-root user, the user will need to manually update this table from ILOM console.
  • During SNMP V3 discovery, the SNMP V3 user added by the user during discovery is added to the ILOM, if the discovery is done using root user. For discovery using a non-root user, the administrator will need to manually create the SNMP V3 user in the ILOM console.

The exadata_mon_hw_asr.pl script is run as the root user with the -set_snmp_subscribers parameter to add SNMP subscribers. For example:

# /opt/oracle.cellos/compmon/exadata_mon_hw_asr.pl -set_snmp_subscribers "(host=hostname1.mycompany.com,port=3872,community=public,type=asr,fromip=11.222.33.444),(host=hostname2.mycompany.com,port=3872,community=public,type=asr,fromip=12.345.67.890)"
Try to add ASR destination Host - hostname1.mycompany.com IP - 11.222.33.44 Port - 3872 Community - public From IP - 22.333.44.555
Try to add ASR destination Host - hostname2.com IP - 11.111.11.111 Port - 3872 Community - public From IP - 22.333.44.555

The script needs to be run on each compute node:

  • The host values should be the hostnames of the agents configured to monitor the compute node ILOM target associated with the compute node.

  • The fromip values should be the IP address of the compute node that the compute node ILOM target is associated with.

For example, if you have an X2-2 machine with compute node targets edbm01db01 through edbm01db08 and associated compute node ILOM targets edbm01db01-c through edbm01db08-c, then you would need to run the script once on each compute node - therefore, the script would be run eight times in total.

  • On compute node edbm01db01, the host and port values would be the hostnames and ports of the agents monitoring compute node ILOM target edbm01db01-c and the fromip value would be the IP address of the compute node itself, edbm01db01.

  • On compute node edbm01db02, the host and port values would be the hostnames and ports of the agents monitoring compute node ILOM target edbm01db02-c and the 'fromip' value would be the IP address of the compute node itself, edbm01db02, ... and so on.

This is a good example of where Manual selection of Management Agents for targets is useful. If the first two compute nodes are always the Monitoring Agent and Backup Monitoring Agent, then it is easy to work out the values needed for -set_snmp_subscribers parameters, the host and port values would be the same for all compute nodes.

Note:

The exadata_mon_hw_asr.pl script, overwrites any existing SNMP subscriptions. While setting the SNMP subscribers, make sure that current subscribers are included in the new list of subscribers.

It is possible to use the exadata_mon_hw_asr.pl script to get the current set of subscribers using the -get_snmp_subscribers parameter.

For example:

# /opt/oracle.cellos/compmon/exadata_mon_hw_asr.pl -get_snmp_subscribers -type=asr

Suppose the current list is:

(host=hostname1.mycompany.com,port=162,community=public,type=asr,fromip=11.222.33.444),
(host=hostname2.mycompany.com,port=162,community=public,type=asr,fromip=11.222.33.444)

Then new subscriptions can be added using the following command:

# /opt/oracle.cellos/compmon/exadata_mon_hw_asr.pl -set_snmp_subscribers
 "(host=asrhostname1.mycompany.com,port=162,community=public,type=asr,fromip=11.222.33.444),
(host=asrhostname2.mycompany.com,port=162,community=public,type=asr,fromip=11.222.33.444),
(host=hostname1.mycompany.com,port=3872,community=public,type=asr,fromip=11.222.33.444),
(host=hostname2.mycompany.com,port=3872,community=public,type=asr,fromip=11.222.33.444)"

After adding the new subscribers, run the command exadata_mon_hw_asr.pl script with the -get_snmp_subscribers parameter to get the list of SNMP subscribers and verify the new SNMP subscriptions were added successfully. For example:

# /opt/oracle.cellos/compmon/exadata_mon_hw_asr.pl -get_snmp_subscribers -type=asr
(host=asrhostname1.mycompany.com,port=162,community=public,type=asr,fromip=10.10.10.226),
(host=asrhostname2.mycompany.com,port=162,community=public,type=asr,fromip=10.10.10.226),
(host=hostname1.mycompany.com,port=3872,community=public,type=asr,fromip=10.10.10.226),
(host=hostname2.mycompany.com,port=3872,community=public,type=asr,fromip=10.10.10.226)

Configure the Compute Node ILOM SNMP for Compute Nodes Running Management Server

For compute nodes running Management Server, the call to the exadata_mon_hw_asr.pl script is replaced with dbmCLI commands, which are similar to cellCLI commands on the Exadata Storage Servers.

Configure SNMP Values Using dbmcli

  1. Set the snmpSubscriber value:
    # dbmcli -e "ALTER DBSERVER snmpSubscriber=((host=[agent1_hostname],port=[agent1_port],community=public,type=asr,fromIP=eth0_IP_ADDR),(host='agent2_hostname',port=<agent's port>,type=asr,fromIP=eth0_IP_ADDR))"
    

    Where [host name] maps to the Enterprise Manager agents monitoring your compute node target.

  2. Set the notificationMethod value:
    # dbmcli -e "ALTER DBSERVER notificationMethod="mail,snmp", notificationPolicy="critical,warning,clear", smtpFrom="admin", smtpFromAddr=[sender email address], smtpPort=[port], smtpServer=[smtp server], smtpToAddr=[recipient email address], smtpUseSSL=TRUE
    
  3. Verify the updates by executing:
    # dbmcli -e "LIST DBSERVER attributes snmpSubscriber"
    

For Virtualized Exadata, these commands need to be executed in Dom0.

Configure SNMP for Oracle SuperCluster (If root is not used for discovery)

Note:

  • This section is applicable only if ILOM target discovery is performed as a non-root user. If discovery is done using a root user, the entry is automatically added to the table, provided there are free slots available.
  • During SNMP V3 discovery, the SNMP V3 user added by the user during discovery is added to the switch, if the discovery is performed as a root user. For discovery using a non-root user, the administrator has to manually create the SNMP V3 user in the ILOM console.
  1. Log in to the Oracle SuperCluster ILOM web interface, which is accessible via a browser using the url http://<ilom_hostname> and the root credentials.
  2. Select Configuration, then Alert Management.
  3. Add a row for each agent.
  4. Select an empty slot and click Edit.
  5. Specify the following information:
    • Level: Minor

    • Type: SNMP Trap

    • Address: IP Address of the Agent

    • Destination Port: Uncheck Autoselect, then specify Agent port manually

    • SNMP Version: v1

    • Community Name: {your chosen community name}

  6. Click Save.

Set Up SNMP for Cisco Ethernet Switch Targets

The Cisco Ethernet Switch must be configured to allow the Agents that monitor it to be able to both poll the switch and to receive SNMP alerts from the switch. To allow this, perform the following steps (swapping the example switch name dm01sw-ip with the name of the Cisco Ethernet Switch target being configured):

Note:

This procedure is valid for SI targets if the monitoring of the switch is performed with a non-administrator user. If Enterprise Manager monitors the switch with an administrator user, the following procedure is automatically performed as part of the discovery process.

  1. Log in to the Cisco switch and enter Configure mode:
    # ssh cisco-switch-host -l <admin user>
    User Access Verification Password: 
    dm01sw-ip> enable
    Password:
    dm01sw-ip# configure terminal
    Enter configuration commands, one per line. End with CNTL/Z.
    dm01sw-ip(config)#
    
  2. Enable access to allow the Agents monitoring Cisco Switch target to poll the switch.

    In the command, [EMagentIPaddr] is the IP address of the server where the Enterprise Manager Agent is running. The SNMP community specified must match the value provided when configuring the Cisco Switch target:

    dm01sw-ip(config)# snmp-server community <community_string> ro 1
    
  3. Set the monitoring Agent as the location where SNMP traps are delivered. The SNMP community specified must match the value provided during Enterprise Manager Cisco Switch Management Plug-In setup:
    dm01sw-ip(config)# snmp-server host <EMagentIPaddr> version 1 <community string> udp-port [EMagentRecvltListenPort]
    

    Where [EMagentRecvltListenPort] is the EMD_URL port of the emagent or SnmpRecvletListenNIC property value if it is enabled.

  4. Verify settings and save the configuration:
    dm01sw-ip(config)# end
    dm01sw-ip# show running-config
    dm01sw-ip# copy running-config startup-config

Verify the Cisco Ethernet Switch SNMP Configuration

Run the snmpwalk command line utility or equivalent tool to verify the Cisco Switch configuration.

Run the following commands to fetch and display the data from the Cisco switch:

$ snmpget –v 1 –c <community_string> <hostname_of_cisco_switch> 1.3.6.1.4.1.9.2.1.56.0
$ snmpget –v 2c –c <community_string> <hostname_of_cisco_switch> 1.3.6.1.4.1.9.2.1.56.0

Note:

If a timeout message is displayed as an output for the above command, then it means that the Cisco Switch is not yet configured correctly.

Set Up SNMP for Power Distribution Unit (PDU) Targets

To enable Enterprise Manager to collect metric data and raise events for the PDU target, you must configure the PDU to accept SNMP queries from the Agents that monitor the PDU target. Also, appropriate threshold values for different phase values needs to be set on the PDU.

This section assumes that this is a first time configuration of the PDU. SNMP must be enabled and the trap section completed. Granting SNMP access to a different monitoring Agent IP address is an example where only the "Trap Host Setup" section needs to be changed.

  1. Log in to the PDU network interface through a browser at https://<pdu-name>, for example: https://edbm01-pdu1.example.com
  2. Click Net Configuration, then log in again.
  3. Scroll down until you reach the SNMP section of the frame.

    Note:

    The network interface for the PDU is a frame within a window. In order to scroll down on this page, you must see the scroll bar for the PDU frame as well as the outside scroll bar for the browser in which you accessed the PDU.

  4. If your PDU is not SNMP-enabled, select the SNMP Enable check box, then click Submit.
  5. Scroll to the NMS region of the frame.
  6. Enter the following in Row 1 under NMS:
    • IP: Enter the IP address of the first monitoring Agent

    • Community: Enter "public"

  7. Click Submit.

For details on configuring the PDU thresholds settings, see the "Configuring Oracle Exadata Database Machine" chapter in your Exadata Database Machine Owner's Guide. This guide is pre-loaded along with other Exadata user documentation onto your Oracle Exadata Database Machine.

Verify the PDU SNMP Configuration

Use the snmpwalk command line utility or equivalent tool to verify the PDU configuration.

Run the following command to fetch and display the data from PDU:

snmpget –v 1 –c <community_string> <hostname_of_pdu> 1.3.6.1.4.1.2769.1.2.3.1.1.1.0

Note:

If a timeout message is displayed as an output for the above command, then it means that the PDU is not yet configured correctly.

Accessing Oracle Support Workbench for Exadata Storage Server

You can access the Oracle Support Workbench for the current Exadata Storage Server to access diagnostic data for problems and incidents related to the cell.

To access the Support Workbench for a single Exadata Storage Server, follow these steps:

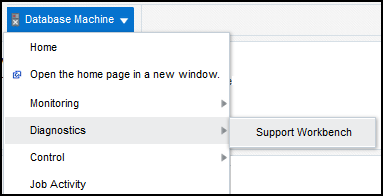
  1. From the Target menu of the Exadata Storage Server for which you want to access the Oracle Support Workbench, select Diagnostics, then select Support Workbench as shown in Figure 4-:

    Figure 4-1 Support Workbench Menu


    Support Workbench Menu screen shot example
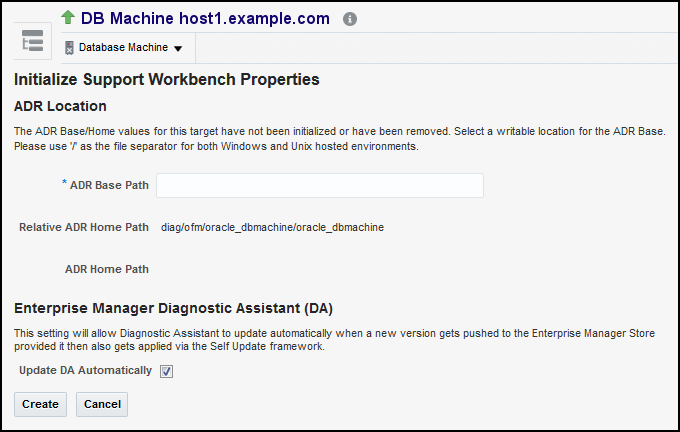
  2. If you are logging in to the Support Workbench for the first time, you must first initialize the Support Workbench properties. For first-time log in, the Initialize Support Workbench Properties window will be displayed as shown in Figure 4-2:

    Figure 4-2 Initialize Support Workbench Properties


    Initialize Support Workbench Properties screen shot example

    Enter the Automatic Diagnostic Repository (ADR) Base Path. A typical looks like this (Figure 4-3):

    Figure 4-3 ADR Base Path


    ADR Base Path screen shot example

    The ADR Home Path is a target-specific, writable path on the agent where the generated package is to be stored. During initializing, it is not editable as it is generated automatically once the ADR base path is specified.

    Click Create.

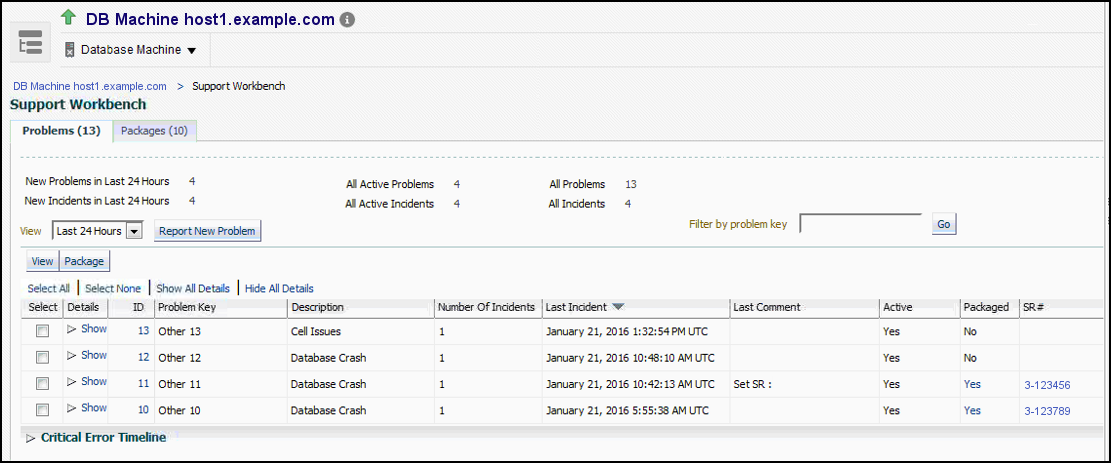
  3. Once the Support Workbench properties have been initialized, the Support Workbench page displays showing a list of any problems for the Database Machine (Figure 4-4):

    Figure 4-4 Support Workbench Page


    Support Workbench Page screen shot example

Oracle Exadata Database Machine Dashboard Creation

You can create a Database Machine dashboard to monitor the performance and usage metrics of the Database Machine system, its sub-components, as well as all the database system components residing on the Database Machine.

Exadata Database Machine Dashboard Creation

  1. Log in to Enterprise Manager.
  2. From the Enterprise Manager home page, click the Enterprise menu. Select the Job submenu, then Library.
  3. Select Database Machine Services Dashboard from the drop-down menu next to the Create Library Job option.
  4. Click Go.
  5. Enter a name of the job (for example, CREATE_DBM_JOB_1).
  6. Click Add and select the DBMachine target. After adding, make sure the target is selected by clicking on the check box next to it. Note that you can select more than one DBMachine and that a dashboard report will be created for each one.
  7. Click the Parameters tab.

    Three options are provided through the drop-down:

    • Select Create if it is a new report.

    • Select Update for updating an existing report with new components.

    • Select Cleanup to remove services created by the Create job executed earlier.

  8. Finally, click Save to Library to save the job.

    A message indicating the job was created successfully should display along with a link to the running job.

    You can monitor the job by clicking on the link corresponding to the job.

  9. To run the job, from the Job Library page, select the newly created job and click Submit. This will open the job to allow you to select the Targets to run against. Select the correct targets and click Submit.

How to Make the Report "Public"

The generated report is accessible only by the Enterprise Manager user who creates it. To make the report public:

  1. Select the dashboard report from the list of reports shown after following the steps mentioned above.
  2. Click Edit.
  3. Select the Run report using target privileges of the report owner option under Privileges section in General tab.
  4. Click the Access tab.
  5. Select the Allow viewing without logging in to Enterprise Manager option.
  6. Click OK.

Find All Database Machine Reports

To find all Database Machine reports:

  1. Log in to Enterprise Manager.
  2. From the Enterprise Manager home page, click the Enterprise menu. Select Reports, then Information Publisher Reports.
  3. Search for the report name. Dashboard report names, one for each Database Machine, are displayed in the following format:
    [DBMachine Name]_DASHBOARD_REPORT
    
  4. Click on the report to view the dashboard report.