Discovering and Monitoring Exascale
Exascale is a collection of Exadata software services that manage Exadata storage servers and provide storage to multiple database server clusters. Enterprise Manager provides Exascale discovery and monitoring via a dedicated Oracle Exadata Exascale target type.
For more information on Oracle Exadata Exascale, see What is Oracle Exadata Exascale? in Exascale User's Guide.
Topics:
The Exascale target home page provides monitoring capabilities such as availability and health monitoring, as well as storage and IOPS utilization monitoring, both aggregated and distributed by serviced clients.
Advanced performance monitoring consists of an interactive illustration of IOPS allocations across vaults, storage pools and databases. Advanced filtering options provide the ability to visually identify IOPS bottlenecks and view them in context with historical Exascale IOPS utilization in order to triage performance issues. The advanced monitoring capabilities are available if the Exadata Management Pack is enabled. See Exadata Exascale Advanced Monitoring in Advanced Management and Monitoring for Engineered Systems.
Prerequisites
- Exascale is supported from Exadata System Software version 24.1.
- Exascale is supported from Oracle Enterprise Manager version 13.5GC Release Update 23 (both Agent and Management Server)
- Exascale is supported for Oracle Database 23ai (23.5 or higher).
- The Exascale administrator should create a user with cl_monitor privilege using Exascale command line escli . The required private or public key is created using escli and saved in a PEM file. This key can also be stored in the digital wallet. Oracle Enterprise Manager requires this user name and corresponding private key to monitor Exascale. This information can be copied from the PEM file directly or extracted from the wallet. See User Privileges, Create a User, and Start and Use ESCLI in Exascale User's Guide.
Discovering Exascale
Enterprise Manager uses a dedicated target type Oracle Exadata Exascale to monitor Exascale. Exascale targets can be discovered either as part of Exadata Database Machine discovery or separately after Database Machine discovery.
Topics:
Exascale Discovery as Part of Oracle Exadata Database Machine Discovery
-
Follow the steps 1 through 10 in Discover the Oracle Exadata Database Machine Target Using the Console for discovering a Database Machine and its components.
-
After providing credentials for monitoring Agents and storage servers, the discovery wizard checks for the presence of Exascale on the Database Machine. If present, the Storage Management page is displayed to enable Exascale discovery. The Exascale target name is prepopulated with the Exascale cluster name.
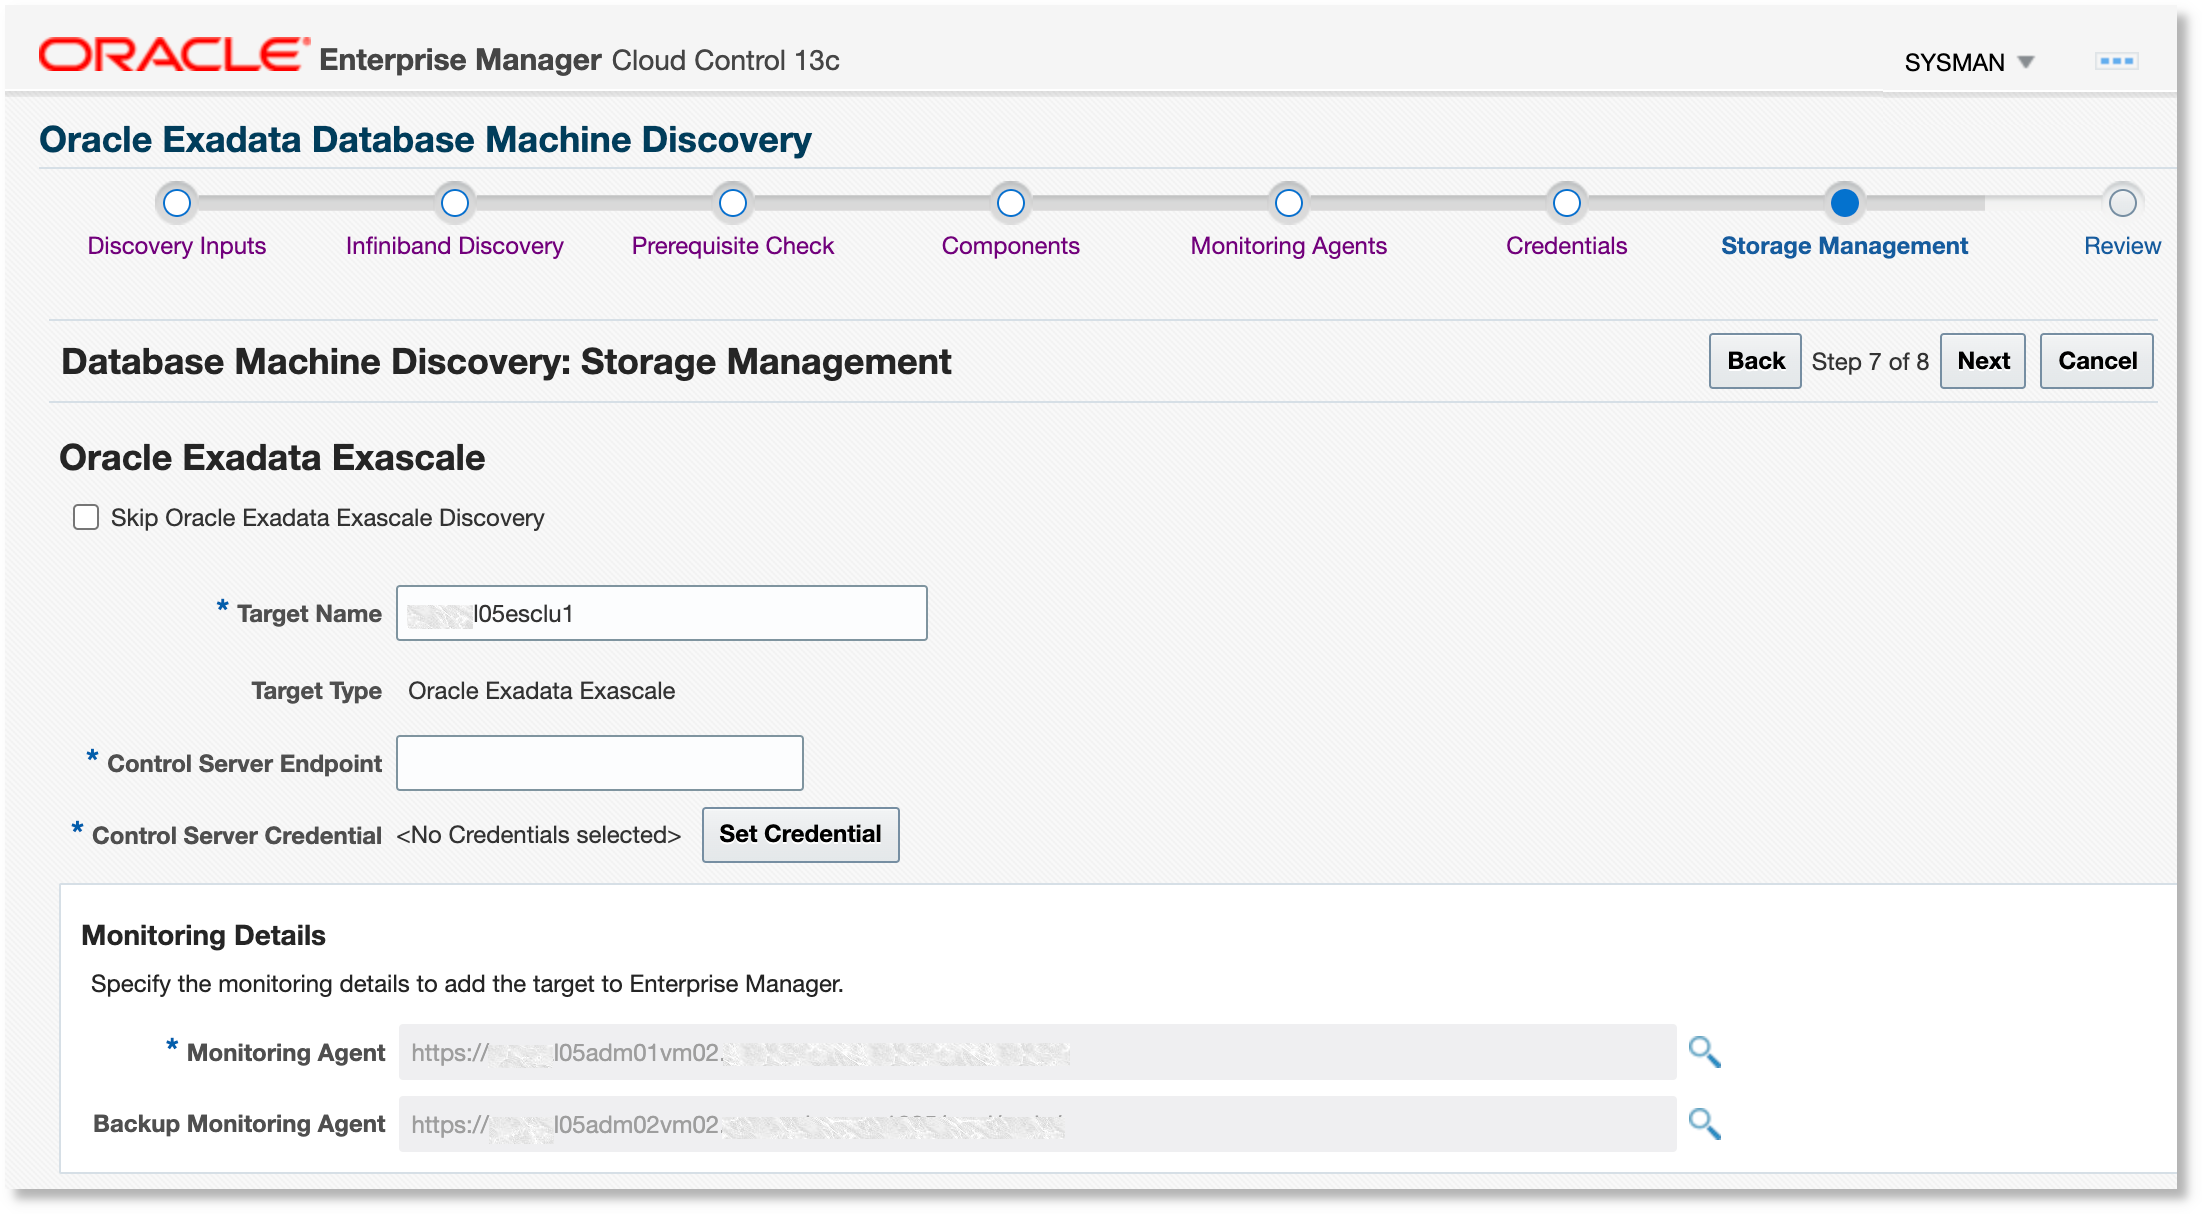
Provide the Monitoring Agent and Backup Monitoring Agent to monitor the Exascale target.
-
Provide the Control Server Endpoint, as provided by the Exadata administrator. This will be in the format
<fully
                                qualified hostname>:port
. -
Specify the Control Server Credential using the name and private key used in Create an Exascale Monitoring User.
Copy the private key you previously generated and paste into the Private Key and Confirm Private Key fields. Click OK to save. Click Next to proceed.
-
Continue with steps 11 through 12 in Discover the Oracle Exadata Database Machine Target Using the Console.
You can access the Exascale target from the Target Navigation tree. The Exascale target can also be accessed from the All Targets page in the Servers, Storage and Network category.
Exascale Discovery After Oracle Exadata Database Machine Discovery
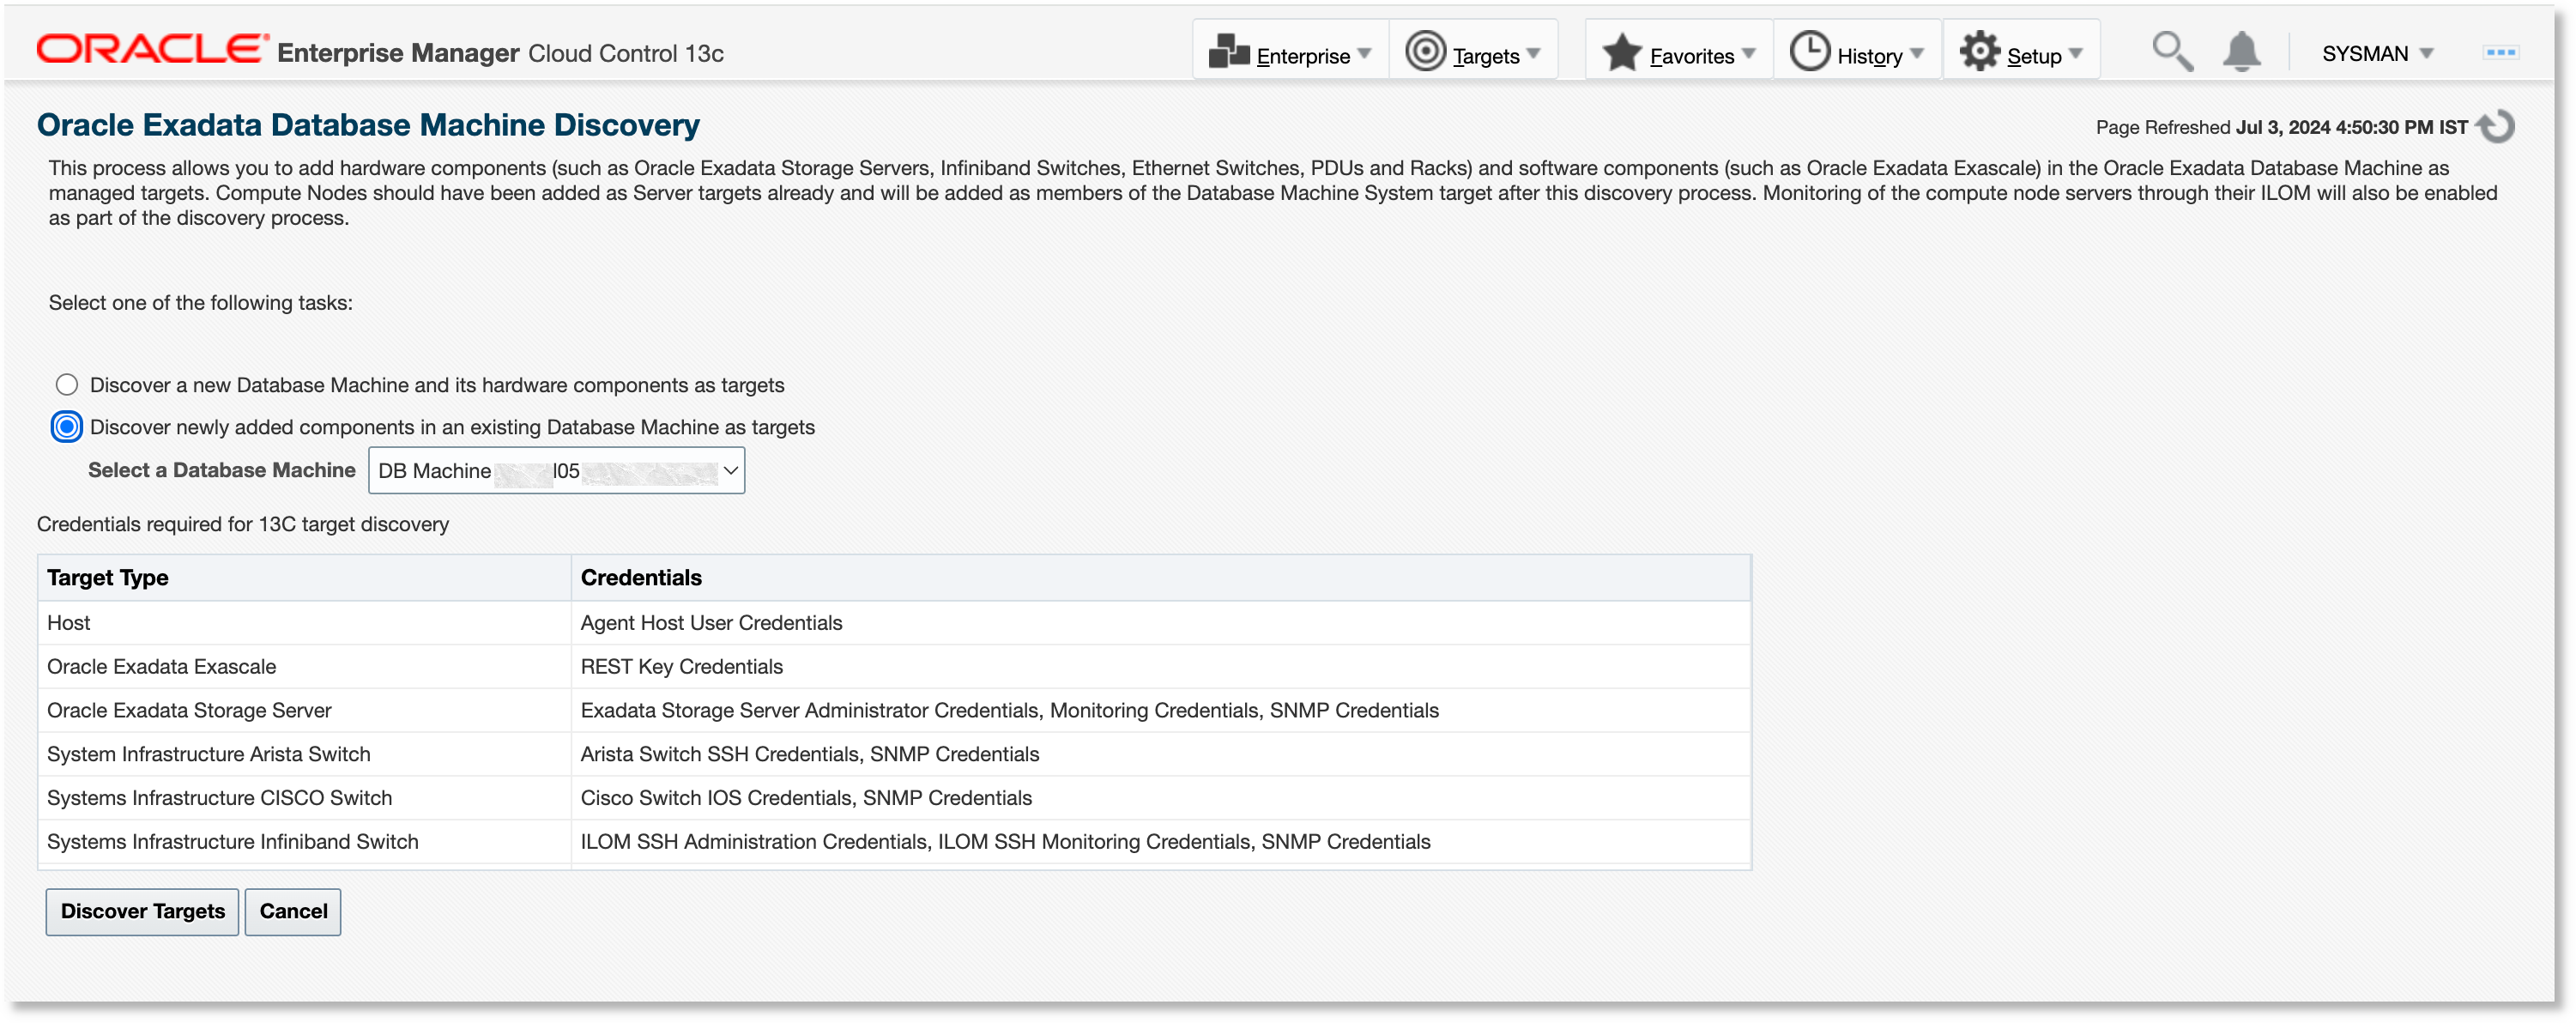
If you want to add Exascale to a Database Machine after the latter is discovered by Oracle Enterprise Manager, then Exascale can be discovered as a newly added component and associated with the existing Database Machine target. In the Database Machine discovery workflow, select the Discover newly added components in an existing Database Machine as targets option. This is the same workflow used to discover other new components, such as storage severs.
Monitoring Exascale
The Exascale home page has four tabs for monitoring:
Topics:
The advanced monitoring capabilities are available if the Exadata Management Pack is enabled. See Exadata Exascale Advanced Monitoring in Advanced Management and Monitoring for Engineered Systems.
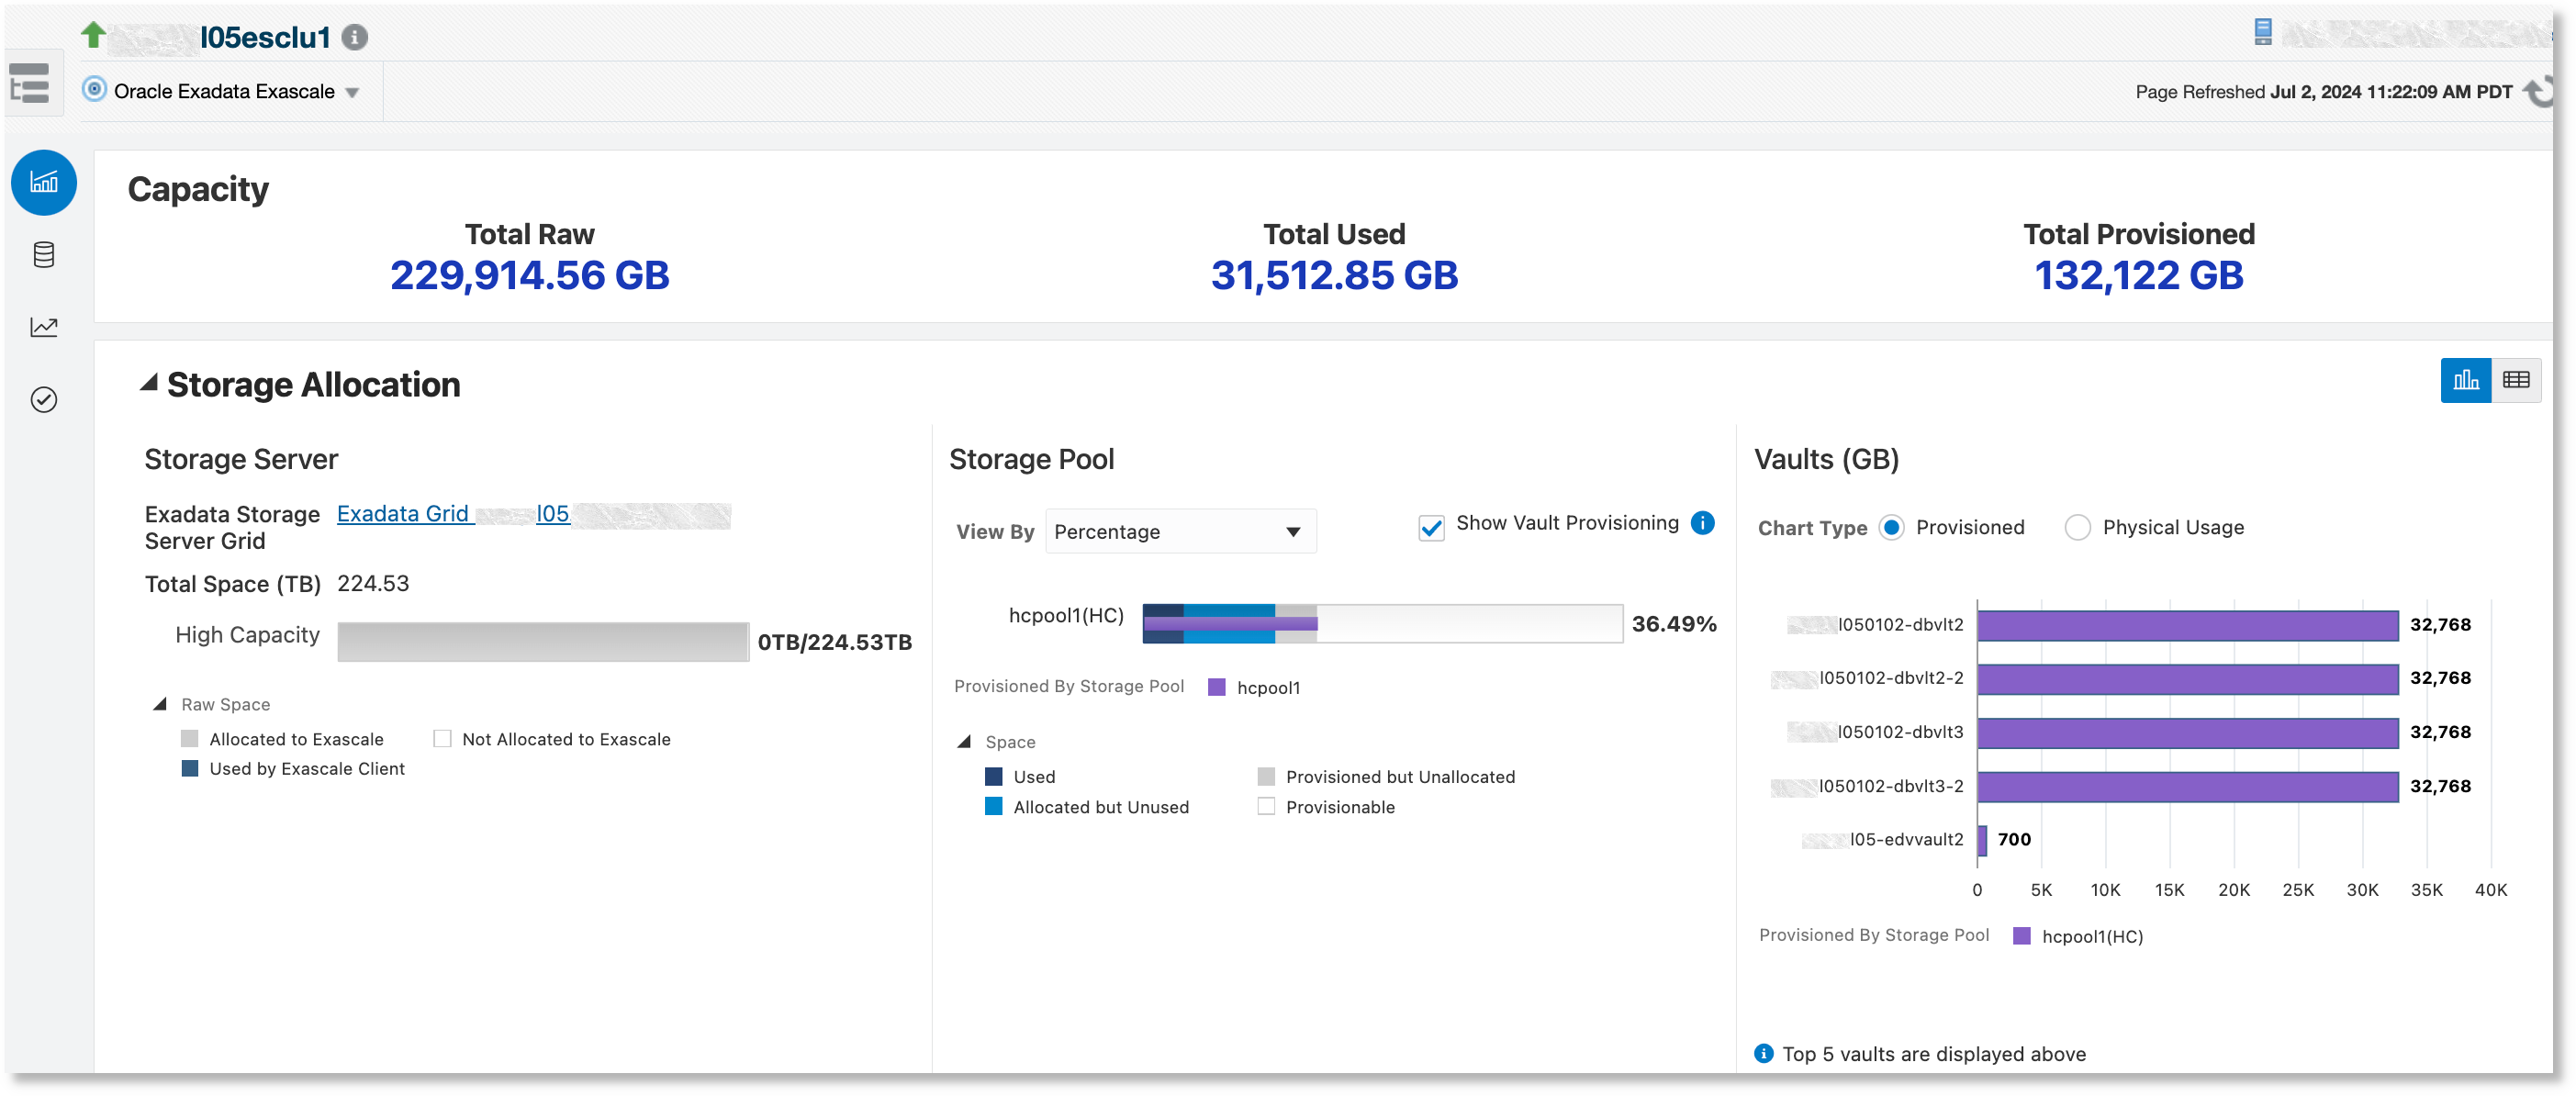
Capacity
The Capacity tab has three sections:
- Capacity: This section displays the following summary statistics:
- Total Raw: Total raw space available, in GB
- Total Used: Total space used by clients, in GB
- Total Provisioned: Total space provisioned to vaults, in GB
- Storage Allocation: This section shows the total available storage, the
storage that has been provisioned by the storage pools to the vaults, and the
storage used by Exascale clients. The section has three charts:
- Storage Server: Displays information related to the Exadata Storage Server Grid that provisions storage to the Exascale, including total pool disk space provisioned and the pool disk space used by Exascale clients
- Storage Pool: Displays storage pool information. Media type is color-coded in the charts. A storage pool consists of all pool disks of the same media type, either High Capacity (HC) or Extreme Flash (EF). The charts provide an option to view the space that is provisioned to the vaults and the space that is used by Exascale clients. Space can be viewed as a percentage or an absolute value, in GB. Detailed chart information is displayed upon mouse-over.
- Vaults: Displays how the vaults have been provisioned and used. Storage for the vaults can be provisioned from more than one storage pool. Media type is color-coded in the charts using the same colors as the storage pool charts.
- Historical Space Usage: This section displays storage pool space usage
over a period of time. The following reference lines can be displayed on the
chart:
- Threshold: Displays the storage pool usage warning and critical thresholds, if they are set in Oracle Enterprise Manager.
- Physical Space Available: Displays storage pool physical space

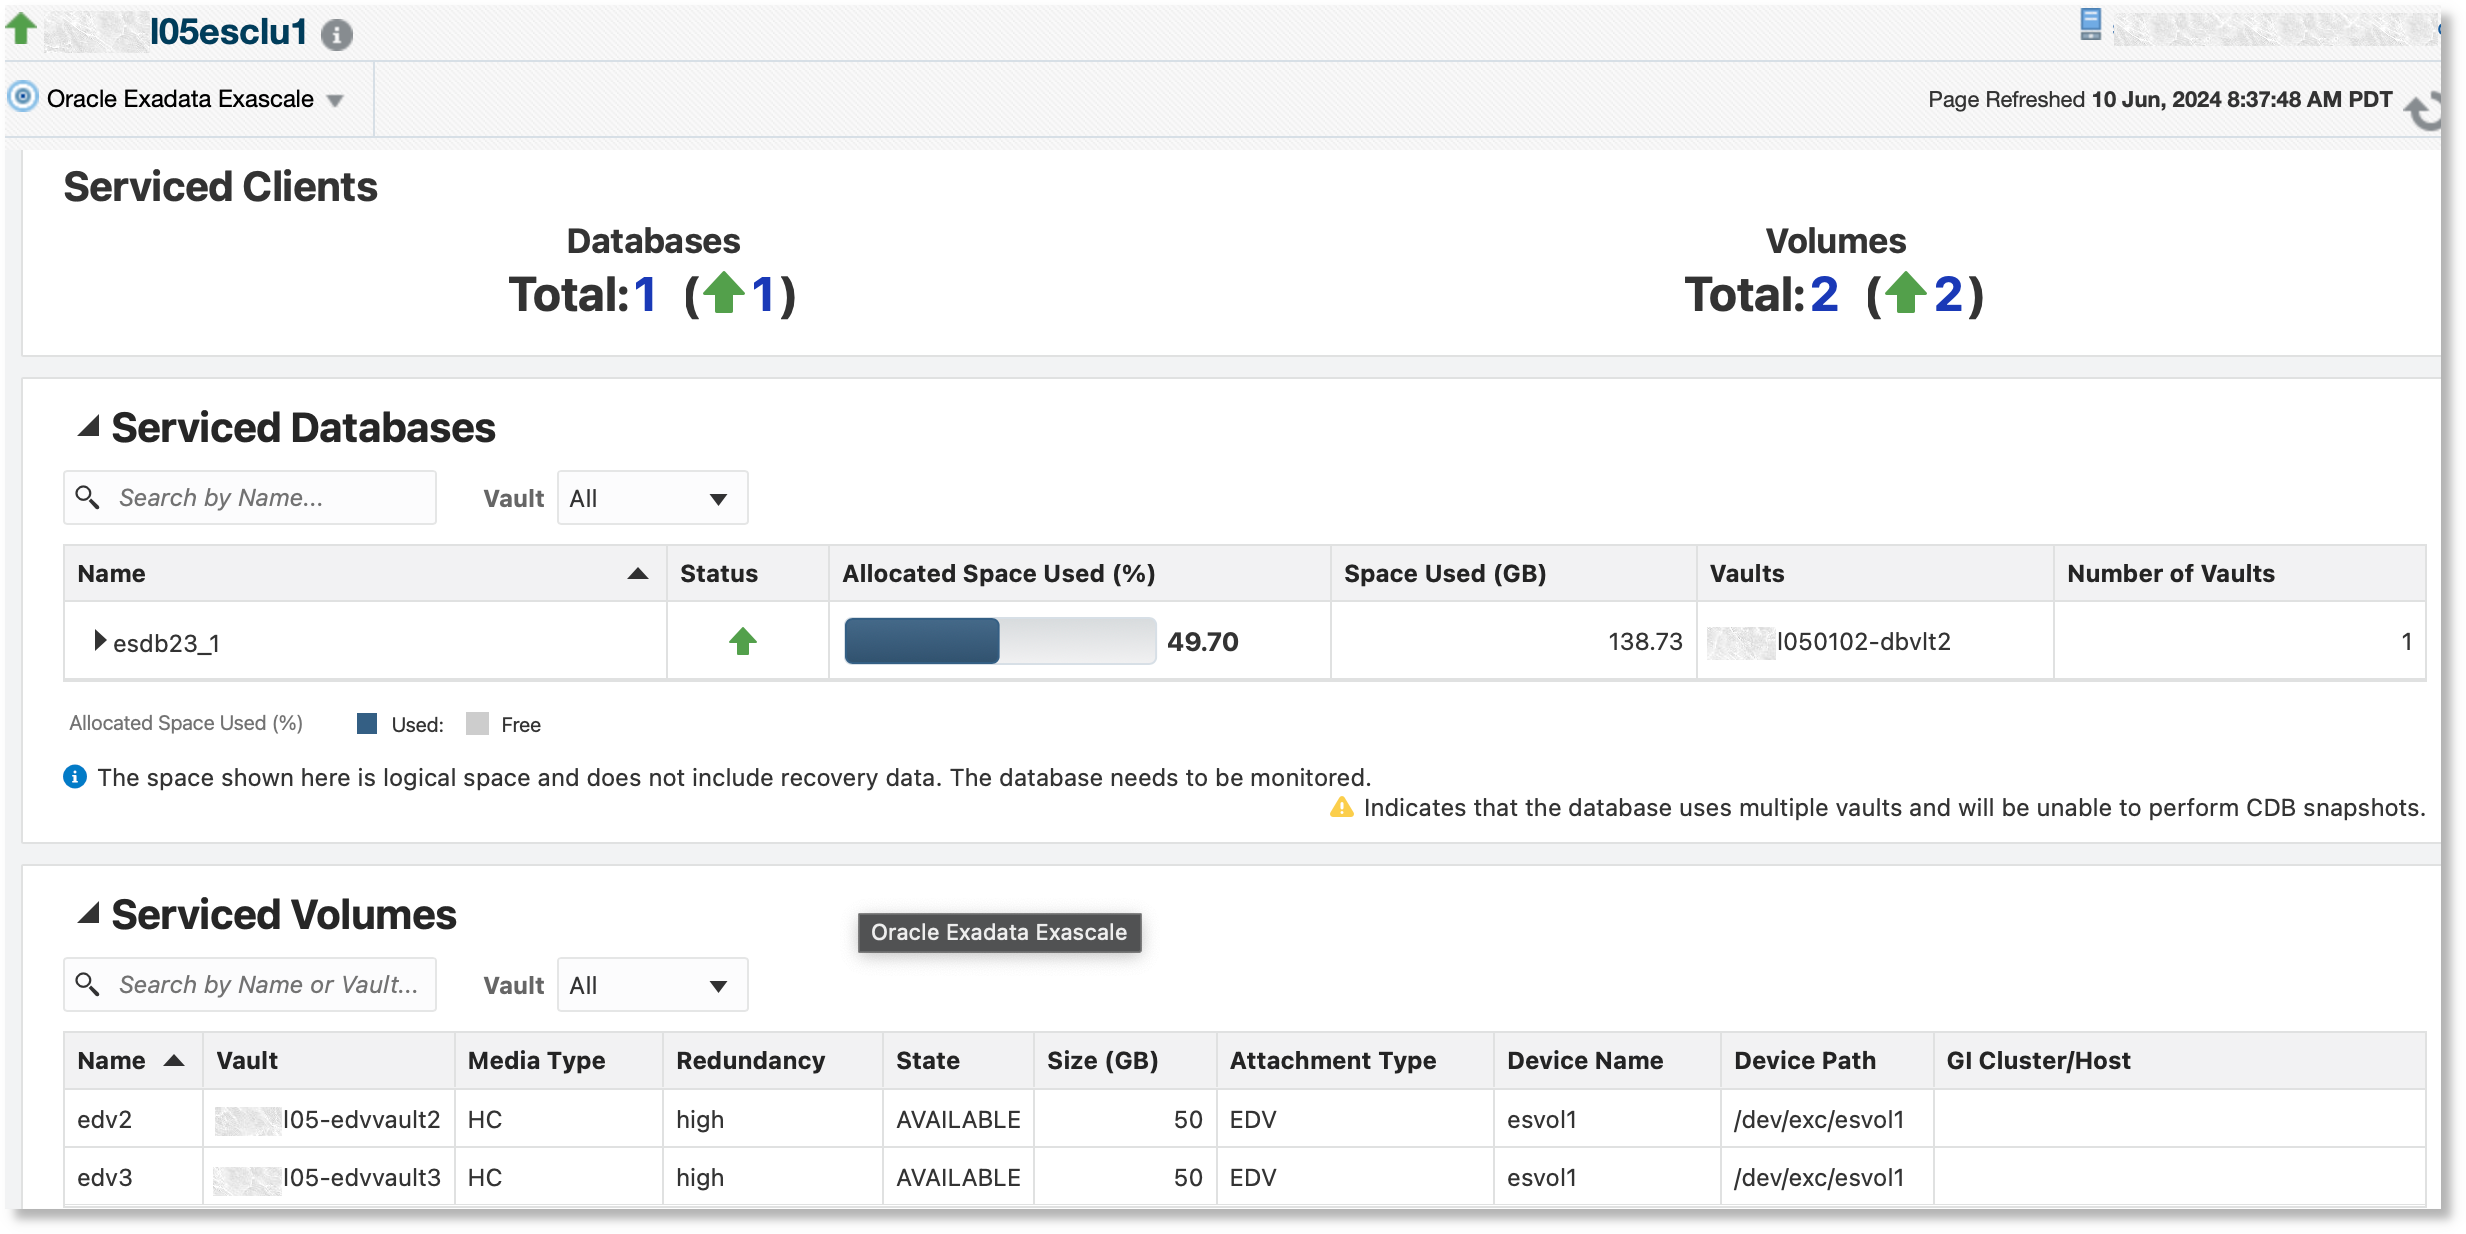
Serviced Clients
The Serviced Clients tab has three sections:
- Serviced Clients: This section contains an overview of the Exascale
clients that includes the following information:
- Databases: The number of databases provisioned on this Exascale and their status. This data includes all client databases regardless of whether they are monitored by Oracle Enterprise Manager.
- Volumes: The number of volumes and the count by availability
- Serviced Databases: This section contains a table listing all
databases provisioned on this Exascale along with the following information:
- Status: Database availability status in Oracle Enterprise Manager
- Allocated Space Used: Space used by the database client as a percentage of the allocated space
- Space Used (GB): Space used by database client in GB
- Vaults: The name of the vaults where the database datafiles are stored
- Number of Vaults: The number of vaults used by the database. Oracle recommends that a database uses a single vault. A warning icon is displayed next to databases that use more than one vault.
The table can be filtered by database target name and/or vault name.
- Serviced Volumes: This section contains a table listing
volumes that have been created from the vaults along with following
information:
- Media Type: The media type of the volume - HC, EF, NULLDEVICE, or RAMDEVICE
- Redundancy: The redundancy of the volume - high (3-way mirroring), normal (2-way mirroring), or none
- State: The state of the volume - UNAVAILABLE, AVAILABLE, DELETING, DELETED, ATTACHING, or DETACHING
- Size: The size of the volume in GB
- Attachment Type: The attachment type of the volume - EDV or iSCSI
- Device Name: The name of the storage device associated with the attachment, shown only for EDV attachment type
- Device Path: The absolute path of the storage device on the EDV node, shown only for EDV attachment type
- GI Cluster/Host: The name of the cluster that contains the EDV attachment or name of the host associated with the attachment
The table can be filtered by volume name and/or vault name.
Performance
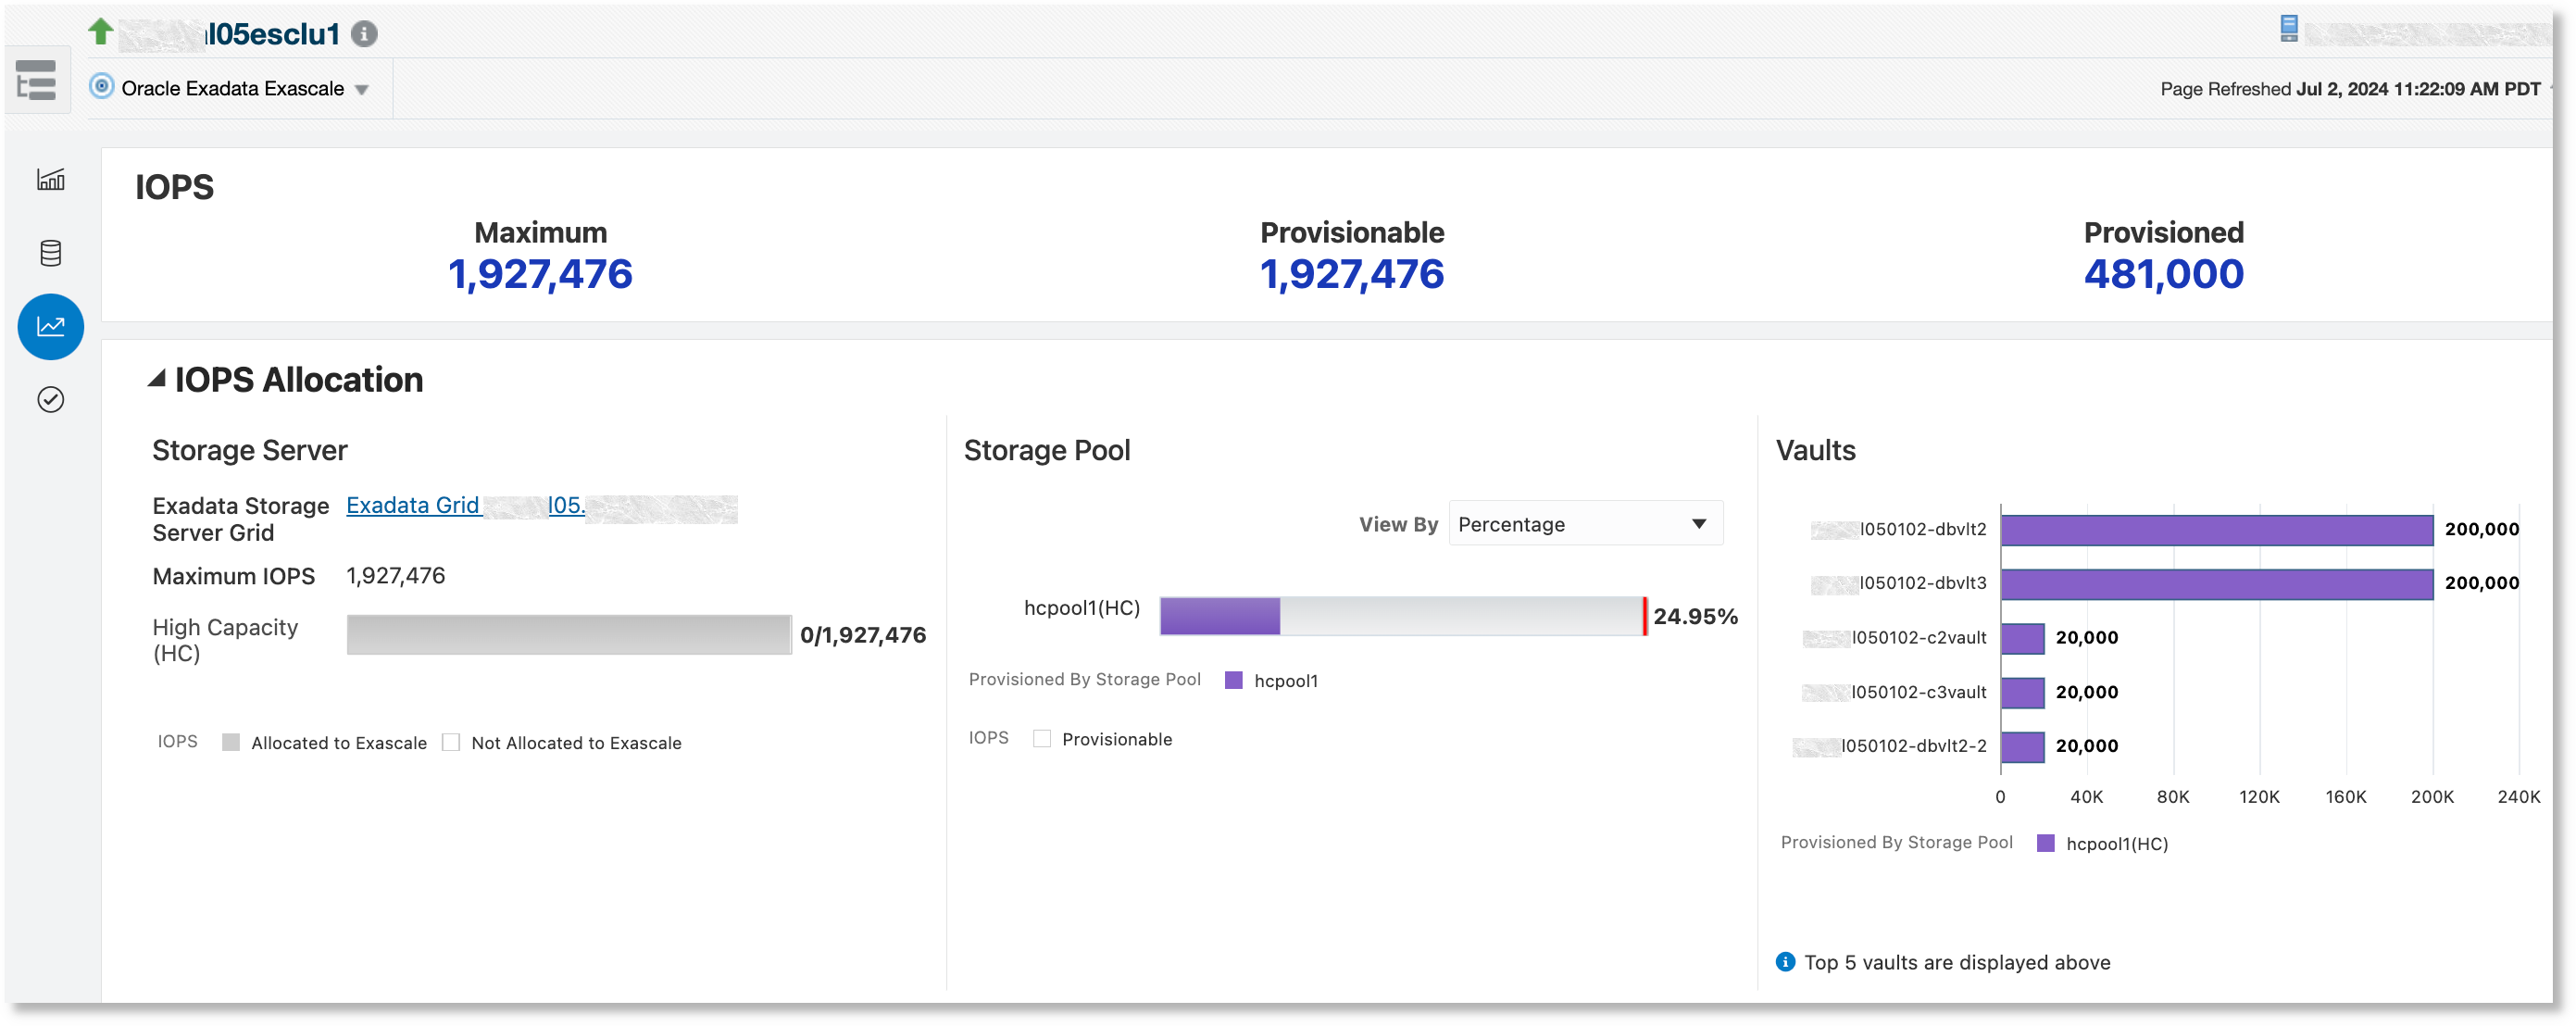
The Performance tab has two monitoring sections:
- IOPS: This section displays an overview of IOPS
provisioning, including the following information:
- Maximum IOPS: The maximum IOPS available for the Exascale
- Provisionable IOPS: The IOPS that can be provisioned while creating new vaults
- Provisioned IOPS: The IOPS that are already provisioned
- IOPS Allocation: This section displays performance information in terms
of the maximum IOPS, the IOPS that are provisioned by storage pools to vaults,
and the IOPS used by clients:
- Storage Server: The maximum IOPS per media type available with the storage servers that can be used by Exascale
- Storage Pool: Shows the IOPS per media type provisioned to the vaults by percentage and absolute values. The media type is color-coded.
- Vaults: Shows how IOPS are provisioned for the vaults. IOPS for vaults can be provisioned from more than one storage pool. The media type is color-coded using the same colors as the storage pool charts.
Incidents and Compliance
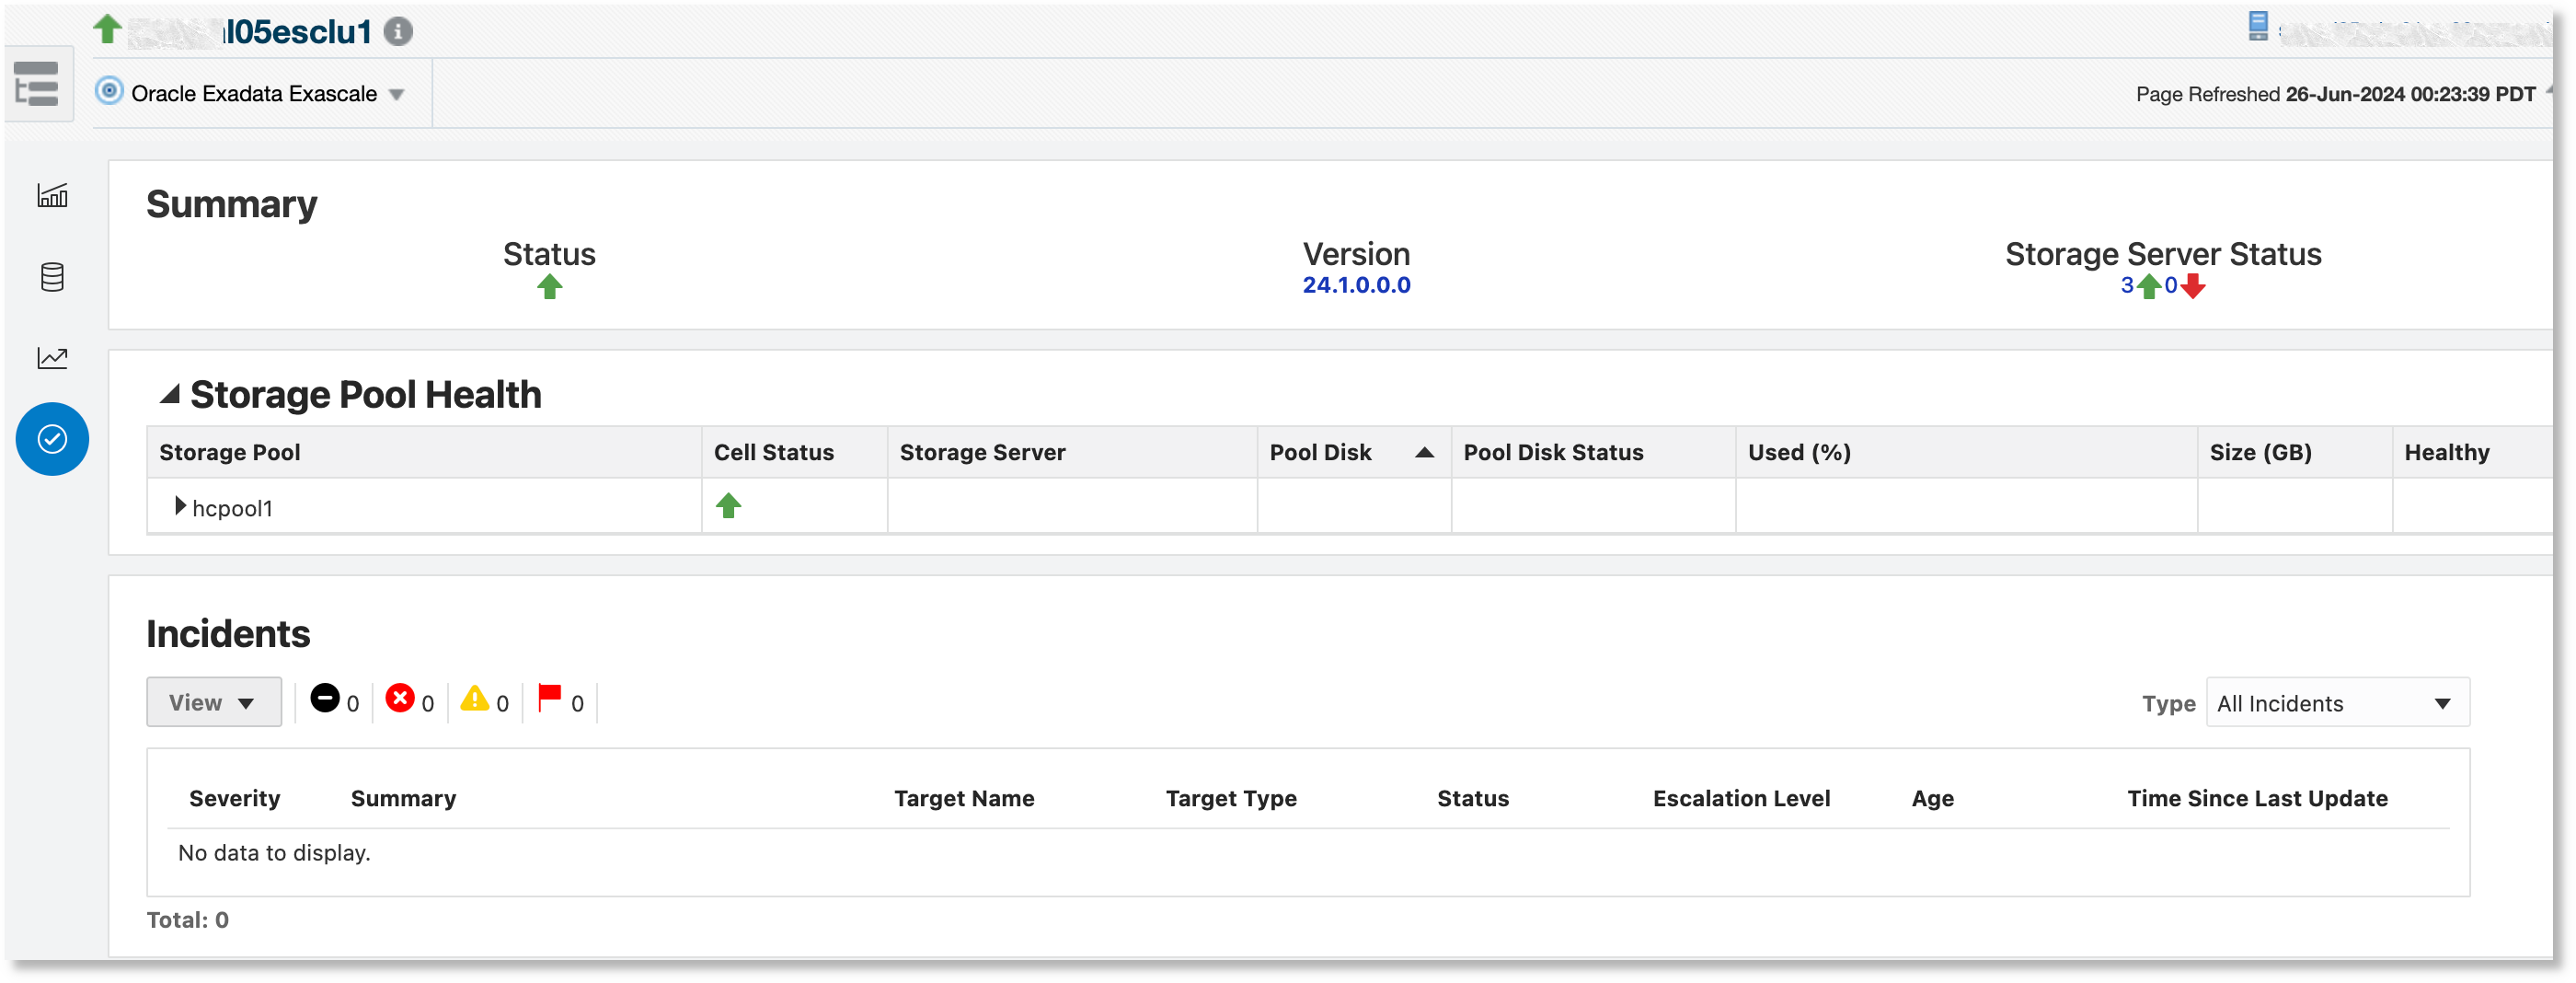
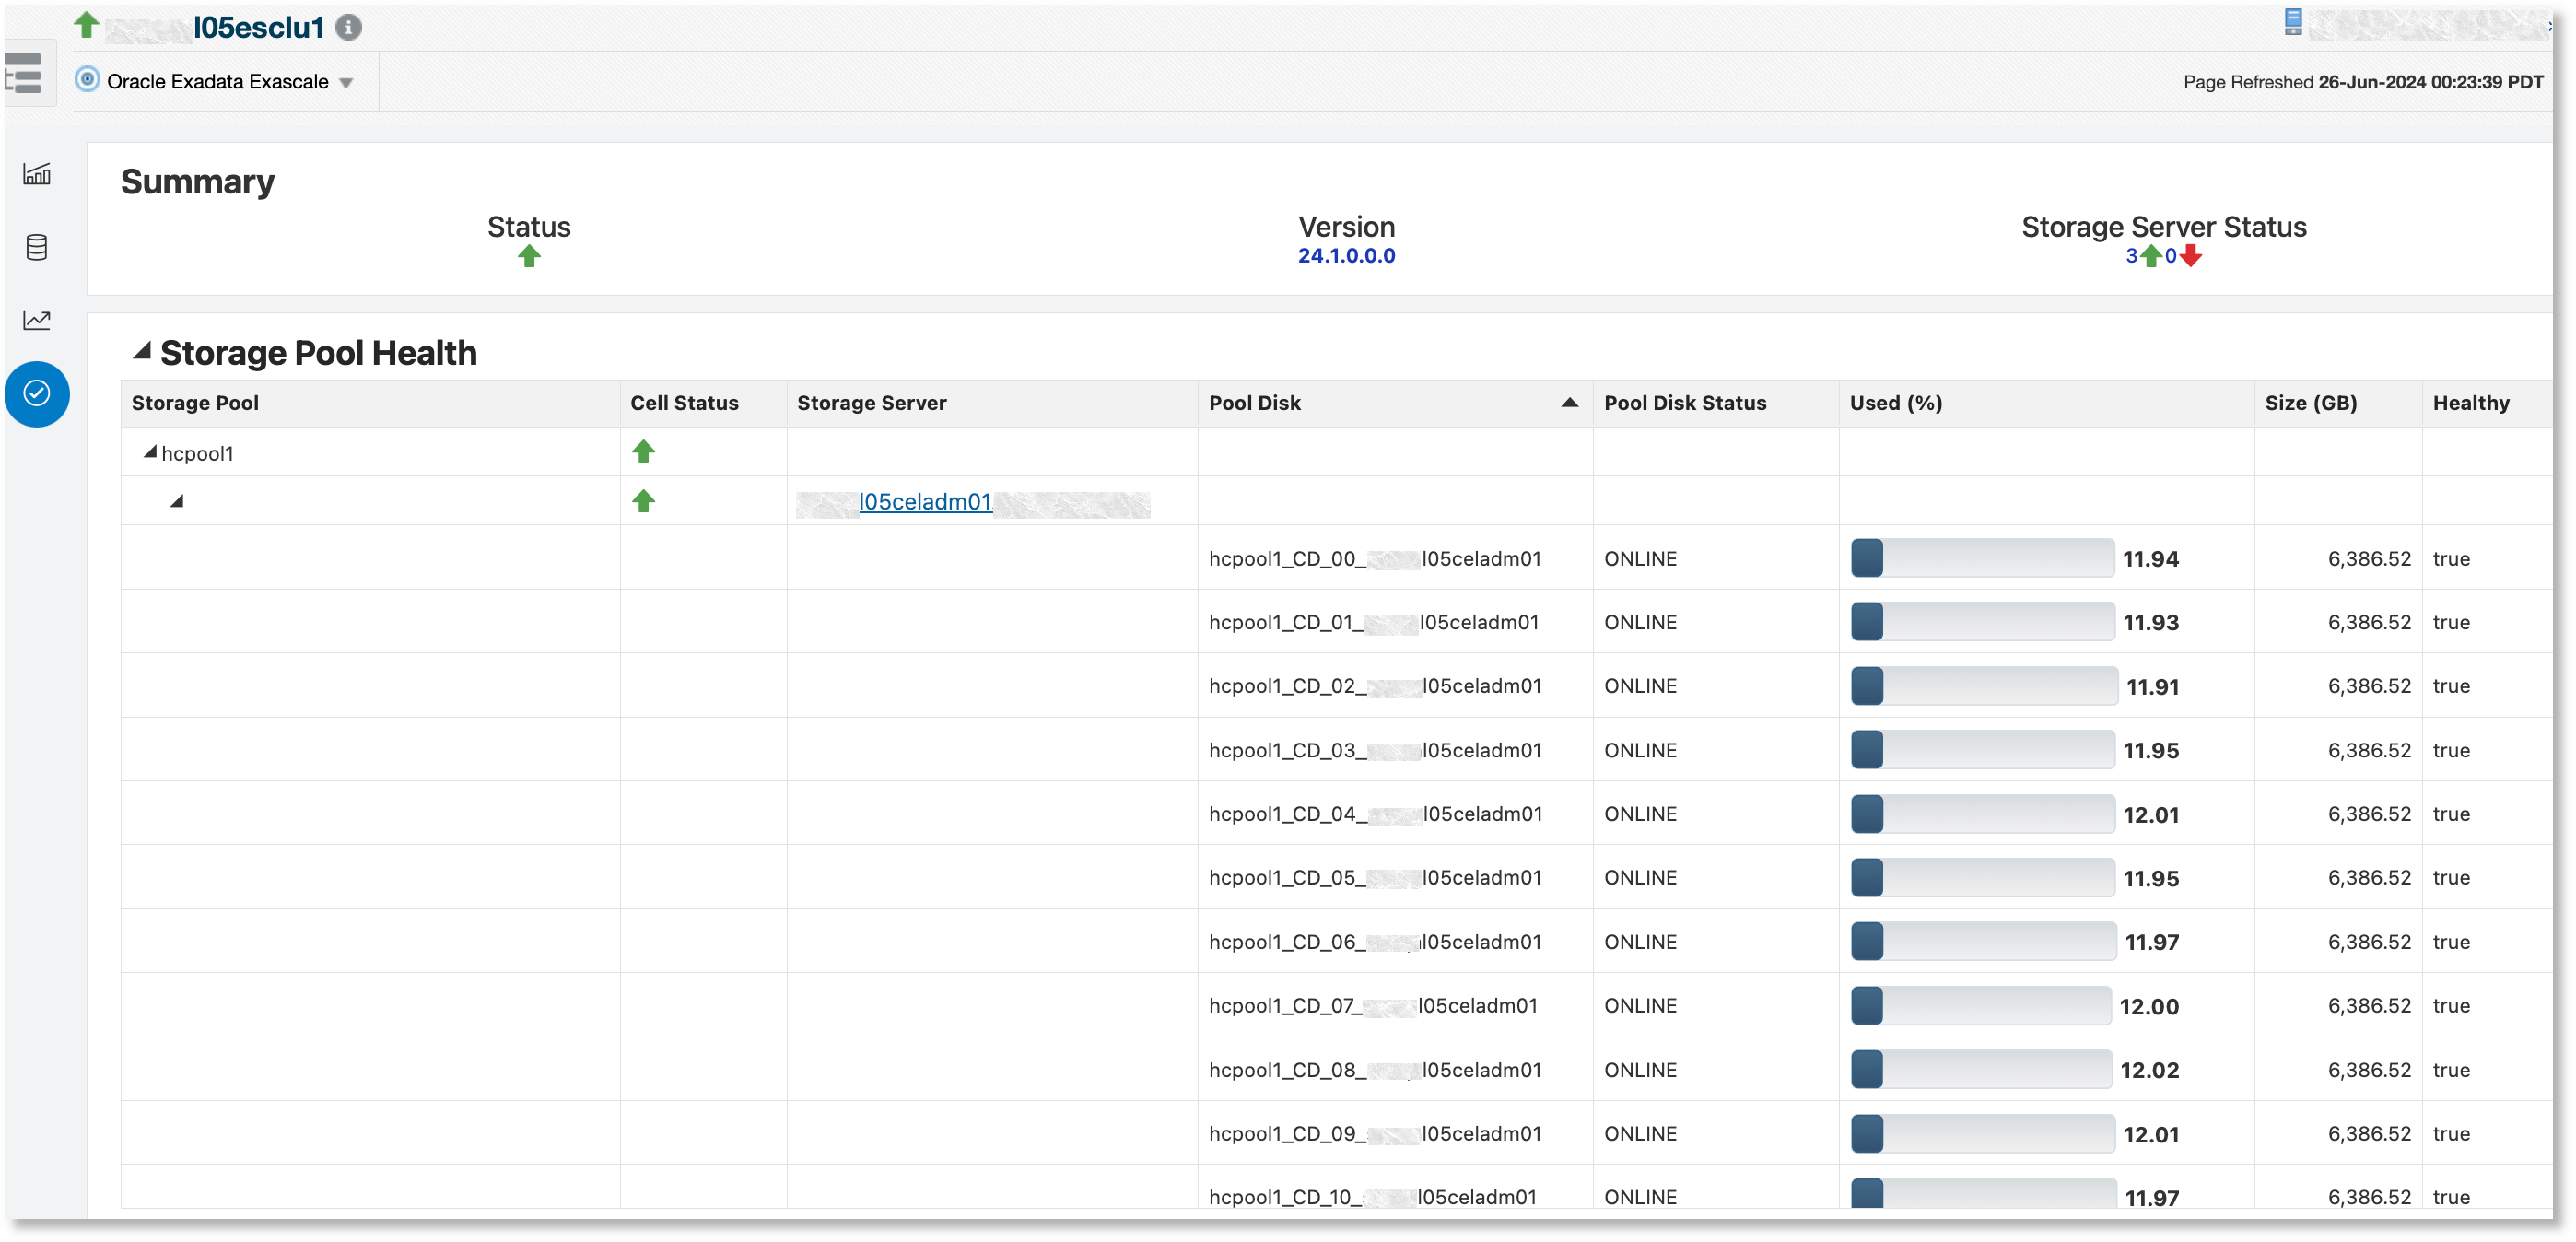
The Incidents and Compliance tab has three sections:
- Summary: This section displays a status summary for the Exascale target,
including the following information:
- Status: The status of the Exascale cluster
- Version: The release version of the Exadata system software
- Storage Server Status: The status of the storage servers that provision pool disks to the Exascale storage pool
- Storage Pool Health: This section displays a tree table with storage
pools as the root, which can be expanded to show all the storage servers that
provision pool disks for the storage pool. It can be expanded further to display
the individual pool disks. The tree table displays the following information:
- Cell Status: The status of the Exadata storage server target
- Storage Server: The storage server that provisions the pool disk
- Pool Disk: The name of the pool disk provisioned to the storage pool
- Pool Disk Status: The status of the pool disk
- Used (%): The pool disk storage used percentage
- Size (GB): The size of the pool disk
- Healthy: Health of the pool disk
- Incidents: This section contains a table showing all the incidents
related to the Exascale target.
