2 ATS Framework Features
This chapter describes ATS Framework features.
The following table lists ATS framework features supported by different NFs:
Table 2-1 ATS Framework Features Compliance Matrix
| Features | BSF | NRF | NSSF | Policy | SCP | SEPP | UDR |
|---|---|---|---|---|---|---|---|
| ATS API | Yes | Yes | No | Yes | No | Yes | Partially compliant (In starting jobs, executing all test cases is only supported) |
| ATS Custom Abort | Yes | Yes | Yes | Yes | Yes | Yes | Yes |
| ATS Feature Activation and Deactivation | Yes | No | No | Yes | No | Yes | Yes |
| ATS GUI Enhancements | Yes | Yes | Yes | Yes | Yes | Yes | Yes |
| ATS Health Check | Yes | No | No | Yes | Yes | Yes | Yes |
| ATS Jenkins Job Queue | Yes | No | No | Yes | Yes | Yes | Yes |
| Application Log Collection | Yes | No | No | Yes | Yes | Yes | Yes |
| ATS Maintenance Scripts | Yes | Yes | Yes | Yes | Yes | Yes | Yes |
| ATS System Name and Version Display on Jenkins GUI | Yes | Yes | Yes | Yes | Yes | Yes | Yes |
| ATS Tagging Support | No | No | No | Yes | Yes | Yes | No |
| Custom Folder Implementation | Yes | Yes | Yes | Yes | Yes | Yes | Yes |
| Health Check | Yes | No | Yes | Yes | No | Yes | Yes |
| Individual Stage Group Selection | Yes | No | No | Yes | Yes | Yes | No |
| Lightweight Performance | No | No | No | No | No | No | Yes |
| Managing Final Summary Report, Build Color, and Application Log | Yes | Partially compliant (Application Log is not supported.) | Yes | Yes | Yes | Yes | Yes |
| Modifying Login Password | Yes | Yes | Yes | Yes | Yes | Yes | Yes |
| Multiselection Capability for Features and Scenarios | Yes | Partially compliant (Feature level selection is supported) | No | Yes | Partially compliant (Feature level selection is supported) | Partially compliant (Feature level selection is supported) | Partially compliant (Feature level selection is supported) |
| Parallel Test Execution | Partially compliant (Parallel Test Execution Framework integrated, but only supports sequential execution) | No | Partially compliant (Parallel Test Execution Framework integrated, but only supports sequential execution) | Yes | Yes | Partially compliant (Parallel Test Execution Framework integrated, but ATS test cases need to be organized to utilize the parallel execution) | Yes (UDR, SLF, and EIR) |
| Parameterization | Yes | Partially compliant (Supports only new features) | No | Yes | Yes | Yes | Yes |
| PCAP Log Collection | No | No | No | No | Yes | Yes | Yes |
| Persistent Volume | Yes | Yes | Yes | Yes | Yes | Yes | Yes |
| Single Click Job Creation | Yes | Yes | Yes | Yes | Yes | Yes | Yes |
| Support for ATS Deployment in OCI | No | No | No | No | Yes | Yes | No |
| Support for Transport Layer Security | No | No | No | No | Yes | Yes | No |
| Test Result Analyzer | Yes | Yes | Yes | Yes | Yes | Yes | Yes |
| Test Case mapping and Count | Yes | No | No | Yes | Yes | Yes | Yes |
2.1 ATS API
- Start: To initiate one of the three test suites, such as Regression, New Features, or Performance.
- Monitor: To obtain the progress of a test suite's execution.
- Stop: To cancel an active test suite.
- Get Artifacts: To retrieve the JUNIT format XML test result files for a completed test suite.
For more information about configuring the tasks, see Use the RESTful Interfaces.
2.1.1 Generating an API Token for a User
An API token that has to be generated for the user to perform routine ATS tasks using the Restful Interfaces API. Any API call requires the use of an API token for authentication. You can generate the API token, and it works until it is revoked or deleted.
Perform the following procedure to generate an API token for a user:
- Log in to Jenkins as an NF API user to generate an API token.
Figure 2-1 ATS Login Page

- Click the user name in the upper right corner of the GUI, and then click
Security.
Figure 2-2 Add Token

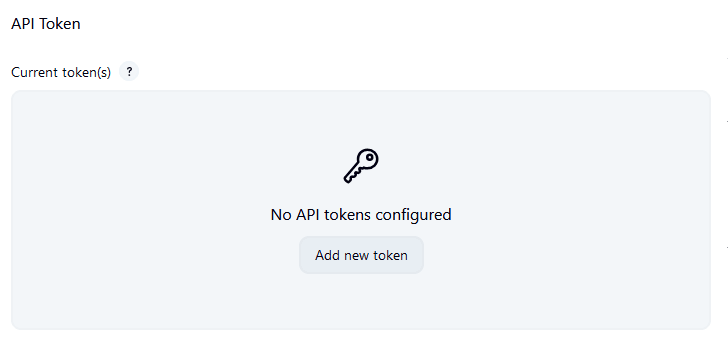
- In the API Token section, click Add new token.
Figure 2-3 Add New Token
- Enter a suitable name for the token, such as policy, and then click
Generate.
Figure 2-4 Generate Token

- Copy and save the generated token.
You cannot retrieve the token after closing the prompt.
Figure 2-5 Save Generated Token

- Click Save.
An API token is generated and can be used for starting, monitoring, and stopping a job using the REST API.
2.1.2 Use the RESTful Interfaces
This section provides an overview of each RESTful interface.
2.1.2.1 Configuring Host
The host to access the ATS GUI will remain the same in non-OCI setup.
For OCI Setup
The following two ways are supported to access the ATS API in OCI:
- Add proper Ingress/Egress security rules for ATS API port (5001) and ATS service nodeport corresponding to ATS API port in loadbalancer (nf_lb_subnet) and node subnet (nf_node_subnet). To add ingress and egress security rules, see the Adding Ingress and Egress Rules to Access the OCI Console section.
- If this step is not performed to access GUI, then insert the
following annotations under the Metadata section to
assign an external IP (Loadbalancer
IP):
oci-network-load-balancer.oraclecloud.com/security-list-management-mode: None oci.oraclecloud.com/load-balancer-type: nlb - Edit and save the ATS service after ATS deployment:
For example,
kubectl edit svc ats-service-name -n ats-namespace - Access the GUI using URL:
<http/https>://<Loadbalancer
                        IP>:5001
Note:
The assignment of Loadbalancer IP to the ATS service is subject to availability. If the Loadbalancer IP is not assigned to the ATS service even after applying the required annotations, try to debug on the OCI side.
- Add an ingress security rule for the node subnet (nf_node_subnet) to allow TCP traffic on all ports from the operator subnet. To add ingress and egress security rules, see the Adding Ingress and Egress Rules to Access the OCI Console section.
- Run the following ssh tunneling command from a bash terminal on your local
PC:
ssh -f -N -i <operator instance private key> -o StrictHostKeyChecking=no -o ProxyCommand="ssh -i <bastion private key> -o StrictHostKeyChecking=no -W %h:%p <bastion username>@<bastion IP>" <operator instance username>@<operator instance IP> -L <desired system port>:<Worker Node IP>:<ATS API NodePort> -o ServerAliveInterval=60 -o ServerAliveCountMax=300For example,
ssh -f -N -i id_rsa -o StrictHostKeyChecking=no -o
                            ProxyCommand="ssh -i id_rsa -o StrictHostKeyChecking=no -W %h:%p
                            opc@129.287.66.123" opc@10.1.76.7 -L 5009:10.9.60.118:32018 -o
                            ServerAliveInterval=60 -o ServerAliveCountMax=300
Here, ATS GUI URLis http://localhost:5009
TROUBLESHOOTING
If the ATS API returns an error stating "Network is unreachable," ensure that there is a proper ingress security rule in the loadbalancer subnet (nf_lb_subnet) allowing traffic from the system where the ATS API is being utilized.
2.1.2.2 Starting Jobs
- Default Jenkins API: The default Jenkins API to start a pipeline job
- Custom API: To start a job forcibly
- Run the following command to start a job (Default Jenkins
method):
curl --request POST <Jenkins_host_port>/job/<Pipeline_name>/buildWithParameters –user
      <username>:<API_token> --verbose
When theatsGuiTLSEnabledparameter is set to true:curl --request POST <Jenkins_host_port>/job/<Pipeline_name>/buildWithParameters --user <username>:<API_token> --verbose --cacert <path_to_root_certificate>For example,curl --request POST http://10.123.154.163:30427/job/Policy-NewFeatures/buildWithParameters --user policyapiuser:111ad02d7471cec9ca689696e9c7a55c62 --verboseWhen theatsGuiTLSEnabledparameter is set to true:curl --request POST https://10.75.217.25:30301/job/SCP-Regression/buildWithParameters --user scpapiuser:11c2fde49cea6eb8f332ad23a7877ea2de --verbose --cacert caroot.cer
Starting a Job Forcibly using Custom API
If another job is already running and has not been started by an API user, the running job is aborted, along with all other jobs in the queue that have not been started by an API user, and a new job is started.
If the running job is started by the API user, the new job does not start, and the start job request fails, returning a message in response: Build <job_id> of pipeline <pipeline_name> is already running, triggered by an API user.
Builds are aborted gracefully by a forceful API, such as when a running scenario completes its execution and cleanup before the corresponding build is aborted.
The forceful API now returns an
aborted-builds parameter in response, which contains job IDs
for all the aborted builds. It also returns a parameter called
cancelled_builds_in_queue, which contains queue IDs for all the
builds aborted in queue.
If a job ID is assigned to a build in queue, it contains a list of two values: [queueid, jobid] rather than just the queue ID.
Run the following command to start a job forcibly:
curl -s --request POST <Startjob_host_port>/build -H "Content-Type: application/json" -d '{"pipelineName": "<Pipeline_name>", "pageAndQuery": "<pageAndQuery>"}' --user <username>:<token> --verboseatsGuiTLSEnabled parameter is set to
true:curl -s --request POST
<Startjob_host_port>/build -H "Content-Type: application/json" -d '{"pipelineName": "<Pipeline_name>", "pageAndQuery":
"<pageAndQuery>"}' --user <username>:<token> --verbose
--cacert <path_to_root_certificate>curl --request POST http://10.75.217.25:31170/build -H "Content-Type: application/json" -d
'{"pipelineName": "Policy-Regression",
"pageAndQuery": "buildWithParameters"}'
--user policyapiuser:11c1a628f808972c846c510151afa13ba2 --verboseatsGuiTLSEnabled parameter is set to
true:curl --request POST https://10.75.217.25:30170/build -H "Content-Type: application/json" -d
'{"pipelineName": "Policy-Regression",
"pageAndQuery": "buildWithParameters"}'
--user policyapiuser:11c1a628f808972c846c510151afa13ba2 --verbose --cacert
caroot.cerTable 2-2 API Parameters
| Parameters | Mandatory | Default Value | Description |
|---|---|---|---|
| username | YES | NA | This parameter indicates the name of API user. |
| token | YES | NA | This parameter indicates the API token for API user. |
| Startjob_host_port | YES | NA | This parameter's format is
<host>:<port>
|
| pipelineName | YES | NA | This parameter indicates the name of the pipeline for which build is to be triggered. |
| pageAndQuery | YES | NA | This parameter can have two values:
|
| jenkins_wait_time | NO | 5 | This parameter indicates the wait time for
Jenkins in seconds.
|
Customizing Job Parameters
paramx=valuex.
- Append
paramx=valuetobuildWithParameters?.Example 1,
curl --request POST 10.75.217.40:31378/job/Policy-NewFeatures/buildWithParameters?paramx=valuex --user
      policyapiuser:110ed65222b9e63445689314998ff8c3bk -- verbose
Example 2,
curl --request POST 10.75.217.4:32476/build -H "Content-Type: application/json" -d '{ "pipelineName": "Policy-NewFeatures", "pageAndQuery": "buildWithParameters?paramx=valuex" }'--user <username>:<token> -–verbose - To add more than 1 parameter, such as
paramx=valuexandparamy=valuey, append the other parameters to the API call using&.Example 1,
curl --request POST 10.75.217.40:31378/job/Policy-NewFeatures/buildWithParameters?paramx=valuex¶my=valuey --user policyapiuser:110ed65222b9e63445689314998ff8c3bk -- verboseExample 2,
curl --request POST 10.75.217.4:32476/build -H "Content-Type: application/json" -d '{"pipelineName": "Policy-NewFeatures", "pageAndQuery": "buildWithParameters?paramx=valuex¶my=valuey" }' --user <username>:<token> --verbose - Replace
buildWithParameters?withbuildfor non-parametrized pipeline jobs. - Start the pipeline by using the default Jenkins API or by
changing the pageAndQuery parameter's value to build in the following
way:
curl --request POST <Jenkins_host_port>/job/<Pipeline_name>/build --user <username>:<API_token> --verboseExample 1,
curl --request POST 10.75.217.40:31378/job/Policy-NewFeatures/build --user policyapiuser:110ed65222b9e63445689314998ff8c3bk --
      verbose
Example 2,
curl --request POST 10.75.217.4:32476/build -H "Content-Type: application/json" -d '{
      "pipelineName": "Policy-NewFeatures", "pageAndQuery": "build" }'--user <username>:<token> –verbose
curl --request
 POST <IP>:<PORT>/build -H
 "Content-Type: application/json" -d '{"pipelineName": "<NF PIPELINE>", "pageAndQuery": "buildWithParameters", "otherBuildParameters": { }}' --user
<NF>apiuser:<token> --verbose atsGuiTLSEnabled parameter is set to
true:curl --request POST <IP>:<PORT>/build \
-H "Content-Type: application/json" \
-d '{
"pipelineName": "<NF PIPELINE>",
"pageAndQuery": "buildWithParameters",
"otherBuildParameters": {
}
}' \
--user <NF>apiuser:<Token> \
--verboseNote:
The API continues to support the same functionality as in the previous release. In addition, to provide extended support, a new key "otherBuildParameters" has been introduced. This key can be included in the JSON payload sent to the server.Table 2-3 otherBuildParameters Details
| Parameter | Mandatory/Optional | Default Value | Description |
|---|---|---|---|
| otherBuildParameters | Optional | NA | "otherBuildParameters" is a dictionary of build
parameters. You can add key-value pairs to customize the build
process. For example:"otherBuildParameters" : {
"Features" : "YamlSchema_Import_Export,Custom_Jsons",
"Stages" : "stage2,stage3", "Groups" : { "stage1" :
"group1,group4", "stage4" : "group4,group5" } } This dictionary supports the following keys:
|
Note:
If none of the keys in "otherBuildParameters" are included in the API request, all the test cases with the given execution options will be triggered.Figure 2-6 Execution Option

- Example format for executing features, stages, scenarios, or
groups through the API
request:
curl --request POST <IP>:<PORT>/build \ -H "Content-Type: application/json" \ -d '{ "pipelineName": "<NF PIPELINE>", "pageAndQuery": "buildWithParameters", "otherBuildParameters": { "Features": "<Feature List>", "Stages": "<stages>", "Groups":{ "<stage-n>":"<group-a,group-b>","<stage-m>":"<group-p,group-q>" }, "Scenarios": "", "Featuresandscenarios": { "<Feature 1>": "<Scenario1>", "<Feature2>": "<Scenario1>,<Scenario2>" } } }' \ --user <NF>apiuser:<Token> \ --verbose - Example format for executing test cases based on provided tags.
If tags are specified, other keys such as "Features", "Scenarios", "Stages",
and so on, should not be
included.
curl --request POST <IP>:<PORT>/build \
  -H "Content-Type: application/json" \
  -d '{
    "pipelineName": "<NF PIPELINE>",
    "pageAndQuery": "buildWithParameters",
    "otherBuildParameters": {
      "Feature_Include_Tags": "<tags>",
      "Feature_Exclude_Tags": "<tags>",
      "Scenario_Include_Tags": "<Tags>",
      "Scenario_Exclude_Tags": "<Tags>"
    }
  }' \
  --user <NF>apiuser:<Token> \
  --verbose
Starting a job with otherBuildParameters
Execute Features
"otherBuildParameters" : { "Features" : "<Comma separated FeatureList>" }curl --request POST 10.75.217.25:30100/build \
-H "Content-Type: application/json" \
-d '{
"pipelineName": "Policy-Regression",
"pageAndQuery": "buildWithParameters",
"otherBuildParameters": {
"Features": "NF_Scoring,ManualGetDeleteSession_DeleteSelectivepcfBindingswithSUPI",
}
}' \
--user policyapiuser:11c1a628f808972c846c510151afa13ba2 \
--verboseExecute Scenarios
- Using "Scenarios" key
In the API request, the user can include all parameters such as SUT, Fetch_Log_Upon_Failure, and so on, under the "pageAndQuery" key. Scenarios can be specified in the request using the "otherBuildParameters" dictionary as follows:
"otherBuildParameters" : { "Scenarios" : "<Comma separated Scenarios List>" }For example:curl --request POST 10.75.217.25:30100/build \ -H "Content-Type: application/json" \ -d '{ "pipelineName": "Policy-Regression", "pageAndQuery": "buildWithParameters", "otherBuildParameters": { "Scenarios": "Re_Import_YamlSchema_Verify_SMPolicy,AM_Terminate_Notify_Timeout,AM_Notify_With_Header_Timeout" } }' \ --user policyapiuser:11c1a628f808972c846c510151afa13ba2 \ --verbose - Using "Featuresandscenarios" key
The API request allows the user to include all parameters such as SUT, Fetch_Log_Upon_Failure, and so on, using the "pageAndQuery" key. Scenarios can be specified within the "otherBuildParameters" dictionary, as follows:
"otherBuildParameters" : { "Featuresandscenarios" : { "<Feature -1>" : "<Comma separated scenarios from Feature -1>" , "Feature -2" : "<Comma separated scenarios from Feature -2>" } }For example:curl --request POST 10.75.217.25:30100/build \ -H "Content-Type: application/json" \ -d '{ "pipelineName": "Policy-Regression", "pageAndQuery": "buildWithParameters", "otherBuildParameters": { "Featuresandscenarios":{ "YamlSchema_Import_Export" : "Re_Import_YamlSchema_Verify_SMPolicy" } } }' \ --user policyapiuser:11c1a628f808972c846c510151afa13ba2 \ --verbose
Execute Stages
"otherBuildParameters" : { "Stages" : "<Comma separated Stages list>" }curl --request POST 10.75.217.25:30100/build \
-H "Content-Type: application/json" \
-d '{
"pipelineName": "Policy-Regression",
"pageAndQuery": "buildWithParameters?Configuration_Type=Custom_Config",
"otherBuildParameters": {
"Stages" : "stage2,stage4"
}
}' \
--user policyapiuser:11c1a628f808972c846c510151afa13ba2 \
--verboseExecute Groups
"otherBuildParameters" : { "Groups" : {  "<stage n>" : "<Comma
    separated Groups List from stage n>", "<stage m>" : "<Comma  separated Group list from
stage m>" } }curl --request POST 10.75.217.25:30100/build \
-H "Content-Type: application/json" \
-d '{
"pipelineName": "Policy-Regression",
"pageAndQuery": "buildWithParameters",
"otherBuildParameters": {
"Groups":{"stage1":"group1" , "stage2" : "group3,group6"}
}
}' \
--user policyapiuser:11c1a628f808972c846c510151afa13ba2 \
--verboseeExecute with Tags
In the API request, the user can specify all parameters such as SUT, Fetch_Log_Upon_Failure, and so on, using the "pageAndQuery" key. When using tags, it is mandatory to include "FilterWithTags" in the "pageAndQuery". If tags are provided by the user, any other parameters such as features, scenarios, stages, or groups will not be considered. Only tags will be considered as input.
"otherBuildParameters": { "Feature_Include_Tags":"<tags>", "Feature_Exclude_Tags":"<tags>", "Scenario_Include_Tags":"<Tags>" , "Scenario_Exclude_Tags":"<Tags>" }Note:
The provided tags must be separated by commas.curl --request POST 10.75.217.25:30100/build \
-H "Content-Type: application/json" \
-d '{
"pipelineName": "Policy-Regression",
"pageAndQuery": "buildWithParameters",
"otherBuildParameters": {
"Feature_Include_Tags":"cne-common,cm-service", "Scenario_Include_Tags":"cleanup,sanity"
}
}' \
--user policyapiuser:11c1a628f808972c846c510151afa13ba2 \
--verboseNote:
The API behaves in a manner similar to that of the UI. For instance, when running a set of scenarios, the user selects them, and only those chosen are executed upon triggering the build. If any stages, groups, or features are also selected in the features section, they are ignored. Similarly, if stages, groups, or features are included alongside scenarios in the API request, only the scenarios will be executed.2.1.2.3 Monitoring Jobs
This Default Jenkins API is used to monitor the progress of the job that was started.
- A qid is obtained from the Location header in the
response for
starting a job. The first API uses this qid to get queue status about the corresponding job, including its job_id. - The second API uses the job_id to obtain further information about the job status.
curl --request POST
                            <Jenkins_host_port>/queue/item/<qid>/api/json --user
                            <username>:<API_token> --verbose
When theatsGuiTLSEnabledparameter is set to true:curl --request POST <Jenkins_host_port>/queue/item/<qid>/api/json --user <username>:<API_token> --verbose --cacert <path_to_root_certificate>For example,curl --request POST http://10.123.154.163:30427/queue/item/5/api/json--user policyapiuser:111ad02d7471cec9ca689696e9c7a55c62 --verboseWhen theatsGuiTLSEnabledparameter is set to true:curl --request POST https://10.75.217.25:30301/queue/item/27/api/json --user scpapiuser:11c2fde49cea6eb8f332ad23a7877ea2de --verbose --cacert caroot.cercurl --request POST <Jenkins_host_port>/job/<Pipeline_name>/<job_id>/api/json --user <username>:<API_token> --verboseWhen theatsGuiTLSEnabledparameter is set to true:curl --request POST <Jenkins_host_port>/job/<Pipeline_name>/<job_id>/api/json --user <username>:<API_token> --verbose --cacert<path_to_root_certificate>For example,curl --request POST http://10.123.154.163:30427/job/Policy-NewFeatures/3/api/json--user policyapiuser:111ad02d7471cec9ca689696e9c7a55c62 --verboseWhen theatsGuiTLSEnabledparameter is set to true:curl --request POST https://10.75.217.25:30301/job/SCP-Regression/2/api/json --user scpapiuser:11c2fde49cea6eb8f332ad23a7877ea2de --verbose --cacert caroot.cer
Figure 2-7 Monitoring a Job

2.1.2.4 Stopping Jobs
Stop API is used to stop the currently running job using its job_id. It is also a default Jenkins API.
Stopping a Job
curl --request POST
      <Jenkins_host_port>/job/<Pipeline_name>/<job_id>/stop  --user <username>:<API_token>
--verboseatsGuiTLSEnabled parameter is set to
true:curl --request POST
<Jenkins_host_port>/job/<Pipeline_name>/<job_id>/stop --user <username>:<API_token> --verbose –cacert
<path_to_root_certificate>curl --request POST http://10.75.217.4:31881/job/UDR-Regression/21/stop --user
udrapiuser:1139a72213e0a686972cbff4a2f9333a9f --verboseatsGuiTLSEnabled parameter is set to
true:curl --request POST https://10.75.217.25:30301/job/SCP-Regression/2/stop --user
scpapiuser:11c2fde49cea6eb8f332ad23a7877ea2de --verbose --cacert caroot.cerNote:
- If the rerun count is greater than zero, the job must be stopped twice.
- This Stop API call does not abort the build gracefully.
curl --request POST
      <Stopjob_host_port>/job/<Pipeline_name>/<job_id>/stop  --user <username>:<API_token>
--verboseatsGuiTLSEnabled parameter is set to
true:curl --request POST
<Stopjob_host_port>/job/<Pipeline_name>/<job_id>/stop --user <username>:<API_token> --verbose --cacert
<path_to_root_certificate>curl --request POST http://10.75.217.4:32476/job/UDR-Regression/21/stop --user
udrapiuser:1139a72213e0a686972cbff4a2f9333a9f --verboseatsGuiTLSEnabled parameter is set to
true:curl --request POST https://10.75.217.25:30170/job/SCP-Regression/2/stop --user
scpapiuser:11c2fde49cea6eb8f332ad23a7877ea2de --verbose --cacert caroot.cerTable 2-4 Stop API Details
| Parameter | Mandatory | Default Value | Description |
|---|---|---|---|
| userName | Yes | NA | Name of API user |
| token | Yes | NA | The API token for the API user |
| Stopjob_host_port | Yes | NA | Format is <host>:<port>
|
| pipelineName | Yes | NA | Name of the pipeline for which build is to be stopped |
| immediate | No | False | To stop the build immediately, send a query
parameter ("immediate=true") with API call.
For
example,
|
2.1.2.5 Getting Test Suite Artifacts
Default Jenkins API is used to get the JUNIT-formatted XML test result files for a completed test suite.
- For getting an overall build summary
- For getting a JUNIT XML test result file for every feature file that ran
curl --request POST <Jenkins_host_port>/job/<Pipeline_name>/<job_id>/testReport/api/xml?exclude=testResult/suite --user <username>:<API_token> --verboseatsGuiTLSEnabled parameter is set to
true:curl --request POST
<Jenkins_host_port>/job/<Pipeline_name>/<job_id>/testReport/api/xml?exclude=testResult/suite --user
<username>:<API_token> --verbose --cacert <path_to_root_certificate>curl --request POST http://10.123.154.163:30427/job/Policy-NewFeatures/4/testReport/api/xml?exclude=testResult/suite--user policyapiuser:111ad02d7471cec9ca689696e9c7a55c62 --verboseatsGuiTLSEnabled parameter is set to
true:curl --request POST https://10.75.217.25:30301/job/SCP-Regression/1/testReport/api/xml?exclude=testResult/suite
--user scpapiuser:11c2fde49cea6eb8f332ad23a7877ea2de --verbose --cacert
caroot.cerFor getting Feature-wise XML, Select_Option = All:
curl --request POST
      <Jenkins_host_port>/job/<Pipeline_name>/<job_id>/artifact/test-results/reports/*zip*/test-results.zip
--user <username>:<API_token> --verbose --output test-results.zipatsGuiTLSEnabled parameter is set to
true:curl --request POST
<Jenkins_host_port>/job/<Pipeline_name>/<job_id>/artifact/test-results/reports/*zip*/test-results.zip
--user <username>:<API_token> --verbose --output test-results.zip --cacert
<path_to_root_certificate>curl --request POST http://
10.75.217.4:31881/job/Policy-NewFeatures/21/artifact/test-results/reports/*zip*/test-results.zip --user policyapiuser:11c3344996c4fda01ded2124bec4f9aa17
--verbose –-output test-results.zipatsGuiTLSEnabled parameter is set to
true:curl --request POST https://10.75.217.25:30301/job/SCP-Regression/1/artifact/test-results/reports/*zip*/test-results.zip
--user scpapiuser:11c2fde49cea6eb8f332ad23a7877ea2de --verbose --cacert
caroot.cerFor getting Feature-wise XML, Select_Option = Single/MultipleFeatures:
curl --request POST
      <Jenkins_host_port>/job/<Pipeline_name>/<job_id>/artifact/test-results/reports/
      *.<Feature1_name>.xml,*.<Feature2_name>.xml/*zip*/test-results.zip  --user <username>:<API_token>
--verbose --output test-results.zipatsGuiTLSEnabled parameter is set to
true:curl --request POST
<Jenkins_host_port>/job/<Pipeline_name>/<job_id>/artifact/test-results/reports/
*.<Feature1_name>.xml,*.<Feature2_name>.xml/*zip*/test-results.zip --user <username>:<API_token>
--verbose --output test-results.zip –-cacert
<path_to_root_certificate>curl --request POST http://
10.75.217.4:31881/job/Policy-NewFeatures/21/artifact/test-results/reports/*.goldenfeature.xml,*.AMPolicy.xml/*zip*/test-results.zip
–user policyapiuser:11c3344996c4fda01ded2124bec4f9aa17 --verbose --output test-results.zipatsGuiTLSEnabled parameter is set to
true:curl --request POST https://10.75.217.25:30301/job/SCP-Regression/1/artifact/test-results/reports/*.SCP_Registration_With_PLMNList.xml/*zip*/test-results.zip
--user scpapiuser:11c2fde49cea6eb8f332ad23a7877ea2de --verbose --cacert
caroot.cerAPI calls for Select_Option = All and Select_Option =
Single/MultipleFeatures return a zip file with JUNIT XMLs, one XML for
each feature.
Figure 2-8 Sample XML Output for AMPolicy.feature

In the API call, specify other selected features in comma-separated form
as
/*<Feature1_name>.xml,*<Feature2_name>.xml,*<Feature3_name>.xml,*<Feature4_name>.xml/
for Select_Option = Single/MultipleFeatures.
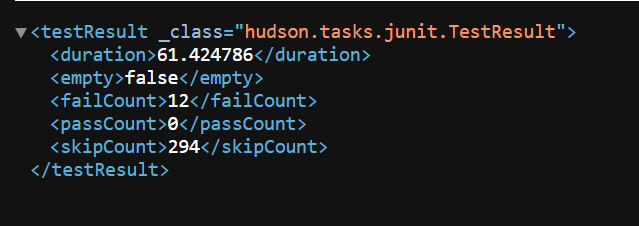
duration, failCount, passCount, and
skipCount for the current build.
Figure 2-9 Sample Output
It is recommended to maintain a gap of at least a few seconds between two API calls. This gap depends on the time Jenkins takes to complete the API request.
2.2 ATS Custom Abort
ATS Custom Abort feature allows you to gracefully abort the ongoing build directly from the Graphical User Interface (GUI).
- Using the Abort Button on the GUI: This method, supported by Jenkins, allows you to abort builds directly from the user interface.
- Using the ATS API: This is a partially manual method for
aborting builds.
When the ATS API is used to abort a build, ATS will wait for any running scenarios to complete their cleanup process before finalizing the abort. This ensures that there are no issues related to cleanup when using the ATS API.
Manual Abort
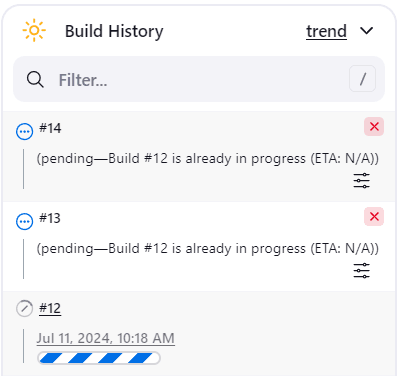
By default, Jenkins provides a cancel icon for every pipeline on the dashboard whenever a job is running. However, using the manual abort or cancel icon has some limitations, especially in parallel execution scenarios.
When the manual abort or cancel icon is used, Jenkins sends a kill signal to stop all current executions, regardless of whether test cases or other operations are in progress. In cases of parallel execution with multiple stages, the manual abort or cancel icon may need to be clicked multiple times due to the presence of multiple stages. This approach can lead to pending cleanup for test cases, which may cause failures in subsequent executions.
To address the issues with manual abort, the release 24.3.0 introduces an Abort_Build menu in all new features and regression pipelines, ensuring a more controlled and graceful termination of builds.
The cancel icon will not be displayed for currently running builds. However, if there are any builds in the queue, they will still have the cancel icon available for use.
Figure 2-10 Stopping Builds
Abort_Build
The Abort_Build is available on every regression and new features pipeline. It supports the graceful termination of builds. This Abort button available in the GUI triggers a stop API request to the ATS API server. This request ensures that the execution is stopped gracefully, allowing all currently running scenarios to complete.
- Enter the login credentials and click Sign
in.
The screens displays preconfigured pipelines for NF individually.
- Click NF-NewFeatures or
NF-Regression in the Name
column.
The NF-NewFeatures or NF-Regression screen appears.
- Click Abort_Build in the left navigation
pane.
Figure 2-11 Abort Build

You will be redirected to the Pipeline Abort-helper page.
- If no builds are currently running or in progress, the page will display the message: "No builds are running."
- If builds are running, the page will display the following:
- Running_Builds: This section lists the running
pipeline names and build numbers.
Figure 2-12 Running_Builds

- Abort: Click the button to start the abort
process.
Figure 2-13 Aborting Build

- Back: Click the button to return to the pipeline page or remain on the current page while the abort process completes.
- Running_Builds: This section lists the running
pipeline names and build numbers.
- If the abort is initiated during stages such as "Preparation" or "POST," the build stops within a few minutes.
- If parallel test case execution is not enabled for NFs, and there is only one stage, such as "Execute-tests" or "stage1/group1", the time taken for a graceful abort depends on the duration of the currently running scenarios.
- If parallel test case execution is enabled for NFs, the time required for abort depends on the scenario that takes the longest time to complete among the currently running groups.
Figure 2-14 Manual Abort or Cancel icon

Note:
It is recommended to use the new Abort button instead of the manual abort or cancel icon provided by Jenkins for a more reliable abort process.2.3 ATS Feature Activation and Deactivation
Note:
Once these features are removed, they cannot be reinstated in the deployed ATS. However, users have the option to reinstall the ATS to restore the disabled features.Note:
These parameters can be edited in the ATS deployment file (values.yaml).
Table 2-5 Enable or Disable ATS Feature
| Features | Parameter | Description |
|---|---|---|
| Support for Test Case Mapping and Count | testCaseMapping | Set this parameter to true to activate the feature
in the ATS GUI.
|
| Application Log Collection and PCAP Log Collection | logging | Set this parameter to true to collect the ATS
logs. If the parameter is set to false, the logs will not be collected.
|
| Lightweight Performance | lightWeightPerformance | Set this parameter to true to activate the feature
in the ATS GUI. If the parameter is set to false, the performance pipeline will not
be accessible.
|
| ATS Health Check | healthcheck | Set this parameter to true to activate the
feature in the ATS GUI. If the parameter is set to false, the health check pipeline
will not be accessible.
|
| ATS API | atsApi | Set this parameter to true to activate the
feature. If the parameter is set to false, the ATS API feature on the 5001 port will
be disabled.
|
| Parameterization | parameterization | Set this parameter to true to activate the
feature in the ATS GUI. If the parameter is set to false, the Configuration_Type
parameter on the GUI will not be available.
|
| Parallel Test Execution | parallelFrameworkChangesIntegrated | Set this parameter to true if all parallel test
case execution features are picked by NF and changes are made to files.
Note: Do not change the values provided in the
|
| Parallel Test Execution | parallelTestCaseExecution | Set this parameter to true to activate the
feature in the ATS GUI. If set to false, all the features will be copied into a
single stage or group, resulting in sequential execution.
Note: It is not advisable to edit the default value given in the values.yaml file for this parameter. |
| Parallel Test Execution | mergedExecution | Set this parameter to true to activate the
feature in the ATS GUI. If set to false, the option to include other pipelines for
mergedExecution will not be available.
Note: It is not advisable to edit the default value given in the values.yaml file for this parameter. |
| ATS Support to Execute Scenarios | scenarioSelection | Set this parameter to true to activate the
feature in the ATS GUI. If set to false, the ability to select single or multiple
scenarios will be removed. It is dependent on the testCaseMapping parameter. If this
parameter is set to false, the scenarioSelection parameter will be set to false too.
Note: It is not advisable to edit the default value given in the values.yaml file for this parameter. |
| ATS Tagging Support | executionWithTagging | Set this parameter to true to activate the feature
in the ATS GUI. If set to false, the ability to execute test cases based on tags
will be removed. It is dependent on the testCaseMapping parameter. If this parameter
is set to false, the executionWithTagging parameter will be set to false
too.
|
| Stage or Group Level Execution | individualStageGroupSelection | Set this parameter to true to activate the feature
in the ATS GUI. If set to false, the ability to select all test cases from
individual stages or groups using a single checkbox will be removed.
Note: It is not advisable to edit the default value given in the values.yaml file for this parameter. |
| Support for Transport Layer Security | atsGUITLSEnabled | Set this parameter to true to activate the feature
in the ATS GUI. If set to false, ATS will work in HTTP mode.
|
Note:
- You can edit the parameters relating to the features that NF supports. Keep the default value for the remaining parameters.
- For the current release, mergedExecution, individualStageGroupSelection, and parallelTestCaseExecution parameters value should not be modified.
2.4 ATS GUI Enhancements
Figure 2-15 Layout Enhancement

Figure 2-16 Test Cases Visibility

Figure 2-17 Tooltips
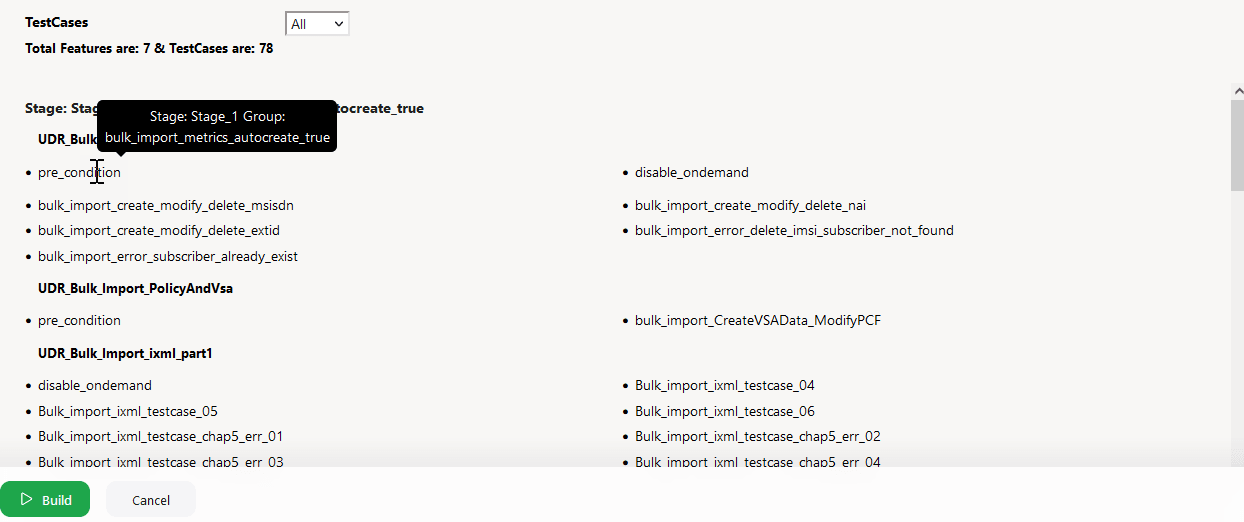
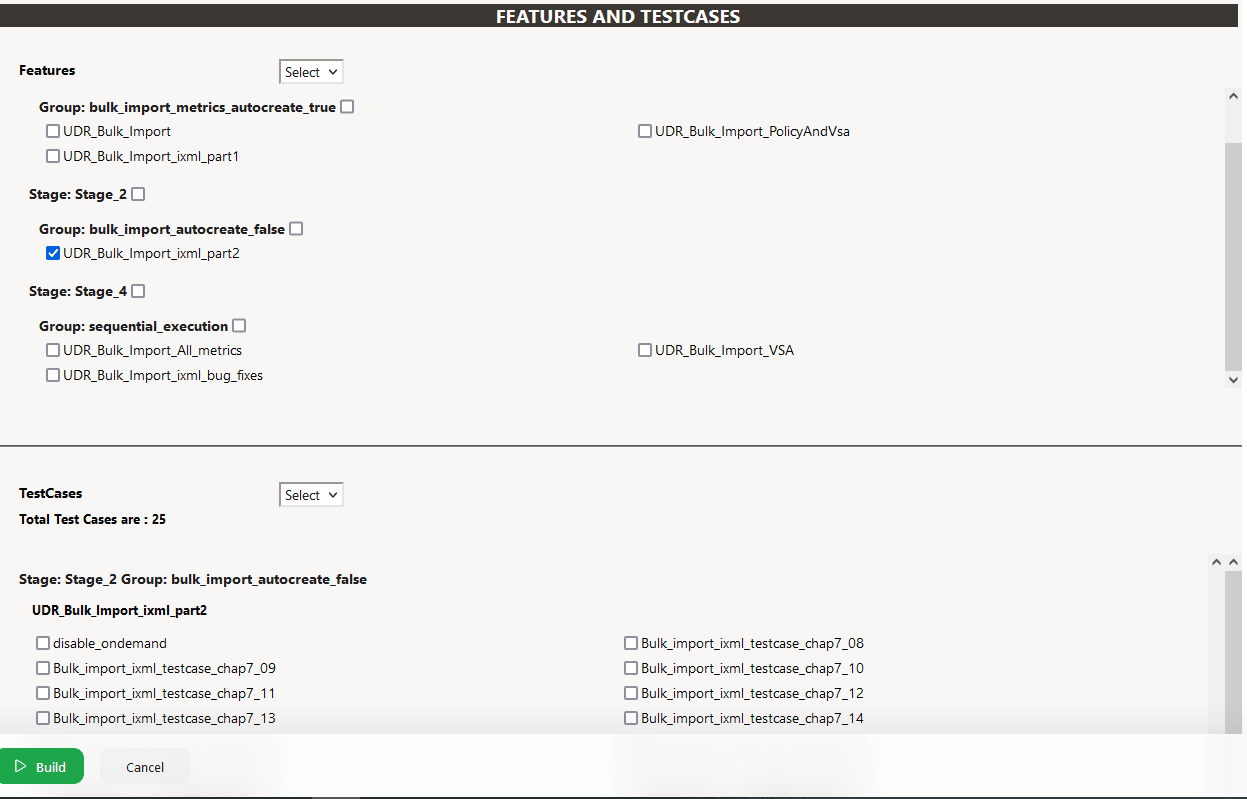
Figure 2-18 Multiselect Features and Scenarios
2.5 ATS Health Check
The ATS Health Check feature allows you to evaluate the health of the ATS deployment by conducting a comprehensive series of checks. ATS health checks are performed using the Health Check tool. After installation, it ensures the health of CNCATS pods, their services, and associated configurations.
Overview of Health Check Tool Functionality
- Initial Setup: After installation, the Health Check tool begins by running a series of predefined tests to establish a baseline.
- CPU and Memory Verification: The Health check tool verifies whether the CPU and memory allocated to CNCATS pods meet the minimum requirements set. It compares current resource allocations with these thresholds and flags any shortfalls, recommending necessary adjustments.
- Service Verification: It checks the operational status of the CNCATS services (ATS API and ATS GUI), including verifying service endpoints, ensuring services are running, and confirming they respond as expected.
- Test Folder Validation: It inspects the test folder to ensure that all necessary test files are present and properly configured.
- Configuration Checks: The tool reviews the authentication configurations required for running the System Under Test (SUT/NF) health check, verifying that all configurations are correct to facilitate smooth run.
- PVC Verification: It confirms whether the Persistent Volume Claim (PVC) is in a bound state and properly connected to a Persistent Volume. Any issues with PVC binding are flagged for further investigation.
By performing these checks, the tool ensures that the CNCATS pod and its associated services are functioning correctly, identifying potential issues before they affect system performance.
Note:
- This feature is available starting from CNCATS 24.3.0 Build.
- For initial checks, view the ATS Health Check in pod logs using
the
command:
.kubectl logs <podname> -n <namespace> - For subsequent checks, rerun the tool through ATS bash with the
command:
.healthtest
Figure 2-19 Success Health Check
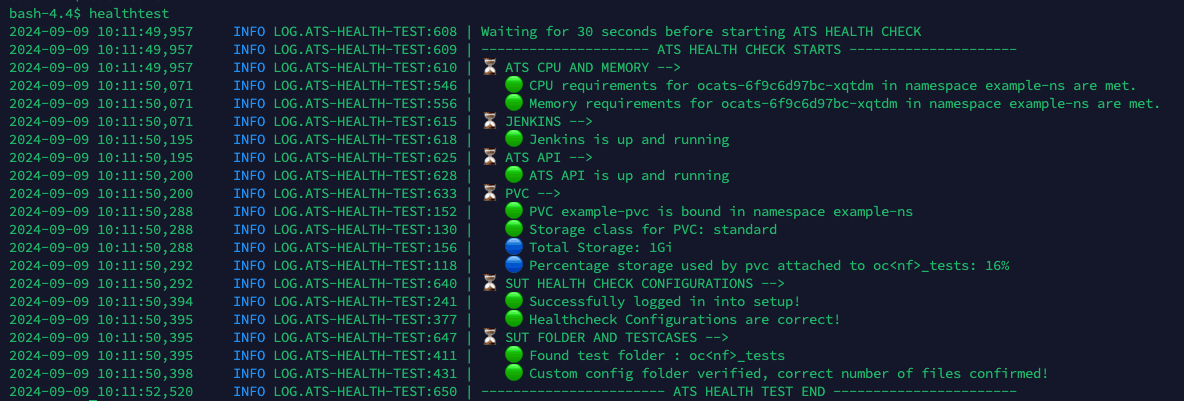
Figure 2-20 Warning and Errors

Note:
The highlighted areas illustrate a health check with warnings and errors that require further investigation or action.2.6 ATS Jenkins Job Queue
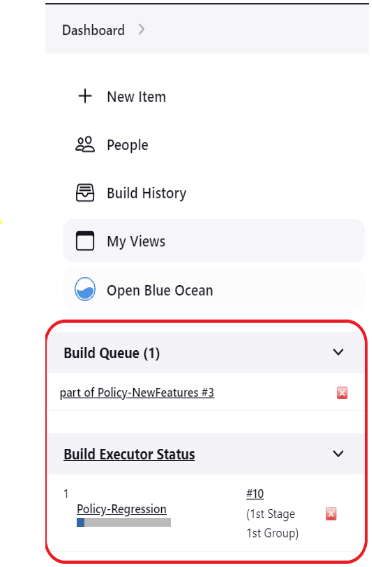
The ATS Jenkins Job Queue feature places the second job in a queue if the current job is already running from the same or different pipelines to prevent jobs from running in parallel to one another.
Figure 2-21 Build Executor Status
2.7 Application Log Collection
Using Application Log Collection, you can debug a failed test case by collecting the application logs for NF System Under Test (SUT). Application logs are collected for the duration that the failed test case was run.
Application Log Collection can be implemented by using OpenSearch or Kubernetes Logs. In both these implementations, logs are collected per scenario for the failed scenarios.
Application Log Collection Using OpenSearch
- Log in to ATS using respective <NF> login credentials.
- On the NF home page, click any new feature or regression pipeline, from where you want to collect the logs.
- In the left navigation pane, click Build with Parameters.
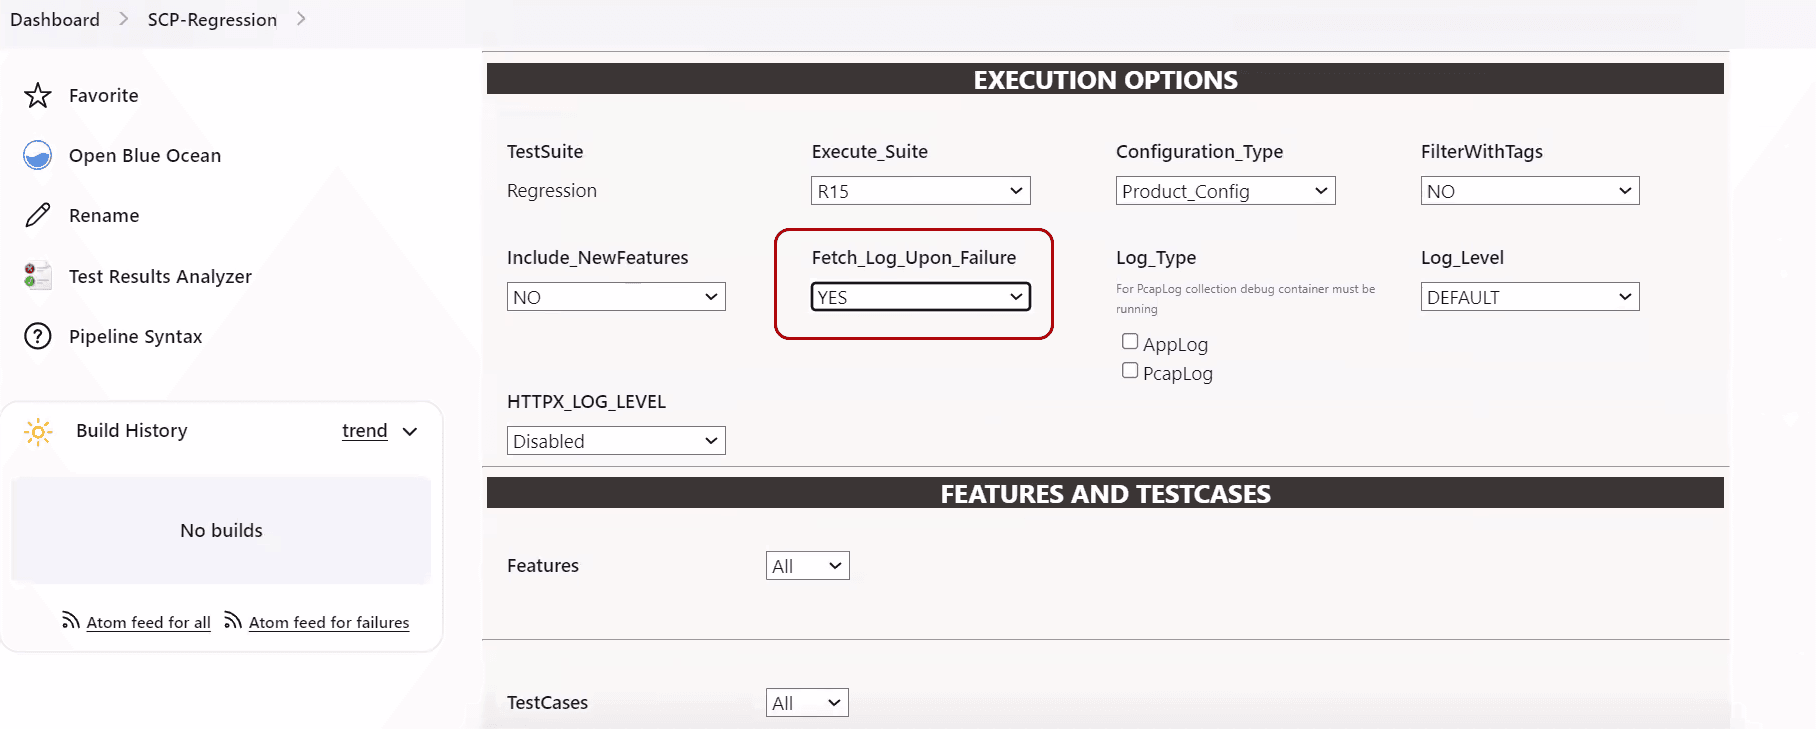
- Select YES or NO from the drop-down menu of
Fetch_Log_Upon_Failure to select whether the log
collection is required for a particular run.
Figure 2-22 Fetch_Log_Upon_Failure
- If option Log_Type is also available, select value AppLog for it.
- Select the Log Level from the drop-down menu of Log_Level to set
the log level for all the microservices. The possible values for Log_Level
are as follows:
- WARN: Designates potentially harmful situations.
- INFO: Designates informational messages that highlight the progress of the application at coarse-grained level.
- DEBUG: Designates fine-grained informational events that are most useful to debug an application.
- ERROR: Designates error events that might still allow the application to continue running.
- TRACE: The TRACE log level captures all the details
about the behavior of the application. It is mostly diagnostic and
is more granular and finer than DEBUG log level.
Note:
Log_Level values are NF dependent.
- After the build execution is complete, go into the ATS pod,
then navigate to following path to find the
applogs:
.jenkins/jobs/<Pipeline Name>/builds/<build
                            number>/
For example,
.jenkins/jobs/SCP-Regression/builds/5/Applogs is present in zip form. Unzip it to get the log files.
The following tasks are carried out in the background to collect logs:
- OpenSearch API is used to access and fetch logs.
- Logs are fetched from OpenSearch for the failed scenarios
- Hooks (after scenario) within the cleanup file initiate an API call to OpenSearch to fetch Application logs.
- Duration of the failed scenario is calculated based on the time stamp and passed as a parameter to fetch the logs from OpenSearch.
- Filtered query is used to fetch the records based on Pod name, Service name, and timestamp (Failed Scenario Duration).
- For OpenSearch, there is no rollover or rotation of logs over time.
- The following configuration parameters are used for collecting logs
using OpenSearch:
- OPENSEARCH_WAIT_TIME: Wait time to connect to OpenSearch
- OPENSEARCH_HOST: OpenSearch HostName
- OPENSEARCH_PORT: OpenSearch Port
Application Log Collection Using Kubernetes Logs
- On the NF home page, click any new feature or regression pipeline, from where you want to collect the logs.
- In the left navigation pane, click Build with Parameters.
- Select YES or NO from the drop-down menu of Fetch_Log_Upon_Failure to select whether the log collection is required for a particular run.
- Select the Log Level from the drop-down menu of Log_Level to
set the log level for all the microservices. The possible values for
Log_Level are as follows:
- WARN: Designates potentially harmful situations.
- INFO: Designates informational messages that highlight the progress of the application at coarse-grained level.
- DEBUG: Designates fine-grained informational events that are most useful to debug an application.
- ERROR: Designates error events that might still allow
the application to continue running.
Note:
Log_Level values are NF dependent.
The following tasks are carried out in the background to collect logs:
- Kube API is used to access and fetch logs.
- For failed scenarios, logs are directly fetched from microservices.
- Hooks (after scenario) within the cleanup file initiate an API call to Kubernetes Logs to fetch Application logs.
- The duration of the failed scenario is calculated based on the time stamp and passed as a parameter to fetch the logs from microservices.
- Logs roll can occur while fetching the logs for a failed scenario. The maximum loss of logs is confined to a single scenario.
2.7.1 Application Log Collection and Parallel Test Execution Integration
A new stage,"Logging/Rerun", has been added at the end of the Execute-Tests stage to collect rerun logs, such as applog and PCAP logs, by running the failed test cases in a sequence.
Figure 2-23 Logging/Rerun new stage

Fetch_Log_Upon_Failure parameter is set to YES and if any
test case fails in the initial run, then:
- The failed test case reruns and log collection start in the Logging/Rerun stage after the initial run is completed for all the test cases.
- The logs from the initial execution are collected, but they might be incorrect.
- Even if the
rerunparameter is set to 0, the failed test case reruns in the Logging/Rerun stage and the log is collected.Note:
Not applicable for all the NFs. - If the
Fetch_Log_Upon_Failureparameter is set to NO and if any test case fails in the initial run, then the failed test case rerun starts in the same stage after the initial execution is over for all the test cases in its group.
2.8 ATS Maintenance Scripts
- Taking a backup of the ATS custom folders and Jenkins pipeline.
- Viewing the configuration and restoring the Jenkins pipeline.
- Viewing the configuration and installing or uninstalling ATS and stubs.
ATS maintenance scripts are present in the ATS image at the
following path: /var/lib/jenkins/ocats_maint_scripts
kubectl cp <NAMESPACE>/<POD_NAME>:/var/lib/jenkins/ocats_maint_scripts <DESTINATION_PATH_ON_BASTION> podkubectl cp ocpcf/ocats-ocats-policy-694c589664-js267:/var/lib/Jenkins/ocats_maint_scripts /home/meta-user/ocats_maint_scripts pod2.8.1 ATS Scripts
ATS maintenance scripts are used to perform various task related to ATS and Jenkin pipeline.
- ats_backup.sh: This script requires the user's input and
takes a backup of the ATS custom folders, Jenkins jobs, and user's folders on
the user's system. The backup can be of the Jenkins jobs and user's folder, the
custom folders, or both. The custom folders include cust_regression,
cust_newfeatures, cust_performance, cust_data, and custom_config. For a Jenkins
job or a user's folder, the script only takes a backup of the config.xml file.
Also, the script requires the user to store a backup on the user's system (the
default path is the location from where the script is being run) and to create a
backup folder on the system and take the backup of the chosen folder from the
corresponding ATS into the backup folder. The backup folder name can be of the
following notation:
ats_<version>_backup_<date>_<time>. - ats_uninstall.sh: This script requires the user's input and uninstalls the corresponding ATS.
- ats_install.sh: This script requires the user's input and
installs a new ATS. If PVEnabled is set to
true, the script also reads the PVC name
from values.yaml and creates values.yaml before installation. Also, if needed,
the script performs the postinstallation steps, such as copying tests and
Jenkins jobs' folders from the
ats_datatar file to the ATS pod when PV is deployed, and then restarts the pod. - ats_restore.sh: This script requires the user's inputs,
restores the new release ATS pipeline, and views the configuration by referring
to the last release ATS Jenkins jobs and the user's configuration. It depends on
the user whether to use the backup folders from the user's system to restore the
ATS configuration. If the user instructs the script to use the backup from the
system, the script requires the path of the backup and uses the backup to
restore. Otherwise, the script requires the last ATS Helm release name to refer
to its Jenkins jobs and the user's configuration to restore.
The script refers to the last release of ATS Jenkins pipelines and sets the Discard old builds property if this property is set in the last release of ATS for a pipeline but not in the current release. If this property is set in both releases, the script just updates the values according to the last release. Also, the script restores the pipeline environment variables values as per the last release of ATS. If any custom pipeline (created by the user) was present in the last release of ATS, the script restores that as well. It also restores the extra views created by NF users, for example, policy users, SCP users, and NRF users. Moreover, the script displays messages about the pending configuration that the user needs to perform manually. For example, a new pipeline or a new environment variable (for a pipeline) is introduced in the new release.
While deploying ATS without PV, Jenkins needs to be restarted for the restore process to complete. If the last release ATS contains the Configuration_Type parameter, the Configuration_Type script needs to be approved with the In Process Script Approval setting under Manage ATS in Jenkins for the restore process to complete.
2.8.2 Updating ats_install.sh
Currently, the ats_install.sh script copies the tests folder and Jenkins jobs folder into the ATS pod and then restarts the pod when deployed with PV.
How to Update ats_install.sh
Other NFs can also use the ats_install.sh scripts. However, additional post installation steps may have to be performed manually for a few NFs.
- In the ats_install.sh script,
there is a post install section between ####POST_INSTALL_START#### and ####
POST_INSTALL_END ####.
- Add the required post install commands.
Note:
These commands are NF-specific. - Use the following commands:
$namespacefor the namespace value$pod_namefor the pod name$ats_data_pathfor theats_datafolder path (it has tests folder and Jenkins jobs folder provided as tar file in ATS package)
- In the if-else block related to whether PV is enabled
or not, add the following:
- Add a command specific to PVEnabled=true in the if block.
- Add a command specific to PVEnabled=false in the else block.
- Add the required post install commands.
- For additional inputs, enter the required code between #### INPUT_START #### and #### INPUT_END ####.
2.8.3 Restarting Jenkins without Restarting Pod
Perform the following procedure to restart Jenkins without restarting pods:
- Log in as the Jenkins admin.
- Go to the
<Jenkins_IP>:<port>/safeRestart, for example,10.87.73.32:32156/safeRestart.Figure 2-24 Safe Restart

- Click Yes.
Figure 2-25 Restart Jenkins

2.8.4 Updating Stub Scripts
- stub_uninstall.sh: This script requires the user's inputs and uninstalls all the stubs.
- stub_install.sh: This script requires the user's inputs and installs all the stubs.
Note:
Currently, stub_uninstall.sh and stub_install.sh work.- Go to the
stubfolder. - From each script:
- Remove the CNC Policy-specific stubs inputs (dns, amf, and ldap), and add the input code blocks for NRF-specific stubs.
- For the stubs to uninstall, change the value of the
stubUninstallList variable,
and delete the variables for the CNC Policy-specific stubs below it.
Note:
stubUninstallList contains the Helm release names of the common stubs that are deployed generally. - Declare the variables for the NRF-specific stubs below the stubUninstallList line.
- Remove the Helm uninstallation commands of the policy-specific stubs, and add the Helm uninstallation commands of the NRF-specific stubs.
- For the stubs to install, change the value of the
stubInstallList variable, and
delete the variables for the CNC Policy-specific stubs below it.
Note:
stubInstallList contains the Helm release names of the common stubs that are deployed generally. - Declare the variables for the NRF-specific stubs below the stubInstallList line.
- Remove the Helm installation commands of the CNC Policy-specific stubs, and add the Helm installation commands of the NRF-specific stubs.
2.8.5 Running ATS and Stub Deployment Scripts
Perform the following procedure to run ATS and stub deployment scripts:
Note:
If you want to take a backup of the custom folders or Jenkins jobs and user's configuration or both, run the ats_backup.sh script.- Run the ats_install.sh script to install the new release ATS (values.yaml of the ATS Helm chart must be updated before this step).
- Run the ats_restore.sh script to
restore the new ATS pipeline and view configuration.
Note:
- You might perform the manual steps required for the restore script.
- You must copy all the necessary changes to the new release ATS from the last release ATS. To get the changes in the last release, you must refer to the custom folders in the last release ATS backup on the system with an existing backup using ats_backup.sh before this step.
- You can remove the last release ATS pod using the ats_uninstall.sh script while continuing to retain the last release PVC. You can use the last release PVC to port backward. Delete the last release PVC when you do not require the backward porting.
- Run the stub_install.sh script to install all the new release stubs values.yaml of the stub Helm charts must be updated before this step.
- Run the stub_uninstall.sh script to uninstall all the last release stubs.
2.9 ATS System Name and Version Display on the ATS GUI
This feature displays the ATS system name and version on the ATS GUI.
- ATS system name: Abbreviated product name followed by NF name.
- ATS Version: Release version of ATS.
2.10 ATS Tagging Support
The ATS Tagging Support feature assists in running the feature files after filtering features and scenarios based on tags. Instead of manually navigating through several feature files, the user can save time by using this feature.
- Feature_Include_Tags: The features that contain either of the tags
available in the Feature_Include_Tags field are
considered for tagging.
- For example, "cne-common", "config-server". All the features that have either "cne-common" or "config-server" tags are taken into consideration.
- Feature_Exclude_Tags: The features that contain neither of the tags
available in the Feature_Exclude_Tags field are
considered for tagging.
- For example, "cne-common","config-server". All the features that have neither "cne-common" nor "config-server" as tags are taken into consideration.
- Scenario_Include_Tags: The scenarios that contain either of the
tags available in the Scenario_Include_Tags field are
considered.
- For example, "sanity", "cleanup". The scenarios that have either "sanity" or "cleanup" tags are taken into consideration.
- Scenario_Exclude_Tags: The features that contain neither of the tags
available in the Scenario_Exclude_Tags field are
considered.
- For example, "sanity", "cleanup". The scenarios that have neither "sanity" nor "cleanup" as tags are taken into consideration.
Filter with Tags
- On the NF home page, click any new feature or regression pipeline, where you want to use this feature.
- In the left navigation pane, click Build with
Parameters. The following image appears.
Figure 2-26 Filter with Tags

- Select Yes from the
FilterWithTags drop-down menu. The result shows
four input fields.
The default value of FilterWithTags field is "No".
- The input fields serve as a search or filter, displaying all
tags that match the prefix entered. You can select one or multiple tags.
Figure 2-27 Tags Matching with Entered Prefix

- Select the required tags from the different tags list and click Submit.
The specified feature-level tags are used to filter out features that contain any one of the include tags and none of the exclude tags. Here, any or both the fields may be left empty. All features are automatically taken into consideration when both fields are empty.
The scenario level tags are used to filter out the scenarios from the features filtered above. Only scenarios with any of the include tags and none of the exclude tags are considered. Any or both fields can be empty. When both fields are empty, all the scenarios from the above filtered feature files are considered.
Note:
- If you select the Select_Option as 'All', all the displayed features and scenarios will run.
- If you select the Select_Option as 'Single/MultipleFeatures, it enables you to select some features, and only those features and respective scenarios are going to run.
2.10.1 Combination of Tags and their Results
The combination of tags and expected results are as follows.
Table 2-6 Result of Filtered Tags
| Feature_Include | Feature_Exclude | Scenario_Include | Scenario_Exclude | Results |
|---|---|---|---|---|
| - | - | - | - | All the features and scenarios are taken into consideration. |
| "abc","def" | - | - | - | Features with either "abc" or "def" tags and all scenarios from the filtered features are taken into consideration. |
| - | "abc","def" | - | - | All the features with neither "abc" nor "def" tags and all scenarios from the filtered features are taken into consideration. |
| - | - | "sanity","cne" | - | Scenarios with either "sanity" or "cne" tags and features having these scenarios are taken into consideration. |
| - | - | - | "sanity","cne" | Scenarios with neither "sanity" nor "cne" tags and features having these filtered scenarios are taken into consideration. |
| "abc","def" | "ghi" | - | - | Features with either "abc" or "def" tags but without the "ghi" tag and all scenarios from filtered features are taken into consideration. |
| "abc","def" | - | "sanity","cne" | - | Scenarios only with either "sanity" or "cne" tags and only features that contain these scenarios and have either "abc" or "def" as feature tags are taken into consideration. |
| "abc","def" | - | - | "sanity","cne" | Scenarios with neither "sanity" nor "cne" tags and only features that contain the filtered scenarios and have either "abc" or "def" feature tags are taken into consideration. |
| - | "ghi" | "sanity","cne" | - | Features without the "ghi" tag and scenarios with either "sanity" or "cne" tags from the filtered features are taken into consideration. |
| - | "ghi" | - | "sanity","cne" | Features without the "ghi" tag and scenarios without the "sanity" and "cne" tags from filtered features are taken into consideration. |
| - | - | "sanity","cne" | "cleanup" | Scenarios with either the "sanity" or "cne" tags and without the "cleanup" tag and features with filtered scenarios are taken into consideration. |
| "abc","def" | "ghi" | "sanity","cne" | - | Scenarios with either the "sanity" or "cne" tags and features that have these scenarios and have either the "abc" or "def" tags but not the "ghi" tag are taken into consideration. |
| "abc","def" | - | "sanity","cne" | "cleanup" | Scenarios with either the "sanity" or "cne" tags and without the "cleanup" tag, and features having the filtered scenarios and having the feature tags either "abc" or "def" are taken into consideration. |
| "abc","def" | "ghi" | - | "cleanup" | Scenarios without the tag "cleanup", and features with filtered scenarios and having either "abc" or "def" as feature tags but not the "ghi" tag are taken into consideration. |
| - | "ghi" | "sanity","cne" | "cleanup" | Scenarios with either the "sanity" or "cne" tags and without the "cleanup" tag, and features with filtered scenarios and not the tag "ghi," are taken into consideration. |
| "abc","def" | "ghi" | "sanity","cne" | "cleanup" | Scenarios with either "sanity" or "cne" tags and without the "cleanup" tag, and features with filtered scenarios and feature tags either "abc" or "def" but without the tag "ghi" are taken into consideration. |
Note:
- The tags mentioned in the table are just examples; they may or may not be actually used.
- The Replay option in the Jenkins GUI is not supported for tag-related test case execution. Always trigger builds related to tagging from the Build with Parameter step, and do not replay any previous builds.
2.11 Custom Folder Implementation
The Custom Folder Implementation feature allows the user to update, add, or delete test cases without affecting the original product test cases in the new features, regression, and performance folders. The implemented custom folders are cust_newfeatures, cust_regression, and cust_performance. The custom folders contain the newly created, customised test cases.
Initially, the product test case folders and custom test case folders will have the same set of test cases. The user can perform customization in the custom test case folders, and ATS always runs the test cases from the custom test case folders. If the option "Configuration_Type" is present on the GUI,the user needs to set its value to "Custom_Config" to populate test cases from the custom test case folders.
Figure 2-28 Custom Config Folder

- Separate folders such as cust_newfeatures, cust_regression, and cust_performance are created to hold the custom cases.
- The prepackaged test cases are available in the newfeature and regression Folder.
- The user copies the required test cases to the cust_newfeatures and cust_regression folders, respectively.
- Jenkins always points to the cust_newfeatures and cust_regression
folders to populate them in the menu.
If someone initially launches ATS, they will not see any test cases in the menu if the cust folders are not populated. To avoid this, it is recommended to prepopulate both the folders, cust and original, and ask the user to modify only the cust folder if needed.
Figure 2-29 Summary of Custom Folder Implementation

2.12 Health Check
Health Check functionality is to check the health of the System Under Test (SUT)
Earlier, ATS used Helm test functionality to check the health of the System Under Test (SUT). With the implementation of the ATS Health Check pipeline, the SUT health check process has been automated. ATS health checks can be performed on webscale and non-webscale environments.
Convert a Value in Base64
echo-n "value"| base64echo-n "126.98.76.43"| base64Deploying Health Check in a Webscale Environment
- Set the Webscale to 'true' and the following parameters by encoding them with base64 in the ATS values.yaml file:
- Set the following parameter to encrypted
data:
webscalejumpserverip: encrypted-data
webscalejumpserverusername: encrypted-data
webscalejumpserverpassword: encrypted-data
webscaleprojectname: encrypted-data
webscalelabserverFQDN: encrypted-data
webscalelabserverport: encrypted-data
webscalelabserverusername: encrypted-data
webscalelabserverpassword: encrypted-data
Encrypted data is the value of parameters encrypted in base64. Fundamentally, Base64 is used to encode the parameters.
For example:
webscalejumpserverip=$(echo -n '10.75.217.42' | base64), Where Webscale Jump server ip needs to be provided
webscalejumpserverusername=$(echo -n 'cloud-user' | base64), Where Webscale Jump server Username needs to be provided
webscalejumpserverpassword=$(echo -n '****' | base64), Where Webscale Jump server Password needs to be provided
webscaleprojectname=$(echo -n '****' | base64), Where Webscale Project Name needs to be provided
webscalelabserverFQDN=$(echo -n '****' | base64), Where Webscale Lab Server FQDN needs to be provided
webscalelabserverport=$(echo -n '****' | base64), Where Webscale Lab Server Portneeds to be provided
webscalelabserverusername=$(echo -n '****' | base64), Where Webscale Lab Server Username needs to be provided
webscalelabserverpassword=$(echo -n '****' | base64), Where Webscale Lab Server Password needs to be provided
Running Health Check Pipeline in an Webscale Environment
- Log in to ATS using respective <NF> login credentials.
- Click <NF>HealthCheck pipeline and then click
Configure.
Note:
<NF> denotes the network function. For example, in Policy, it is called as Policy-HealthCheck pipeline.Figure 2-30 Configure Healthcheck

- Provide parameter a with Helm
release name deployed. If there are multiple releases, use comma to provide
all Helm release
names.
//a = helm releases [Provide Release Name with Comma Separated if more than 1 ]Provide parameter c with the appropriate Helm command, such as helm, helm3, or helm2.
//c = helm command name [helm or helm2 or helm3]Figure 2-31 Save the Changes
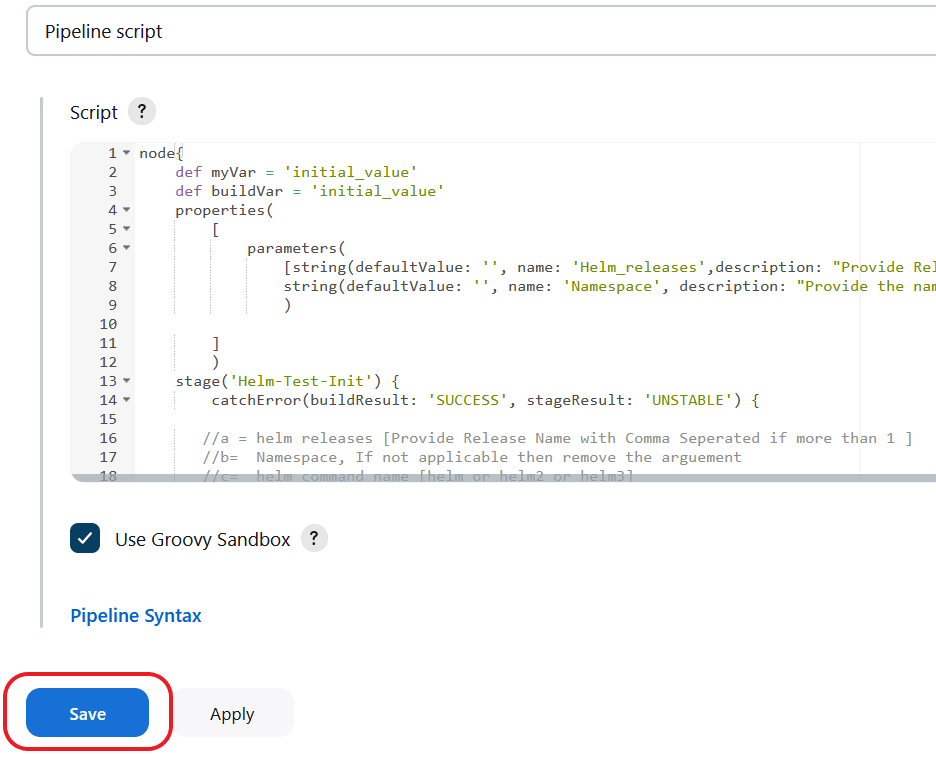
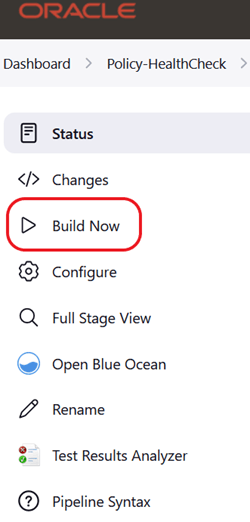
- Save the changes and click Build Now. ATS runs the
health check on respective network function.
Figure 2-32 Build Now
Deploying Health Check Pipeline in an OCI Environment
To use a ssh private key, create healthcheck-oci-secret and set the value of the key "passwordAuthenticationEnabled" to false.
Creating healthcheck-oci-secret
kubectl create secret generic healthcheck-oci-secret --from-file=bastion_key_file='<path of bastion ssh private key file>' --from-file=operator_instance_key_file='<path of operator instance ssh private key file>' -n <ATS namespace>kubectl create secret generic healthcheck-oci-secret --from-file=bastion_key_file='/tmp/bastion_private_key' --from-file=operator_instance_key_file='/tmp/operator_instance_private_key' -n seppsvcNote:
- Maintain the name of the secret as "healthcheck-oci-secret".
- Ensure that the '--from-file' keys retain the same names: "bastion_key_file" and "operator_instance_key_file".
- If the SSH private key is identical for both the bastion and operator instance, you can use the same path for both in the secret creation command.
Perform the following procedure to deploy ATS Health Check in a OCI environment:
- To use password, provide base64 encoded values for key "password" for both bastion and operator instances, and set the value of key passwordAuthenticationEnabled to "true".
- Set the following parameter to encrypted data:
envtype: encrypted-data
ociHealthCheck:
  passwordAuthenticationEnabled: true or false
  bastion:
    ip: encrypted-data
    username: encrypted-data
    password: encrypted-data
  operatorInstance:
    ip: encrypted-data
    username: encrypted-data
    password: encrypted-data
Note:
All fields are mandatory except for passwords. When the "passwordAuthenticationEnabled" field is set to true, only the "password" field needs to be updated; otherwise, it can remain with its default value.
Running Health Check Pipeline in an OCI Environment
- Log in to ATS using respective <NF> login credentials.
- Click <NF>HealthCheck pipeline and then click
Configure.
Note:
<NF> denotes the network function. For example, in Policy, it is called as Policy-HealthCheck pipeline.Figure 2-33 Configure Healthcheck

- Provide parameter a with Helm
release name deployed. If there are multiple releases, use comma to provide
all Helm release
names.
//a = helm releases [Provide Release Name with Comma Separated if more than 1 ]Provide parameter c with the appropriate Helm command, such as helm, helm3, or helm2.
//c = helm command name [helm or helm2 or helm3]Figure 2-34 Save the Changes

- Save the changes and click Build Now. ATS runs the
health check on respective network function.
Figure 2-35 Build Now

Deploying Health Check in a Non-Webscale or Non-OCI Environment
Perform the following procedure to deploy ATS Health Check in a non-webscale or non-OCI environment such as OCCNE:
Set the Webscale parameter set to 'false' and following parameters by encoding it with base64 in the ATS values.yaml file:
occnehostip: encrypted-data
occnehostusername: encrypted-data
occnehostpassword: encrypted-data
Example:
occnehostip=$(echo -n '10.75.217.42' | base64) , Where occne host ip needs to be provided
occnehostusername=$(echo -n 'cloud-user' | base64), Where occne host username needs to be provided
occnehostpassword=$(echo -n '****' | base64), Where password of host needs to be provided
Running Health Check Pipeline in a Non-Webscale or Non-OCI Environment
Perform the following procedure to run the ATS Health Check pipeline in a non-webscale or non-OCI environment such as OCCNE:
- Log in to ATS using respective <NF> login credentials.
- Click <NF>HealthCheck pipeline and then click Configure.
- Provide parameter a with Helm
release name deployed. If there are multiple releases, use comma to provide
all Helm release names.
Provide parameter b with SUT deployed namespace name.
Provide parameter c with the appropriate Helm command, such as helm, helm3, or helm2.
//a = helm releases [Provide Release Name with Comma Separated if more than 1 ]
//b = Namespace, If not applicable to WEBSCALE environment then remove the argument
//c = helm command name [helm or helm2 or helm3]
Figure 2-36 Save the Changes

- Save the changes and click Build Now. ATS runs the
health check on respective network function.
Figure 2-37 Build Now

By clicking Build Now, you can run the health check on ATS and store the result in the console logs.
2.13 Individual Stage Group Selection
The Individual Stage Group Selection feature allows you to select and execute a single or multiple stages or groups by selecting a check box for the corresponding stage or group.
- Click NF-Regression or NF-NewFeatures, and then click Build with Parameters.
- On the FEATURE and TESTCASES section, click Select from the Features drop-down menu.
- Select the corresponding check box to select any number of stages or
groups you want to run from the list available for execution.
Figure 2-38 Stages or Groups Selection

- Scroll down to click Build.
2.14 Lightweight Performance
The Lightweight Performance feature allows you to run performance test cases. In ATS, a new pipeline known as "<NF>-Performance", where NF stands for Network Function, is introduced, for example, Policy-Performance.
Figure 2-39 Sample Screen: Home Page

The <NF>-Performance pipeline verifies from 500 to 1k TPS (Transactions per Second) of traffic using the http-go tool, a tool used to run the traffic on the backend. It also helps to monitor the CPU and memory of microservices while running lightweight traffic.
The duration of the traffic run can be configured on the pipeline.
2.14.1 Configure <NF>-Performance Pipeline
- On the NF home page, click <NF>-Performance pipeline,
and then click Configure.
The General tab appears. The user must wait for the page to load completely.
- Click the Advanced Project Options tab.
Scroll down to reach the Pipeline configuration
section.
Figure 2-40 Advanced Project Options
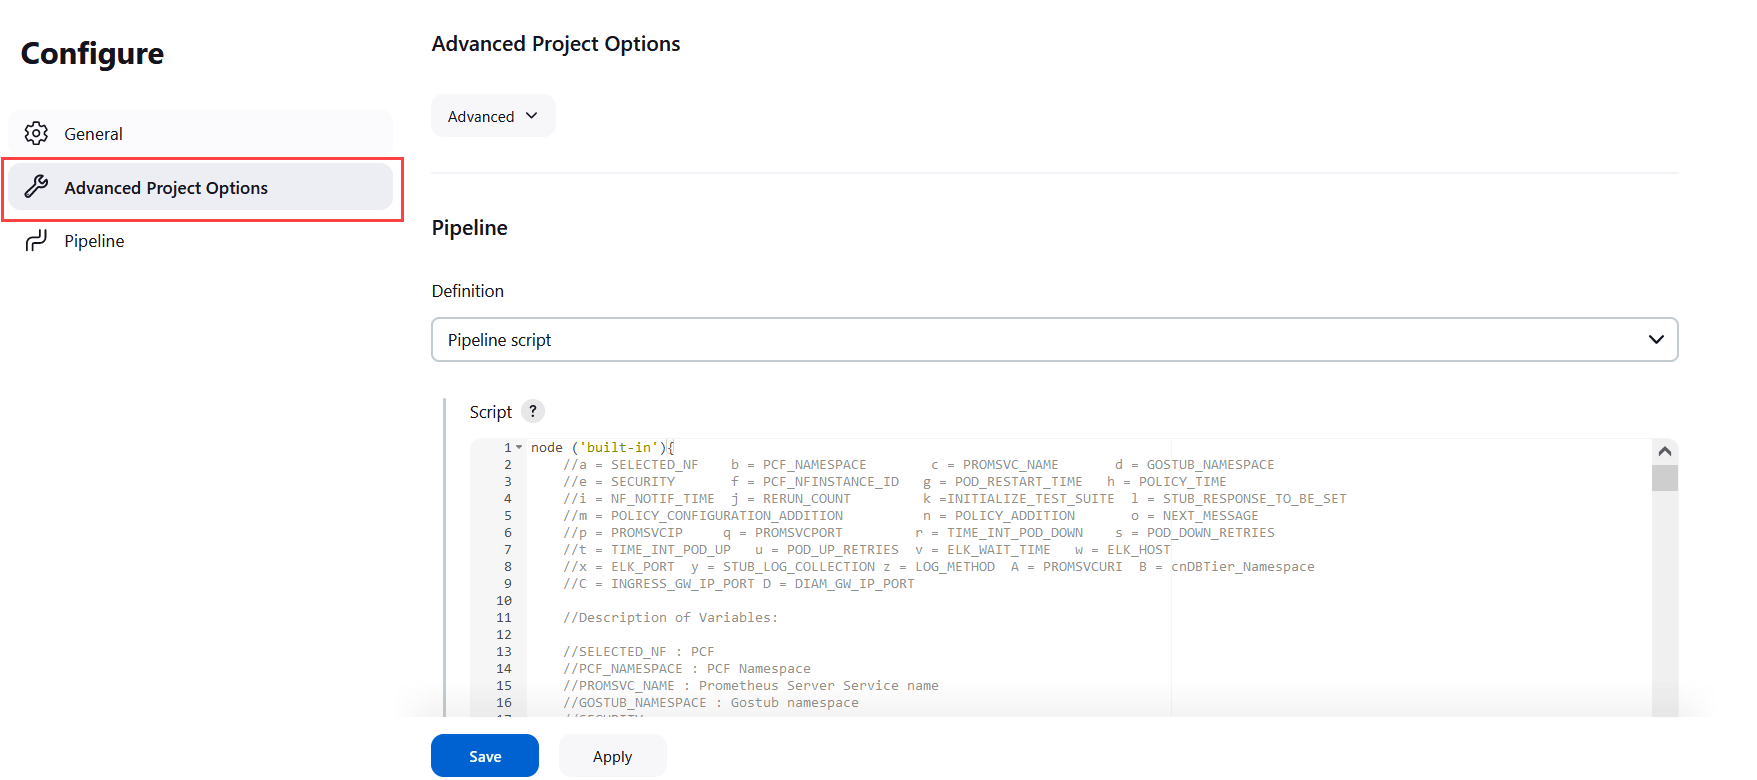
- Update the configurations as per your NF requirements and click Save. The Pipeline <NF>-Performance page appears.
- Click Build Now. This triggers lightweight traffic for the respective network function.
2.15 Managing Final Summary Report, Build Color, and Application Log
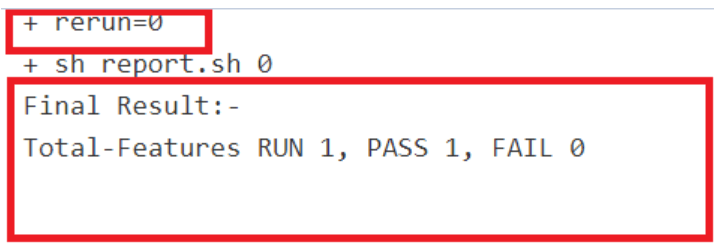
This feature displays an overall execution summary, such as the total run count, pass count, and fail count.
Supports Implementation of Total-Features- If rerun is set to 0, the test result report shows the following
result:
Figure 2-41 Total-Features = 1, and Rerun = 0
- If rerun is set to non-zero, the test result report shows the
following result:
Figure 2-42 Total-Features = 1, and Rerun = 2
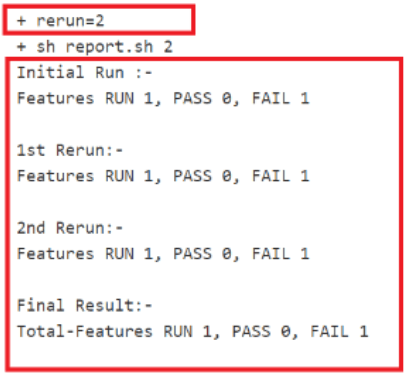
After incorporating the Parallel Test Execution feature, the following results were obtained:
Final Summary Report Implementations
Figure 2-43 Group Wise Results
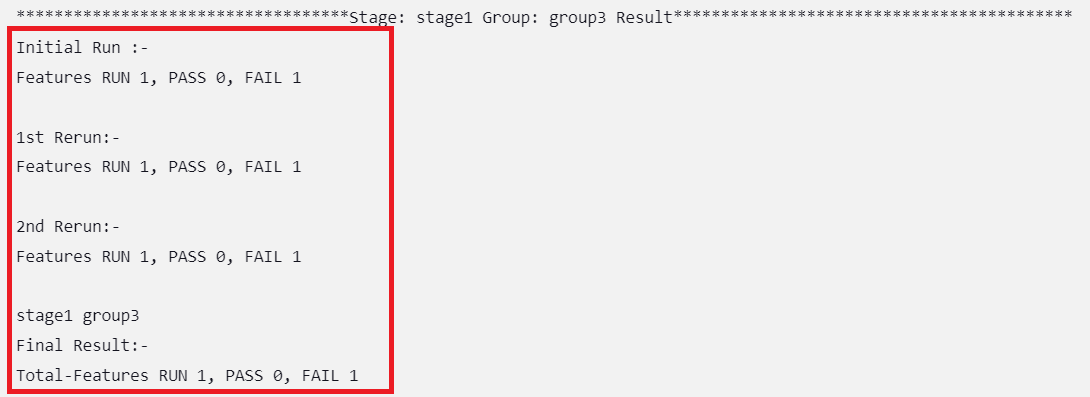
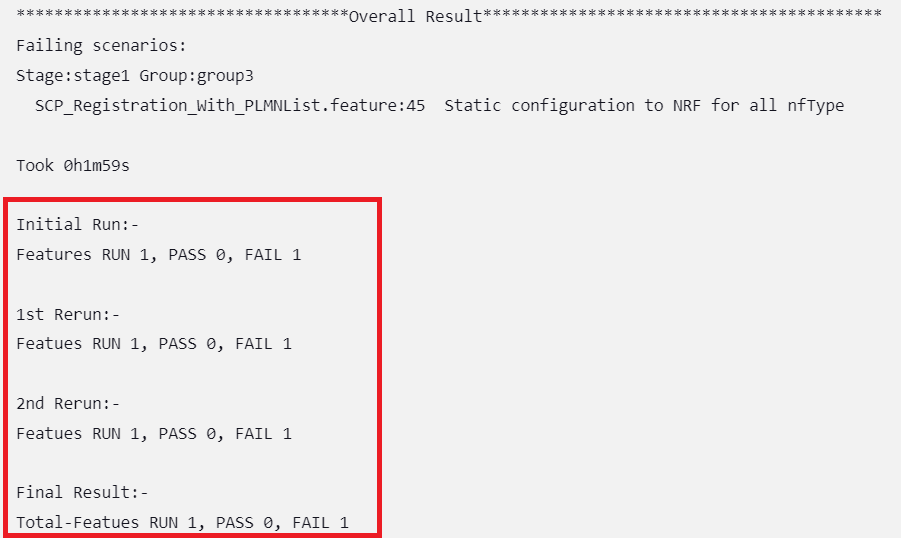
Figure 2-44 Overall Result When Selected Feature Tests Pass

Figure 2-45 Overall Result When Any of the Selected Feature Tests Fail
Implementing Build Colors
Table 2-7 Build Color Details
| Rerun Values | Rerun set to zero | Rerun set to non-zero | |||
|---|---|---|---|---|---|
| Status of Run | All Passed in Initial Run | Some Failed in Initial Run | All Passed in Initial Run | Some Passed in Initial Run, Rest Passed in Rerun | Some Passed in Initial Run, Some Failed Even After Rerun |
| Build Status | SUCCESS | FAILURE | SUCCESS | SUCCESS | FAILURE |
| Pipeline Color | GREEN | Execution Stage where test cases failed shows YELLOW color, rest of the successful stages are GREEN. | GREEN | GREEN | Execution Stage where test cases failed shows YELLOW color, rest of the successful stages are GREEN |
| Status Color | BLUE | RED | BLUE | BLUE | RED |
- the rerun count and the pass or fail status of test cases in the initial run
- the rerun count and the pass or fail status of test cases in the final run
For the parallel test case execution, the pipeline status also depends
on another parameter, "Fetch_Log_Upon_Failure," which is given in the
build with parameters page. If the parameter
Fetch_Log_Upon_Failure is not there, its default value is
considered "NO".
Table 2-8 Pipeline Status When Fetch_Log_Upon_Failure = NO
| Rerun Values | Rerun set to zero | Rerun set to non-zero | |||
|---|---|---|---|---|---|
| Passed/Failed | All Passed in Initial Run | Some Failed in Initial Run | All Passed in Initial Run | Some Passed in Initial Run, Rest Passed in Rerun | Some Passed in Initial Run, Some Failed Even After Rerun |
| Status | SUCCESS | FAILURE | SUCCESS | SUCCESS | FAILURE |
Table 2-9 Pipeline Status When Fetch_Log_Upon_Failure = YES
| Rerun Values | Rerun set to zero | Rerun set to non-zero | ||||
|---|---|---|---|---|---|---|
| Passed/Failed | All Passed in Initial Run | Some Failed in Initial Run and Failed in Rerun | Some Failed in Initial Run and Passed in Rerun | All Passed in Initial Run | Some Passed in Initial Run, Rest Passed in Rerun | Some Passed in Initial Run, Some Failed Even After Rerun |
| Status | SUCCESS | FAILURE | SUCCESS | SUCCESS | SUCCESS | FAILURE |
rerun_count, Fetch_Log_Upon_Failure, and
pass/fail status of test cases in initial and final run and the
corresponding build colors are as follows:
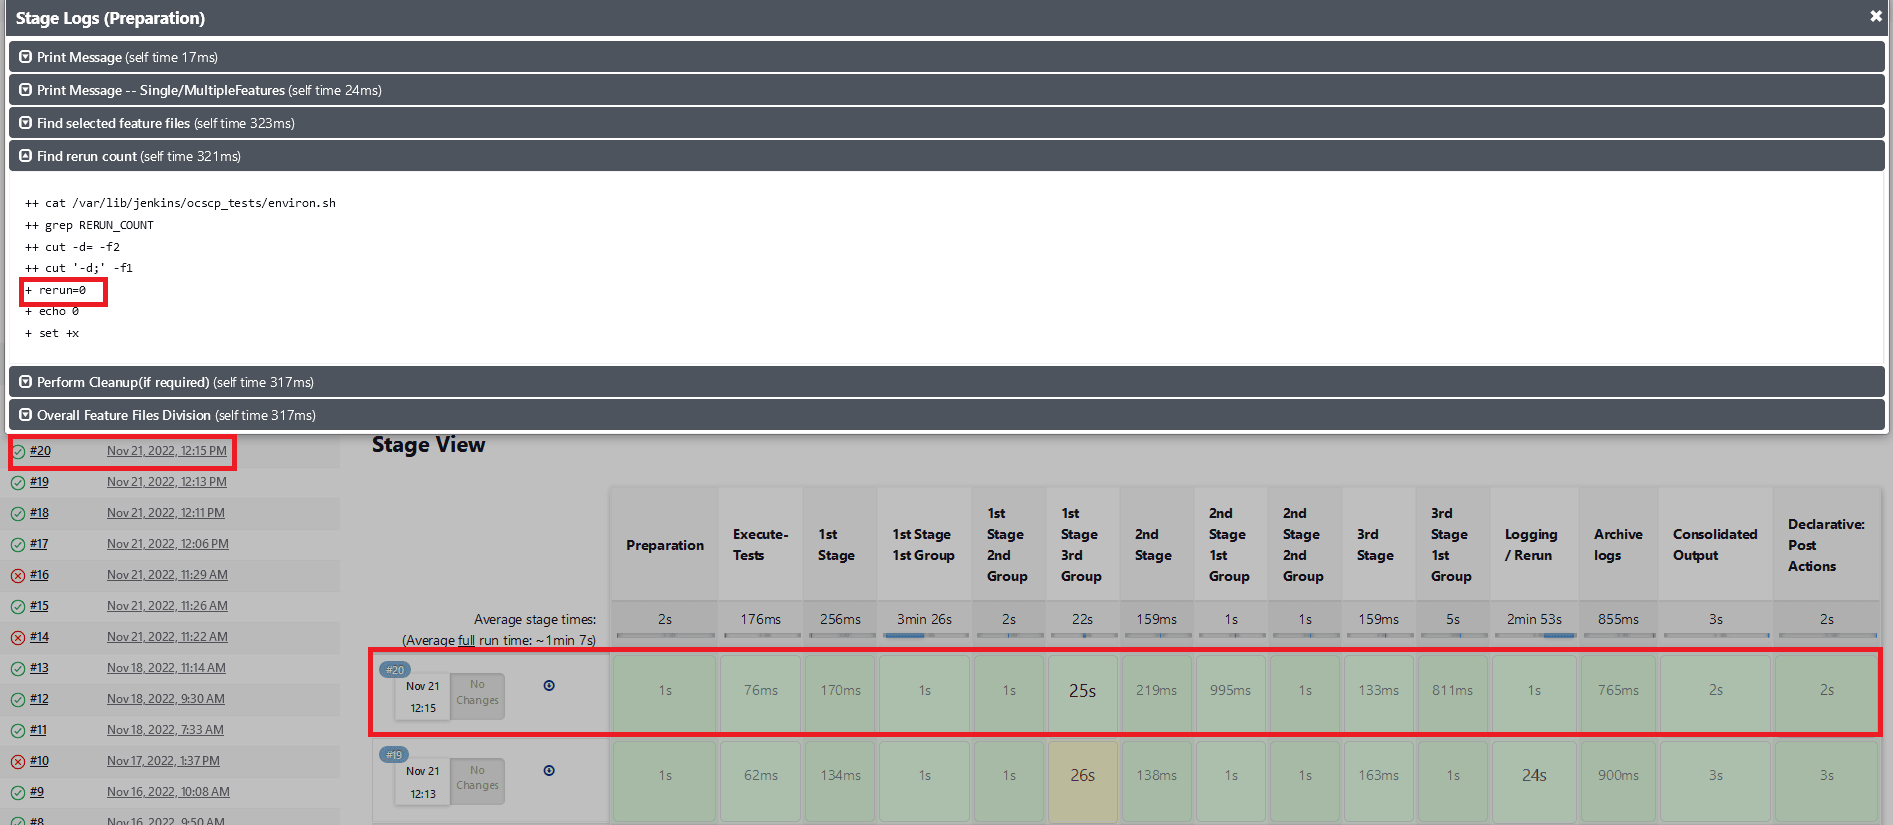
- When
Fetch_Log_Upon_Failureis set to YES andrerun_countis set to 0, test cases pass in the initial run. The pipeline will be green, and its status will show as blue.Figure 2-46 Fetch_Log_Upon_Failure is set to YES and rerun_count is set to 0, test cases pass
- When
Fetch_Log_Upon_Failureis set to YES andrerun_countis set to 0, test cases fail on the initial run but pass during the rerun. The initial execution stage is yellow and all subsequent successful stages will be green, and the status will be blue.Figure 2-47 Test Cases Fail on the Initial Run but Pass in the Rerun

- When
Fetch_Log_Upon_Failureis set to YES andrerun_countis set to 0, test cases fail in both the initial and the rerun. Execution stages will show as yellow, all other successful stages will be shown as green, and the overall pipeline status will be red.Figure 2-48 Test Cases Fail in Both the initial and the Rerun

- When
Fetch_Log_Upon_Failureis set to YES and thererun countis set to non-zero. If all of the test cases pass in the first run, no rerun will be initiated because the cases have already been passed. The pipeline will be green, and the status will be indicated in blue.Figure 2-49 All of the Test cases Pass in the Initial Run
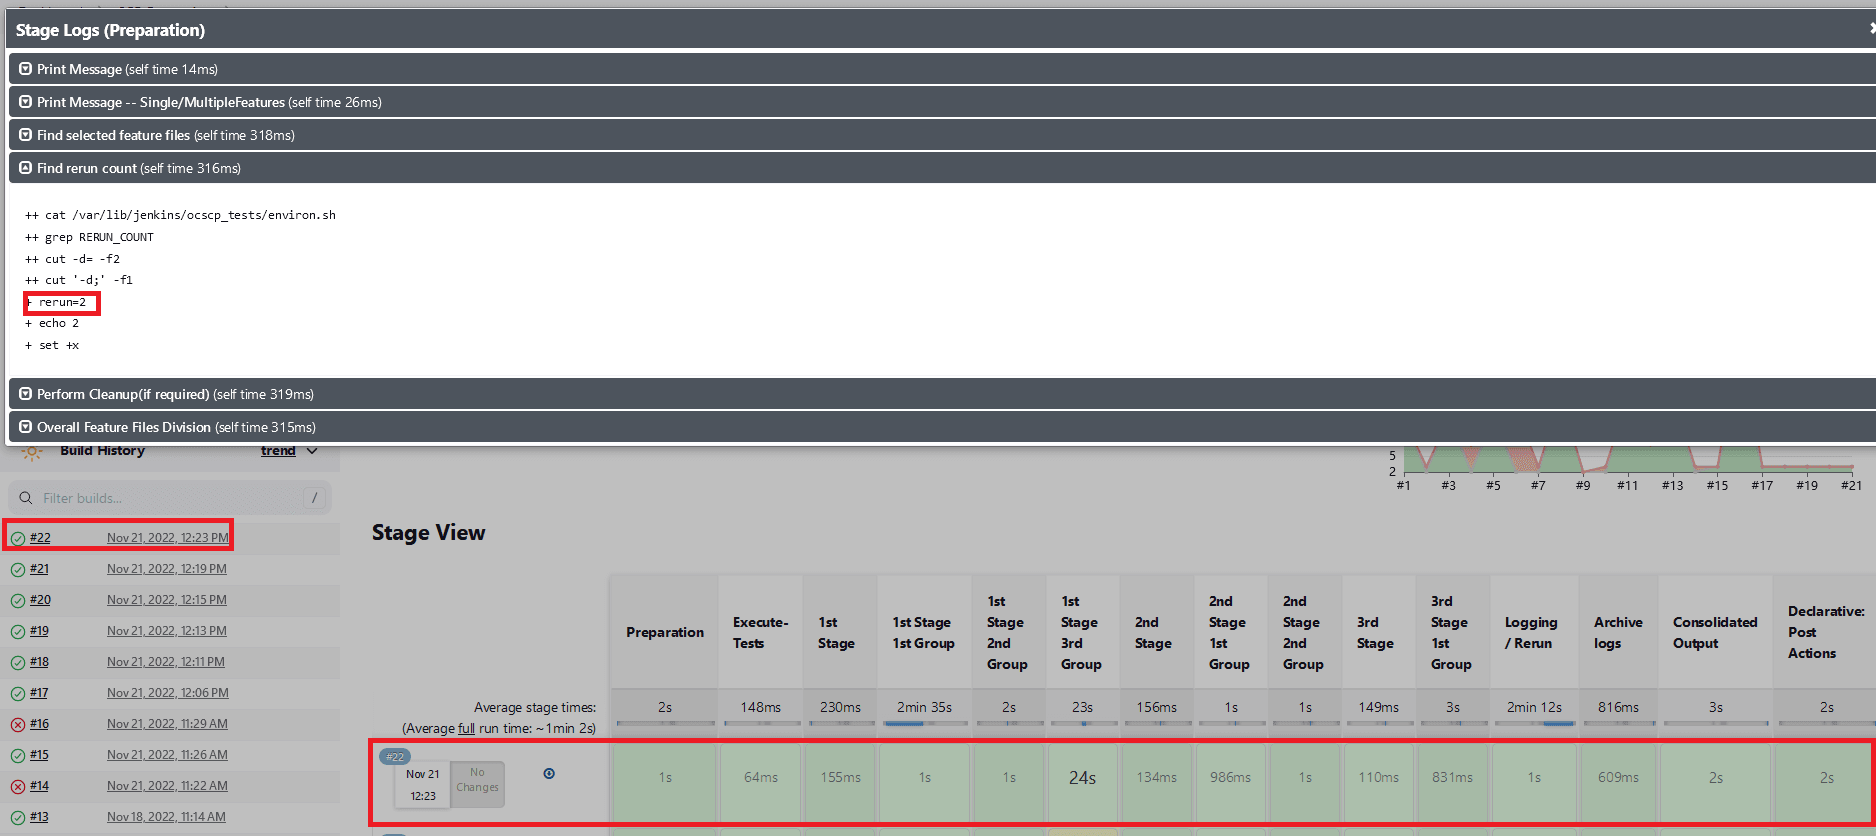
- When
Fetch_Log_Upon_Failureis set to YES and thererun countis set to non-zero. If some of the test cases fail in the initial run and the remaining ones pass in one of the remaining reruns, then the initial test case execution stages will show as yellow, the remaining stages as green, and the overall pipeline status as blue.Figure 2-50 Test Cases Fail in the Initial Run and the Remaining Ones Pass
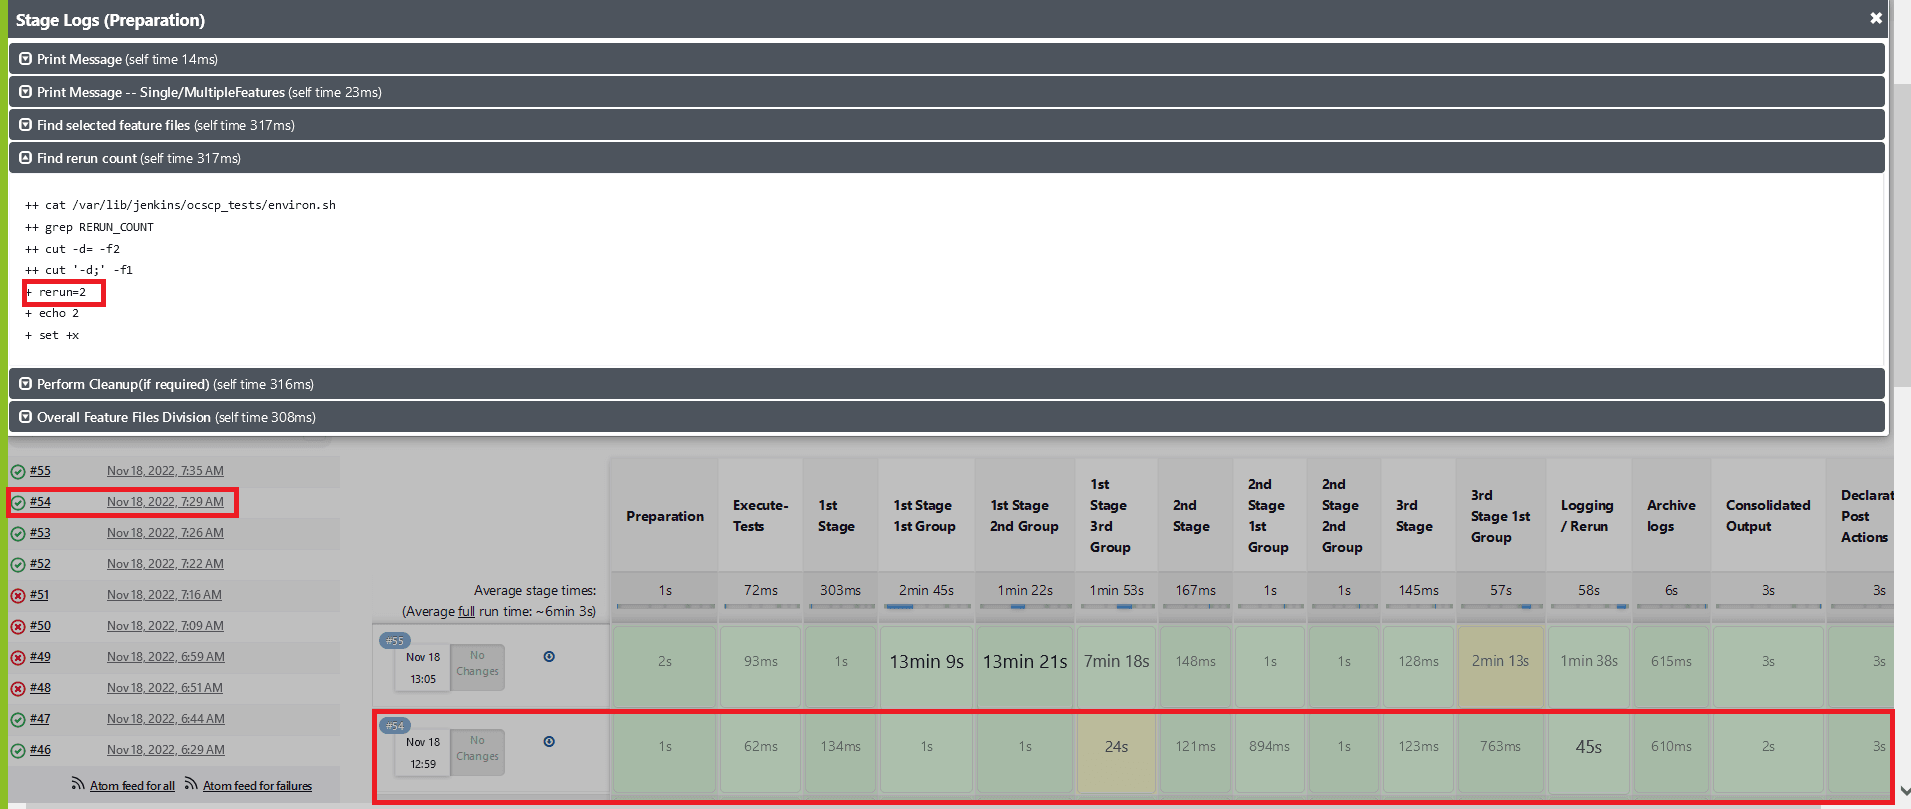
- When
Fetch_Log_Upon_Failureis set to YES and thererun countis set to non-zero. If some of the test cases fail in the initial run and the remaining ones fail in all the remaining reruns, the stages of test case execution will be shown in yellow, the remaining stages in green, and the overall pipeline status in red.Figure 2-51 Test Cases Fail in the Initial and Remaining Reruns
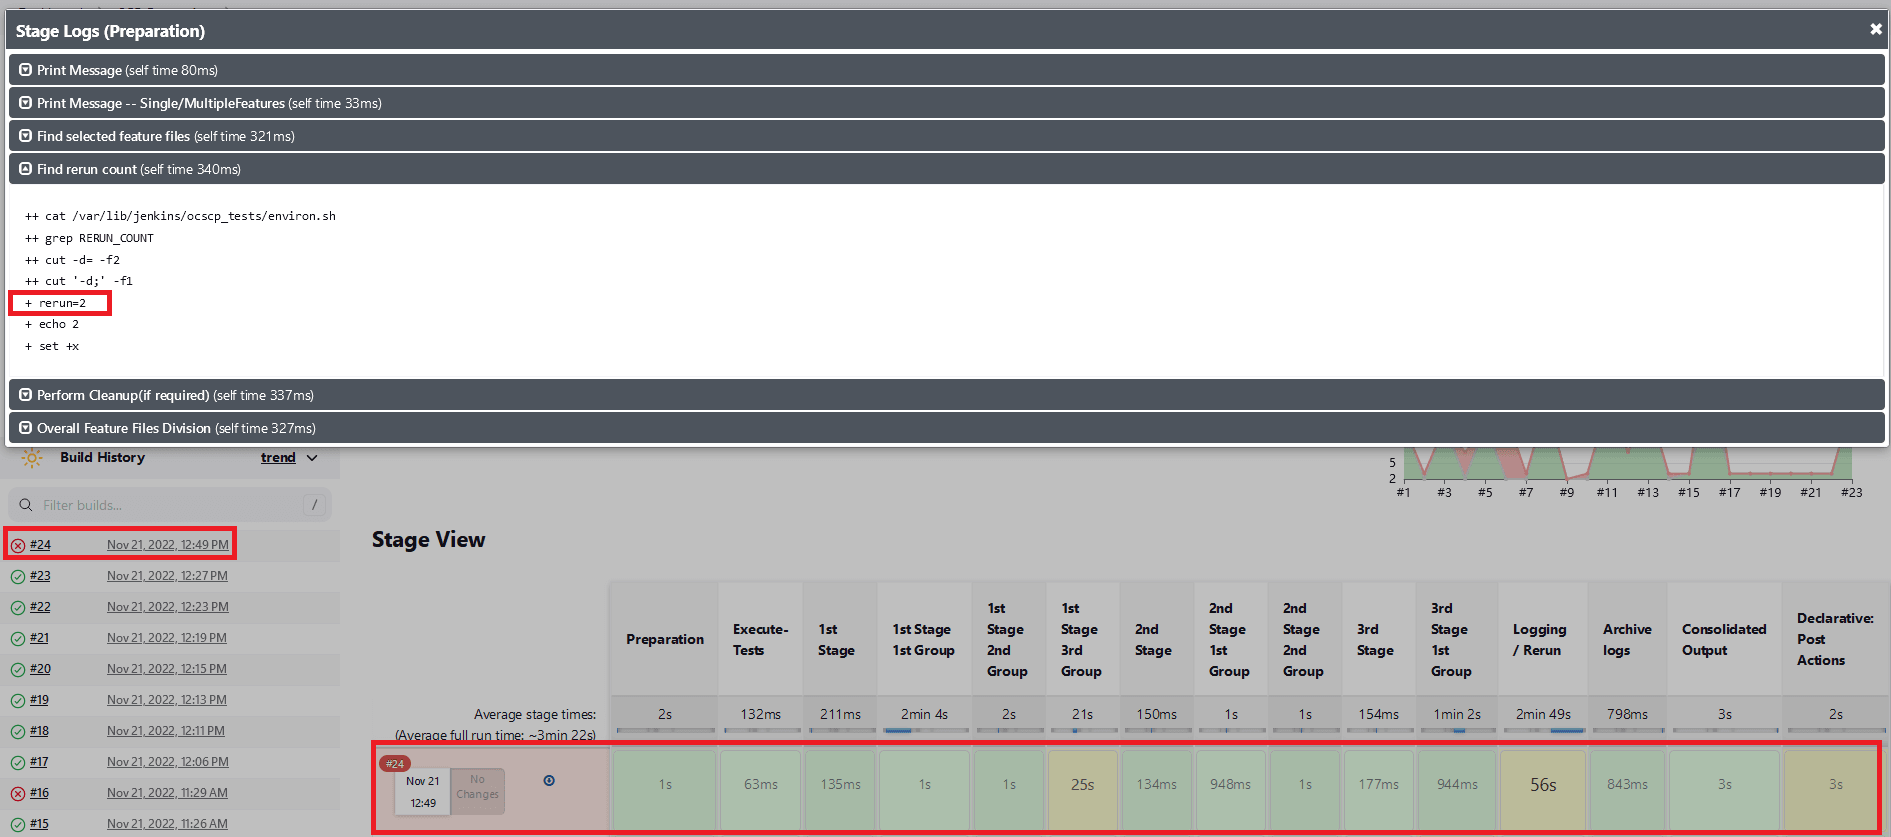
- Whenever any of the multiple Behave processes that are running
in the ATS are exited without completion, the stage in which the process
exited and the consolidated output stage are shown as yellow, and the
overall pipeline status will be yellow. Also in the consolidated output
stage, near the respective stage result, the exact run in which the Behave
processes exited without completion will be printed.
Figure 2-52 Stage View When Behave Process is Incomplete

Figure 2-53 Consolidated Report for a Group When a Behave Process was Incomplete

Implementing Application Log
ATS automatically fetches the SUT Debug logs during the rerun cycle if it encounters any failures and saves them in the same location as the build console logs. The logs are fetched for the rerun time duration only using the timestamps. If, for some microservices, there are no log entries in that time duration, it does not capture them. Therefore, the logs are fetched only for the microservices that have an impact or are associated with the failed test cases.
Location of SUT Logs:
/var/lib/jenkins/.jenkins/jobs/PARTICULAR-JOB-NAME/builds/BUILD-NUMBER/date-timestamp-BUILD-N.txt
Note:
The file name of the SUT log is added as a suffix with the date, timestamp, and build number (for which the logs are fetched). These logs share the same retention period as build console logs, set in the ATS configuration. It is recommended to set the retention period to optimal owing to the Persistent Volume Claim (PVC) storage space availability.
.2.16 Modifying Login Password
You can log in to the ATS application using the default login credentials. The default login credentials are shared for each NF in the respective chapter of this guide.
- Log in to the ATS application using the default login credentials. The home page of the respective NF appears.
- Click the down arrow next to the user name.
- Click Configure.
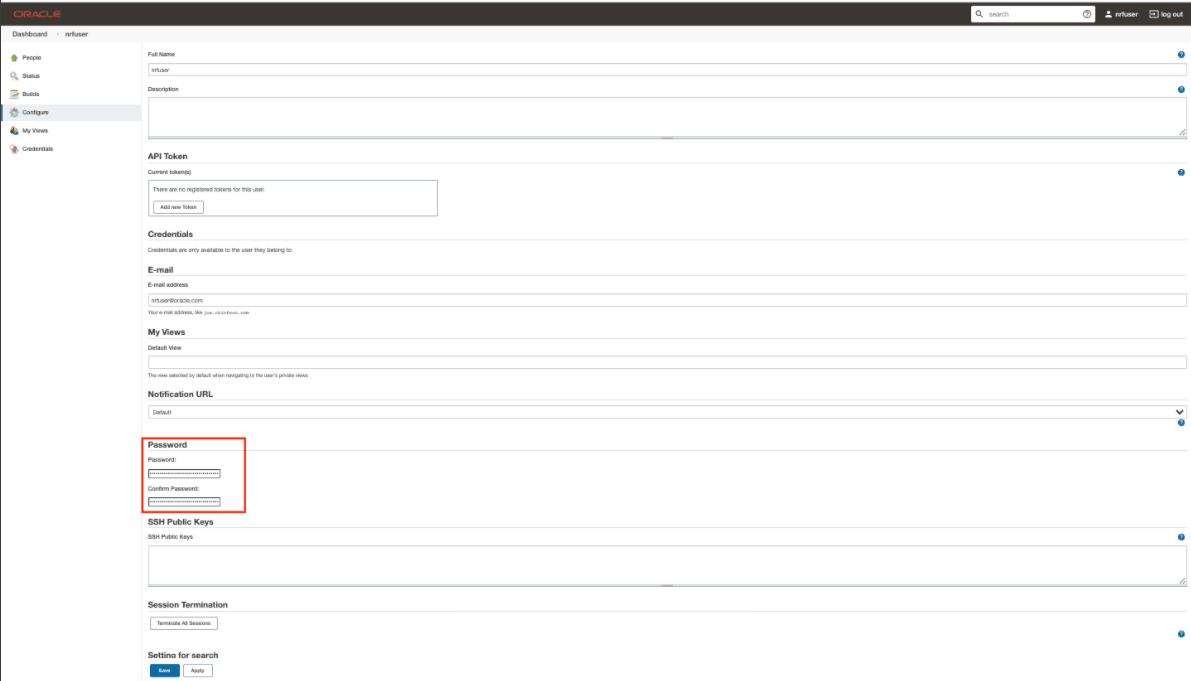
- In the Password section, enter the new password in the
Password and Confirm Password
fields..
Figure 2-54 Logged-in User Details
- Click Save.
A new password is set for you.
2.17 Multiselection Capability for Features and Scenarios
ATS allows you to select and run single or multiple features and scenarios by selecting a check box for the corresponding features or scenarios.
2.17.1 Feature Level Selection
- Log in to ATS using the respective <NF> login credentials.
- On the NF home page, click any new feature or regression pipeline from where you want to run the feature.
- In the left navigation pane, click Build with Parameters.
- Scroll down to the FEATURES AND TEST CASES section.
- Click Select from the
Features drop-down.
Figure 2-55 Feature Selection

- Select any number of features by selecting the check box for the corresponding feature you want to run from the list available for execution.
- Click Build.
2.17.2 Scenario Selection
- Log in to ATS using the respective <NF> login credentials.
- On the NF home page, click any new feature or regression pipeline from where you want to run the feature.
- In the left navigation pane, click Build with Parameters.
- Scroll down to the FEATURES AND TEST CASES section.
- Click Select from the Features drop-down.
- Select any number of features by selecting the check box for the corresponding feature to view the TestCases details mapped to each feature.
- Click Select from the TestCases
drop-down.
Figure 2-56 Scenario or Testcase Selection

- Select the check box for the corresponding test case or scenario to run the test cases mapped to the feature.
- Click Build.
2.18 Parallel Test Execution
Parallel test execution allows you to perform multiple logically grouped tests simultaneously on the same System Under Test (SUT) to reduce the overall execution time of ATS.
ATS currently runs all its tests in a sequential manner, which is time-consuming. With parallel test execution, tests can be run concurrently rather than sequentially or one at a time. Test cases or feature files are now separated into different folders, such as stages and groups, for concurrent test execution. Different stages, such as stage 1, stage 2, and stage 3, run the test cases in a sequential order, and each stage has its own set of groups. Test cases or feature files available in different groups operate in parallel. When all the groups within one stage have completed their execution, only then the next stage will start the execution.
Pipeline Stage View
The pipeline stage view appears as follows:
Figure 2-57 Pipeline Stage View

Pipeline Blue Ocean View
Figure 2-58 Pipeline Blue Ocean View

Impact on Other Framework Features
2.18.1 ATS GUI Page Changes
This section describes the changes to the ATS GUI page to trigger a build.
Changes in ATS GUI Page to Trigger a Build
The feature name, file name, and test case name are displayed under their stage and group names.
Figure 2-59 Displays Stages and Groups

2.18.2 ATS Console Log Changes
- A test case's stage and group names are listed in the logger
statements for that test case.
Figure 2-60 Logger Statement

- When a test case fails, a list of test cases running in parallel
gets printed to make the debugging easier. The name of the test case and the
absolute path to the feature file it belongs to are listed in this list.
Figure 2-61 Absolute Path of Feature File
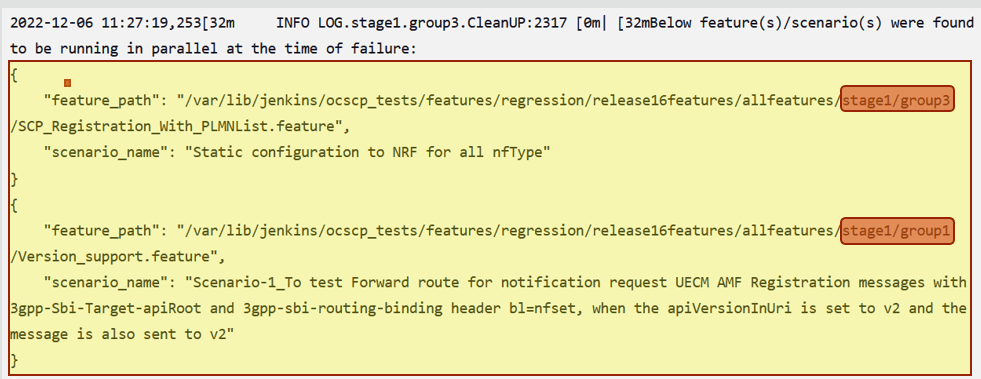
- The test result summary contains a summary for each group and an overall summary, along with the details of failing scenarios (stage-groupwise) and the total time taken by any pipeline execution. For further information, see the Managing Final Summary Report, Build Color, and Application Log.
2.18.3 Downloading or Viewing Individual Group Logs
- On the Jenkins pipeline page, click Open Blue Ocean in the left
navigation pane.
Figure 2-62 Jenkins Pipeline Page
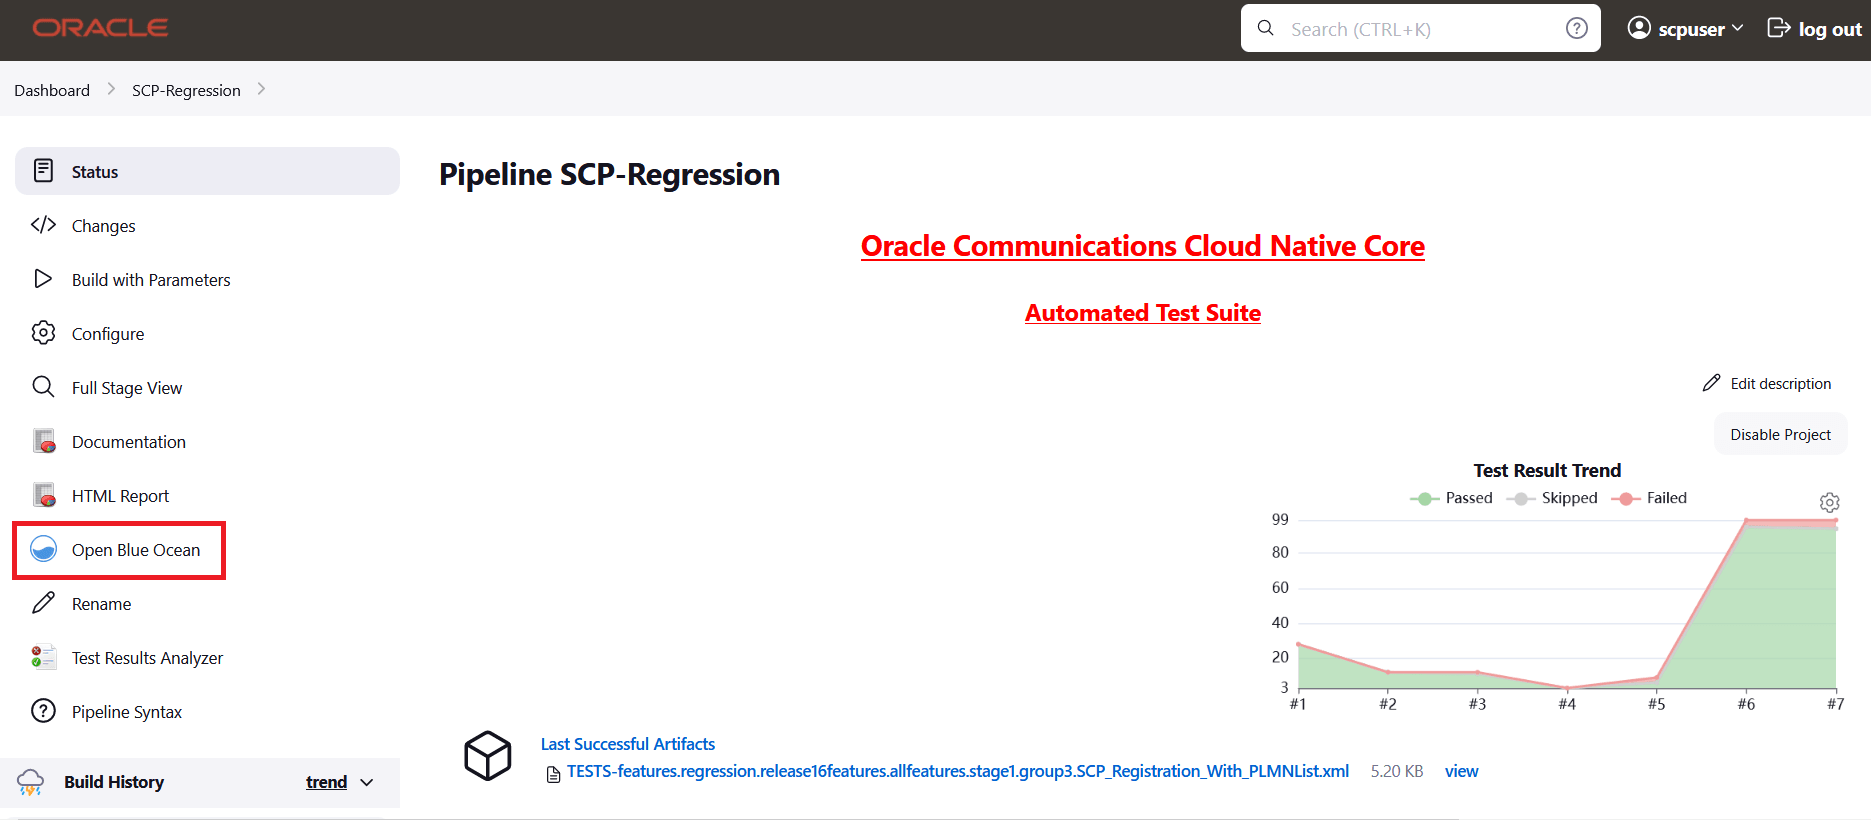
- Click the desired build row on the Blue Ocean page.
Figure 2-63 Run the Build
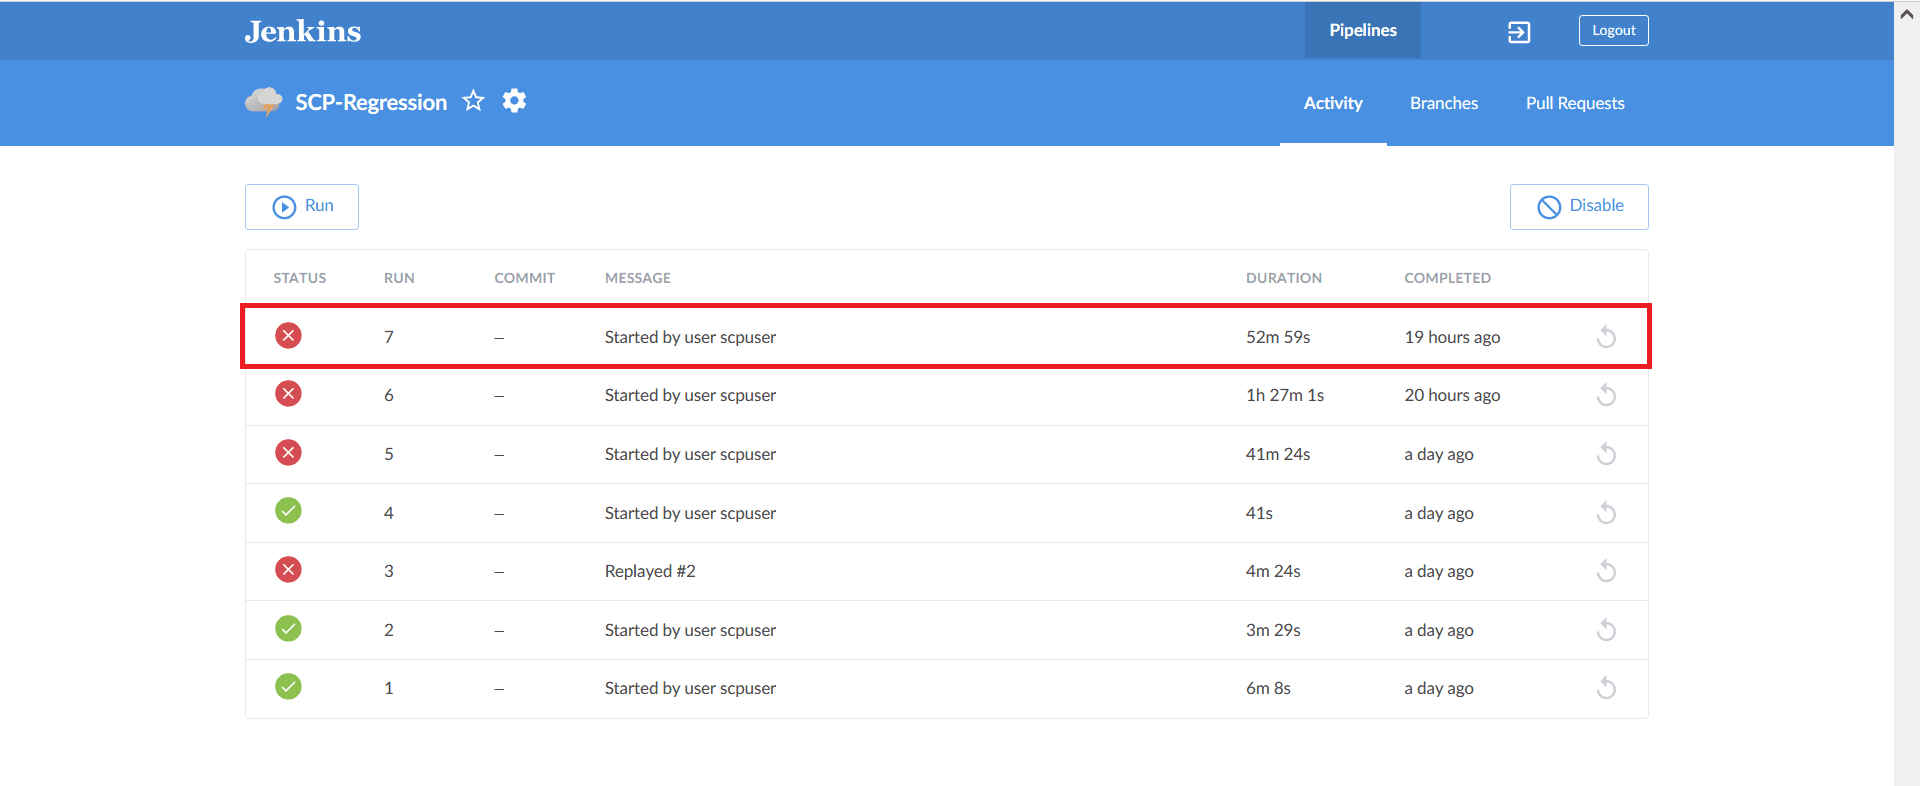
- The selected build appears. The diagram displays the order in which the
different stages, or groups, are executed.
Figure 2-64 Stage Execution

- Click the desired group to download the logs.
Figure 2-65 Executed Groups
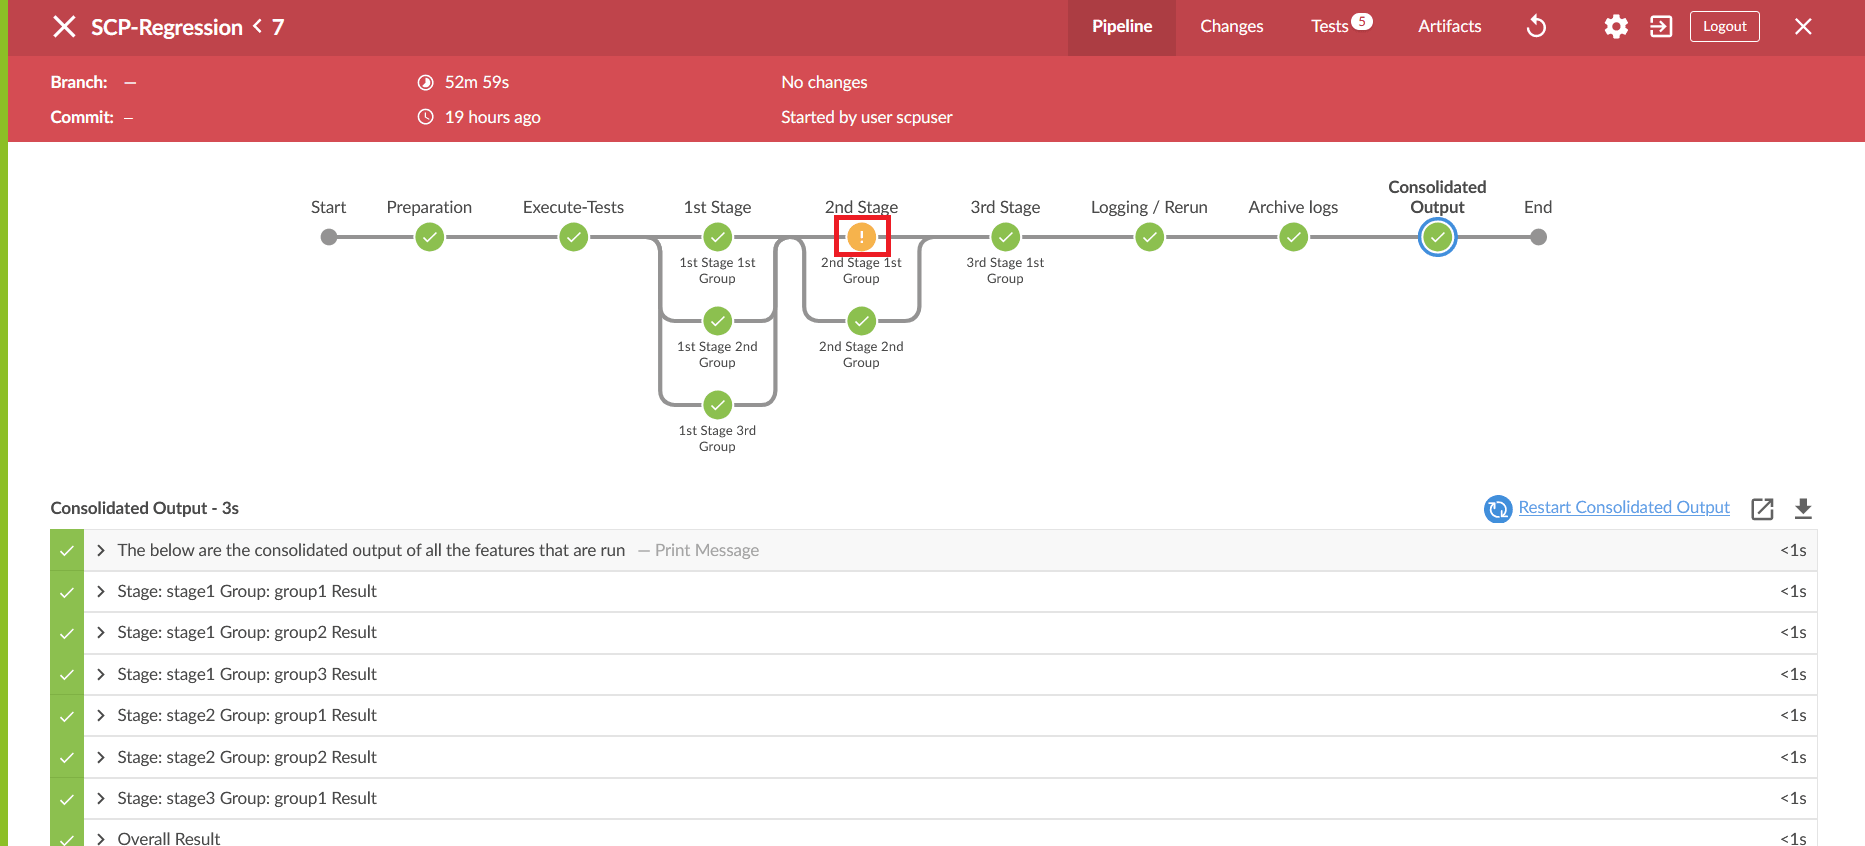
- Click the Download icon on the bottom right of the pipeline. The log for
the selected group is downloaded to the local system.
Figure 2-66 Download Logs
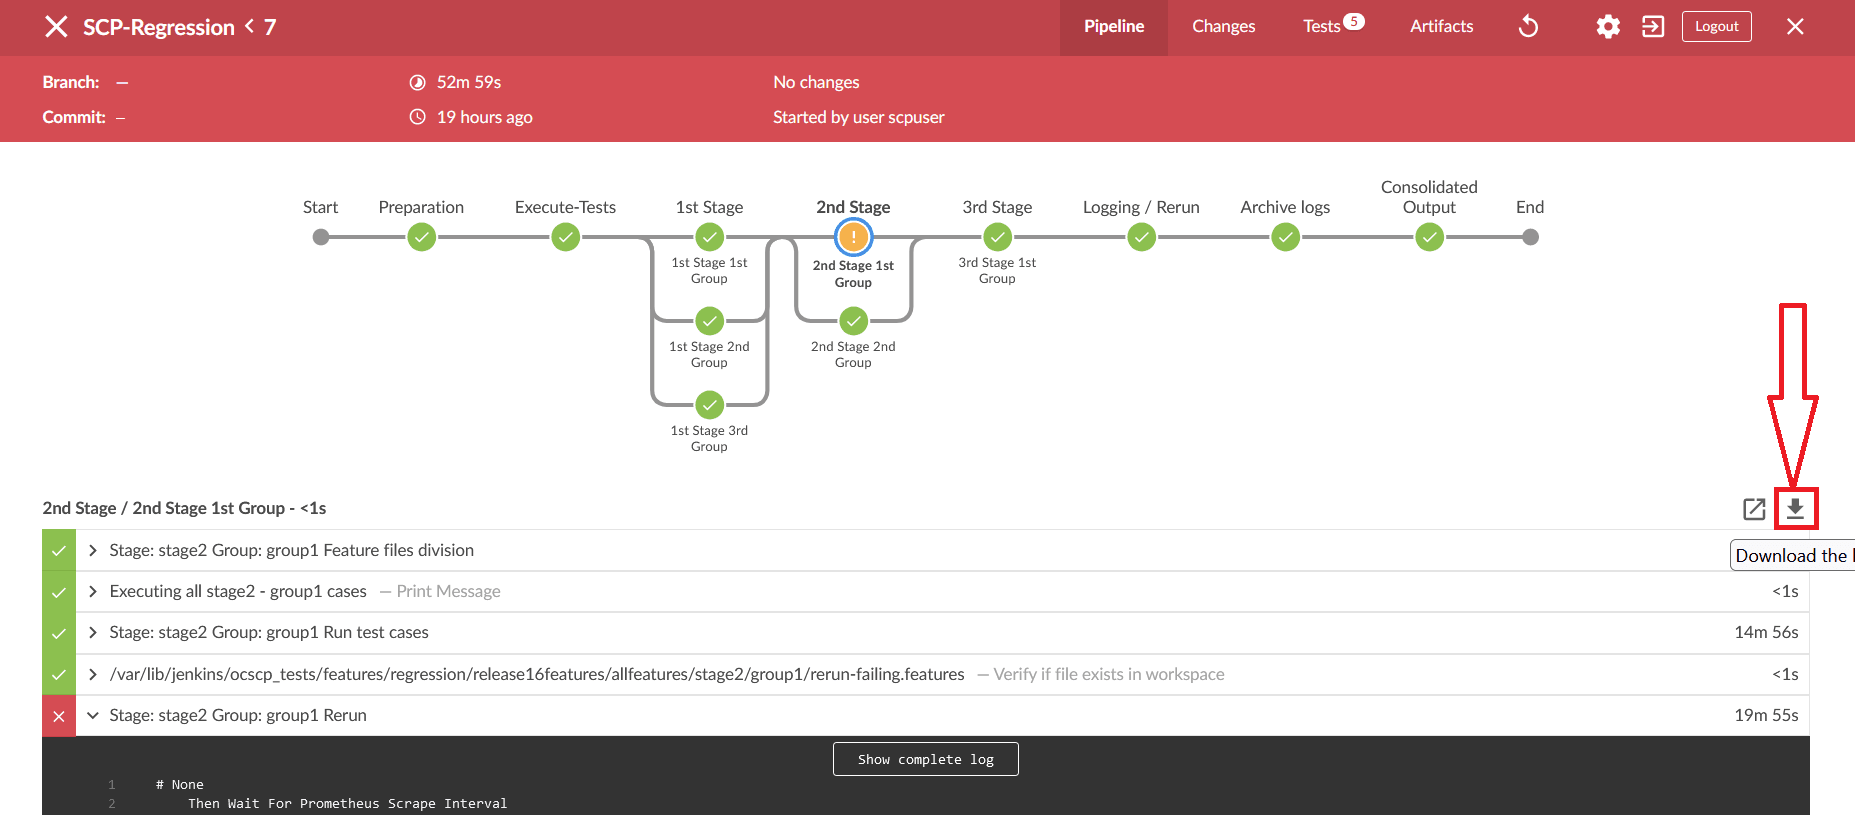
- To view the log, click the Display Log icon. The logs are displayed in a
new window.
Figure 2-67 Display Logs
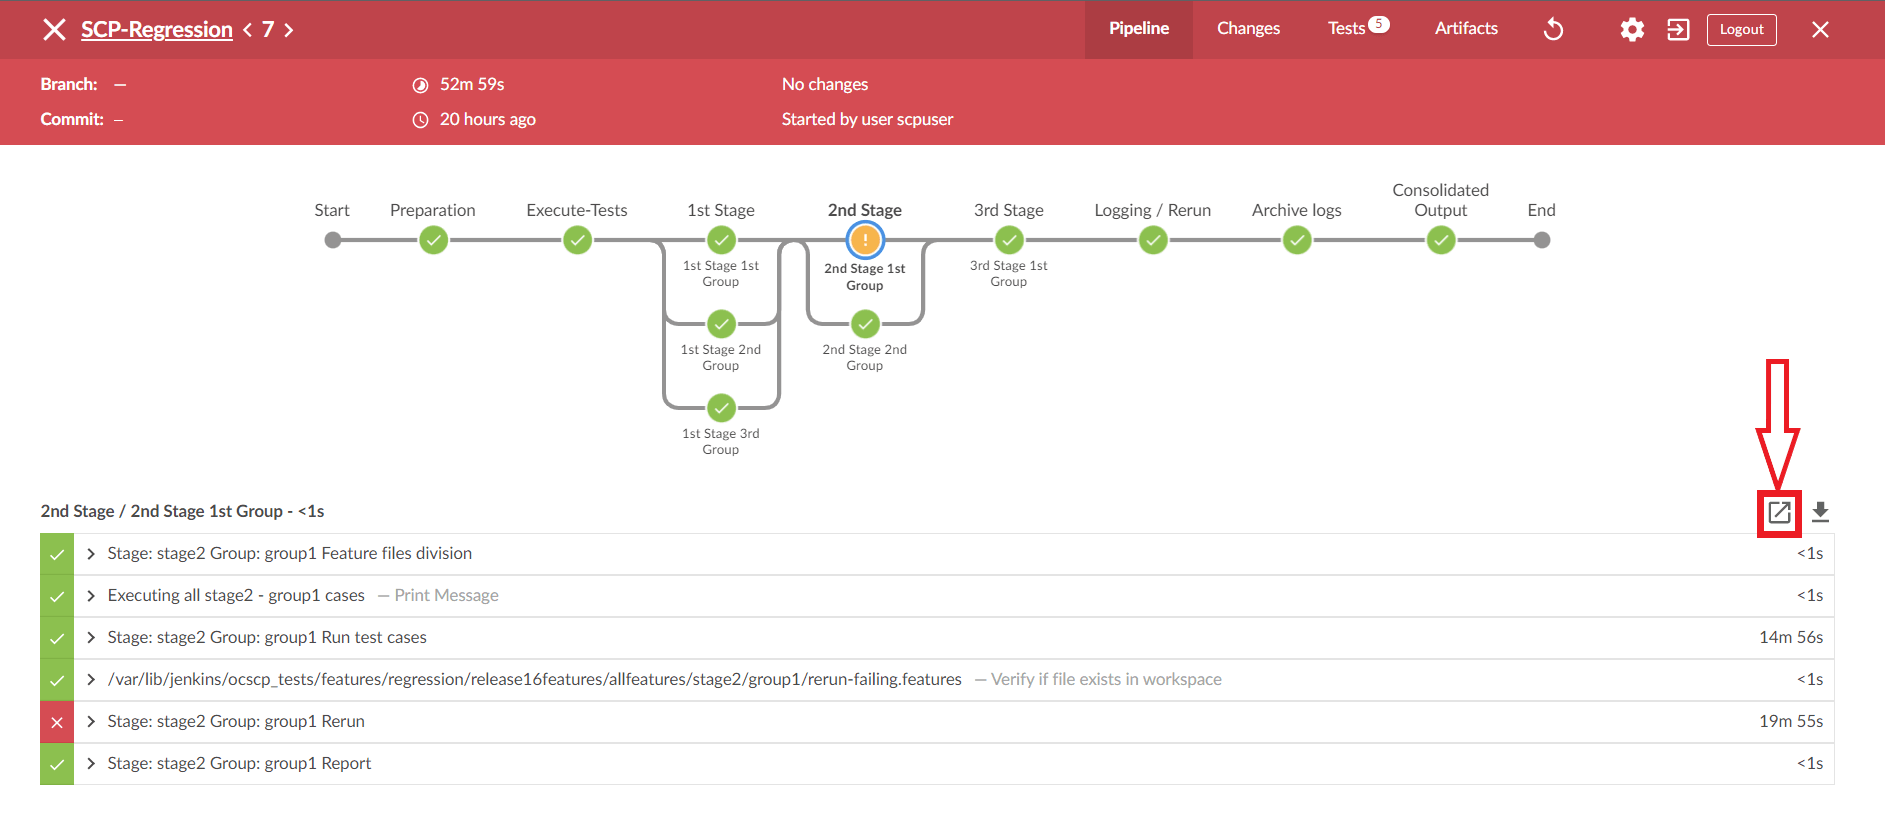
Viewing Individual Group Logs without using Blue Ocean
- Using Stage View
- On the Jenkins pipeline page, hover the cursor over the group in stage view to view the logs.
- Click the label Logs" which appears in a
pop-up.
There will be a new pop-up window. It contains many rows, where each row corresponds to the execution of one Jenkins step.
- Click the row labeled Stage: stage_name>."Group: <group_name> Run test cases to view the log for this group's execution.
- Click the row labeled Stage: stage_name>." "group_name> Rerun to display the rerun logs.
- Using Pipeline Steps Page
- On the Jenkins pipeline page, click the desired build number under the Build History drop down.
- Click the Pipeline Steps button on the left
pane.
A table with columns for step, arguments, and status appears.
- Under the Arguments column, find the label for the desired stage and group.
- Click the step with the label Stage: <stage_name>Group: <group_name>.
- Run test cases under it, or click the Console output icon near the status to view the log for this group execution.
- To see rerun logs, find the step with the label Stage: <stage_name> Group: <group_name>Rerun under it.
2.19 Parameterization
This feature allows you to provide or adjust values for the input and output
parameters needed for the test cases to be compatible with the SUT configuration. You
can update or adjust the key-value pair values in the global.yaml
and feature.yaml files for each of the feature files so that they
are compatible with SUT configuration. In addition to the existing custom test case
folders (Cust New Features, Cust Regression, and Cust Performance), this feature enables
folders to accommodate custom data, default product configuration, and custom
configuration. You can maintain multiple versions or copies of the custom data folder to
suit varied or custom SUT configurations. With this feature, the ATS GUI has the option
to either execute test cases with the default product configuration or with a custom
configuration.
- Define parameters and assign or adjust values to make them compatible with SUT configuration.
- Execute test cases either with default product configurations or custom configurations and multiple custom configurations to match varied SUT configurations.
- Assign or adjust values for input or output parameters through custom or default configuration yaml files (key-value pair files).
- Define or adjust the input or output parameters for each feature file with its corresponding configuration.
- Create and maintain multiple configuration files to match multiple SUT configurations.
Figure 2-68 SUT Design Summary

- The Product Config folder contains default product configuration files (feature-wise yaml per key-value pair), which are compatible with default product configuration.
- New features, Regression and Performance, Data folder, and Product Config folders are replicated or copied into custom folders and delivered as part of the ATS package in every release.
- You can customize custom folders by:
- Removing test cases not needed or as appropriate for your use.
- Adding new test cases as needed or as appropriate for your use.
- Removing or adding data files in the cust_data folder or as appropriate for your use.
- Adjusting the parameters or values in the key-value pair per yaml file in the custom config folder for test cases to run or pass with a custom configured SUT.
- The product folders are always intact (unchanged) and you can update the Custom folders
- You can maintain multiple copies of Custom Configurations and bring them to use as needed or as appropriate for the SUT configuration.
Figure 2-69 Folder Structure

2.19.1 Running Test Cases
Enable
Rename or copy the Cust Config [1/2/3/N] folder to the Cust Config folder in order for ATS to run the test cases with a specific custom configuration. When the option to run test cases with custom configuration is chosen, it always points to the Cust Config folder.
To Run ATS Test Cases
- If custom configuration is selected, then test cases from custom folders are populated on the ATS UI, and custom configuration is applied to them through the key-value pair per yaml file defined or present in the "Cust Config" folder.
- If product configuration is selected, then the test cases from product folders are populated on the ATS UI, and product configuration is applied to them through key-value pairs per yaml file defined or present in the Product Config folder.
Figure 2-70 ATS Execution Flow
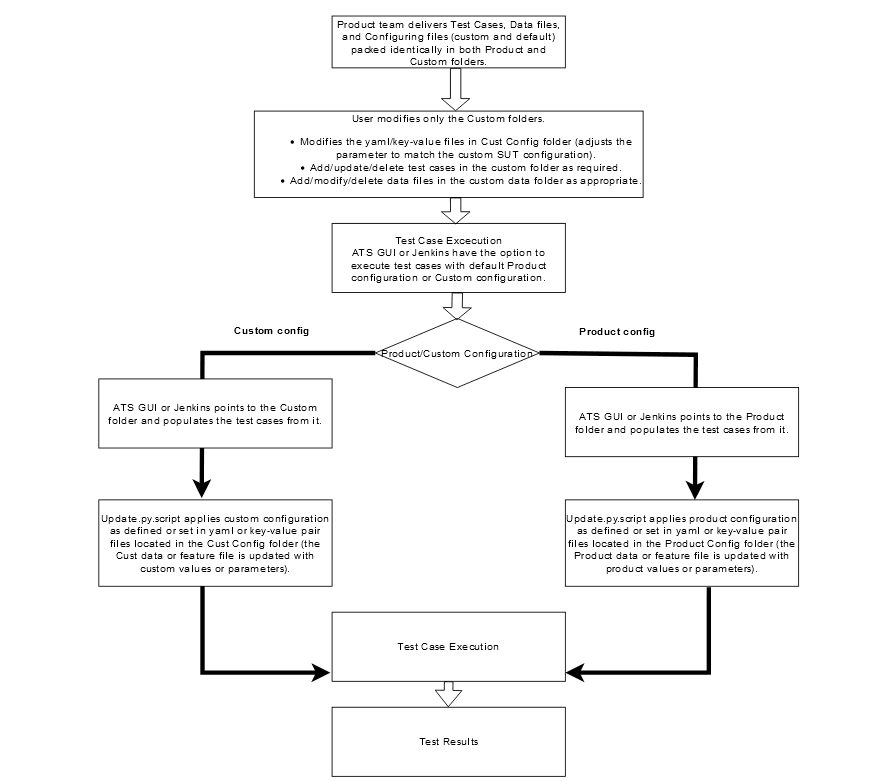
Figure 2-71 Sample: Configuration_Type

2.20 PCAP Log Collection
PCAP Log Collection allows collecting the NF, SUT, or PCAP logs from the debug tool sidecar container. This feature can be integrated and delivered as a standalone or along with the Application Log Collection feature. For information, see Application Log Collection.
PCAP Log Integration
- The Debug tool should be enabled on SUT Pods while deploying the NF. The
name of the Debug container must be "tools".
For example, in SCP, the debug tool should be enabled for all the SCP microservice pods.
- Update the following parameters in the values.yaml file, under the
resource section, with ATS minimum resource requirements:
- CPU: 3
- memory: 3Gi
- On the home page, click any new feature or regression pipeline.
- In the left navigation pane, click Build with Parameters.
- Select YES from the Fetch_Log_Upon_Failure drop-down menu.
- If option Log_Type is available, select value PcapLog [Debug Container Should be Running] for it.
- Select PcapLog [Debug Container Should be Running] to activate PCAP Log Collection in ATS-NF.
- After the build execution is complete, go into the ATS pod, then
navigate to below path to find the pcaplogs:
.jenkins/jobs/<Pipeline
                    Name>/builds/<build number>/
For example,
.jenkins/jobs/SCP-Regression/builds/5/Pcaplogs is present in zip form. Unzip it to get the log files.
2.20.1 Application Log Collection and Parallel Test Execution Integration
A new stage,"Logging/Rerun", has been added at the end of the Execute-Tests stage to collect rerun logs, such as applog and PCAP logs, by running the failed test cases in a sequence.
Figure 2-72 Logging/Rerun new stage

Fetch_Log_Upon_Failure parameter is set to YES and if any
test case fails in the initial run, then:
- The failed test case reruns and log collection start in the Logging/Rerun stage after the initial run is completed for all the test cases.
- The logs from the initial execution are collected, but they might be incorrect.
- Even if the
rerunparameter is set to 0, the failed test case reruns in the Logging/Rerun stage and the log is collected.Note:
Not applicable for all the NFs. - If the
Fetch_Log_Upon_Failureparameter is set to NO and if any test case fails in the initial run, then the failed test case rerun starts in the same stage after the initial execution is over for all the test cases in its group.
2.21 Persistent Volume for 5G ATS
The Persistent Volume (PV) feature allows ATS to retain historical build execution data, test cases, and ATS environment configurations.
ATS Packaging When Using Persistent Volume
- Without the Persistent Volume option: ATS package includes an ATS image with test cases.
- With Persistent Volume option: ATS package includes the ATS
image and test cases separately. The new test cases are provided between the
releases.
To support both with and without Persistent Volume options, test cases and execution job data are packaged in the ATS image as well as a tar file.
2.21.1 Processing Flow
First Time Deployment
Initially, when you deploy ATS, for example, the PI-A ATS pod, you use PVC-A, which is provisioned and mounted to the PI-A ATS pod. By default, PVC-A is empty. So, you have to copy the data (ocslf_tests and jobs folders) from the PI-A tar file to the pod after the pod is up and running. Then restart the PI-A pod. At this point, you can change the number of build logs to maintain in the ATS GUI.
Subsequent Deployments
When you deploy ATS for the subsequent time, for example, in a PI-B ATS pod, you use PVC-B, which is provisioned and mounted to the PI-B ATS pod. By default, the PVC-B is empty, and you have to copy the data (ocslf_tests and jobs folders) from the PI-B tar file to the pod after the pod is up and running. At this point, copy all the necessary changes to the PI-B pod from the PI-A pod and restart the PI-B pod. You can change the number of build logs to maintain in the ATS GUI. After updating the number of builds, you can delete the PI-A pod and continue to retain the PVC-A. If you do not want backward porting, you can delete PVC-A.
2.21.2 Deploying Persistent Volume
- Before deploying Persistent Volume, create a PVC in the same
namespace where you have deployed ATS. You have to provide values for the
following parameters to create a PVC:
- PVC Name
- Namespace
- Storage Class Name
- Size of the PV
- Run the following command to create a
PVC:
kubectl apply -f - <<EOF

apiVersion: v1
kind: PersistentVolumeClaim
metadata:
  name: <Please Provide the PVC Name>
  namespace: <Please Provide the namespace>
  annotations:
spec:
  storageClassName: <Please Provide the Storage Class Name>
  accessModes:
    - ReadWriteOnce
  resources:
    requests:
      storage: <Please Provide the size of the PV>
EOF
Note:
It is recommended to suffix the PVC name with the release version to avoid confusion during subsequent releases. For example: ocats-slf-pvc-1.9.0The output of the above command with parameters is as follows:
The persistentvolumeclaim/ocats-slf-1.9.0-pvc is created.[cloud-user@atscne-bastion-1 templates]$ kubectl apply -f - <<EOF > > apiVersion: v1 > kind: PersistentVolumeClaim > metadata: > name: ocats-slf-1.9.0-pvc > namespace: ocslf > annotations: > spec: > storageClassName: standard > accessModes: > - ReadWriteOnce > resources: > requests: > storage: 1Gi > EOF - To verify whether PVC is bound to PV and is available for use,
run the following
command:
kubectl get pvc -n <namespace used for pvc creation>The output of the above command is as follows:Figure 2-73 Verifying PVC
 Check that the STATUS is Bound and that the rest of the parameters, such as NAME, CAPACITY, ACCESS MODES, STORAGECLASS, and so on, are the same as specified in the PVC creation command.
Note:
Do not proceed further if there is any issue with PVC creation. Contact your administrator to create a PV. - After creating persistent volume, change the following
parameters in the values.yaml file to deploy persistent volume.
- Set the PVEnabled parameter to "true".
- Provide the value for the PVClaimName parameter. The PVClaimName value should be the same as the value used to create a PVC.
- Before deploying persistent volumes, create a PVC in the same
namespace where you have deployed ATS. You have to provide values for the
following parameters to create a PVC:
- PVC Name
- Namespace
- Storage Class Name
- Size of the PV
- Run the following command to create a
PVC:
kubectl apply -f - <<EOF apiVersion: v1 kind: PersistentVolumeClaim metadata: name: <Please Provide the PVC Name> namespace: <Please Provide the namespace> annotations: spec: storageClassName: <Please Provide the Storage Class Name> accessModes: - ReadWriteOnce resources: requests: storage: <Please Provide the size of the PV> EOF - When creating Persistent Volume Claim in OCI, add the storageClassName
"oci-bv" and maintain the 50 gigabyte storage value.
Note:
The minimum allowed value for parameter "resources.requests.storage" is 50Gi. If the storage is set to any value less than 50Gi, it will be ignored.For example, the output of the above command with parameters is as follows:
The persistentvolumeclaim/ocats-slf-1.9.0-pvc is created.[cloud-user@atscne-bastion-1 templates]$ kubectl apply -f - <<EOF > > apiVersion: v1 > kind: PersistentVolumeClaim > metadata: > name: ocats-slf-1.9.0-pvc > namespace: ocslf > annotations: > spec: > storageClassName: oci-bv > accessModes: > - ReadWriteOnce > resources: > requests: > storage: 50Gi > EOF - To verify whether PVC is bound to PV and is available for use,
run the following
command:
kubectl get pvc -n <namespace used for pvc creation>The output of the above command is as follows:Figure 2-74 Verifying PVC

- After creating persistent volume, the STATUS will be Pending and when the ATS pod is deployed with that PVC, its status will become "BOUND".
- Change the following parameters in the values.yaml file to
deploy persistent volume.
- Set the PVEnabled parameter to "true".
- Provide the value for the PVClaimName parameter. The PVClaimName value should be the same as the value used to create a PVC.
- After deploying ATS, copy the <nf_main_folder> and
<jenkins jobs> folders from the tar file to their ATS pod, and then
restart the pod as a one-time activity.
- Run the following command to extract the tar
file:
ocats-<nf_name>-data-<release-number>.tgzNote:
The ats_data.tar file is the name of the tar file containing <nf_main_folder> and jobs folders. It can be different for different NFs. - Run the following set of commands to copy the required
folders:
kubectl cp ats_data/jobs <namespace>/<pod-name>:/var/lib/jenkins/.jenkins/kubectl cp ats_data/<nf_main_folder> <namespace>/<pod-name>:/var/lib/jenkins/ - Run the following command to restart the pods as one-time
activity:
kubectl delete po <pod-name> -n <namespace>Note:
Before running the following command, copy the changes done on the new release pod from the old release pod using thekubectl cpcommand. [Applicable in the case of subsequent deployment only]
- Run the following command to extract the tar
file:
- When the pod is up and running, log in to the ATS GUI and go to
your NF specific pipeline. Click Configure in the left navigation
pane. The General tab appears. Configure the Discard old
Builds option. This option allows you to configure the number of
builds you want to retain in the persistent volume.
Figure 2-75 Discard Old Builds

Note:
It is recommended to configure this option. If you do not input a value for this option, the application will take into account all builds, which could be a large number, and will completely consume the Persistent Volume.
2.21.3 Backward Porting
The following deployment steps apply to the old release of PVC-supported ATS Pod.
Note:
This procedure is for backward porting purposes only and should not be considered a subsequent release of the POD deployment procedure.- Change the PVEnabled parameter to "true".
- Provide the name of the old PVC as the value for parameter PVClaimName.
2.22 Single Click Job Creation
With the help of Single Click Job Creation feature, ATS users can easily create a job to run TestSuite with a single click.
2.22.1 Configuring Single Click Job
Prerequisite: The network function specific user should have 'Create Job' access.
Perform the following procedure to configure the single-click feature:
- Log in to ATS using network function specific log-in credentials..
- Click New Item in the left navigation pane of
the ATS application. The following page appears:
Figure 2-76 New Item Window
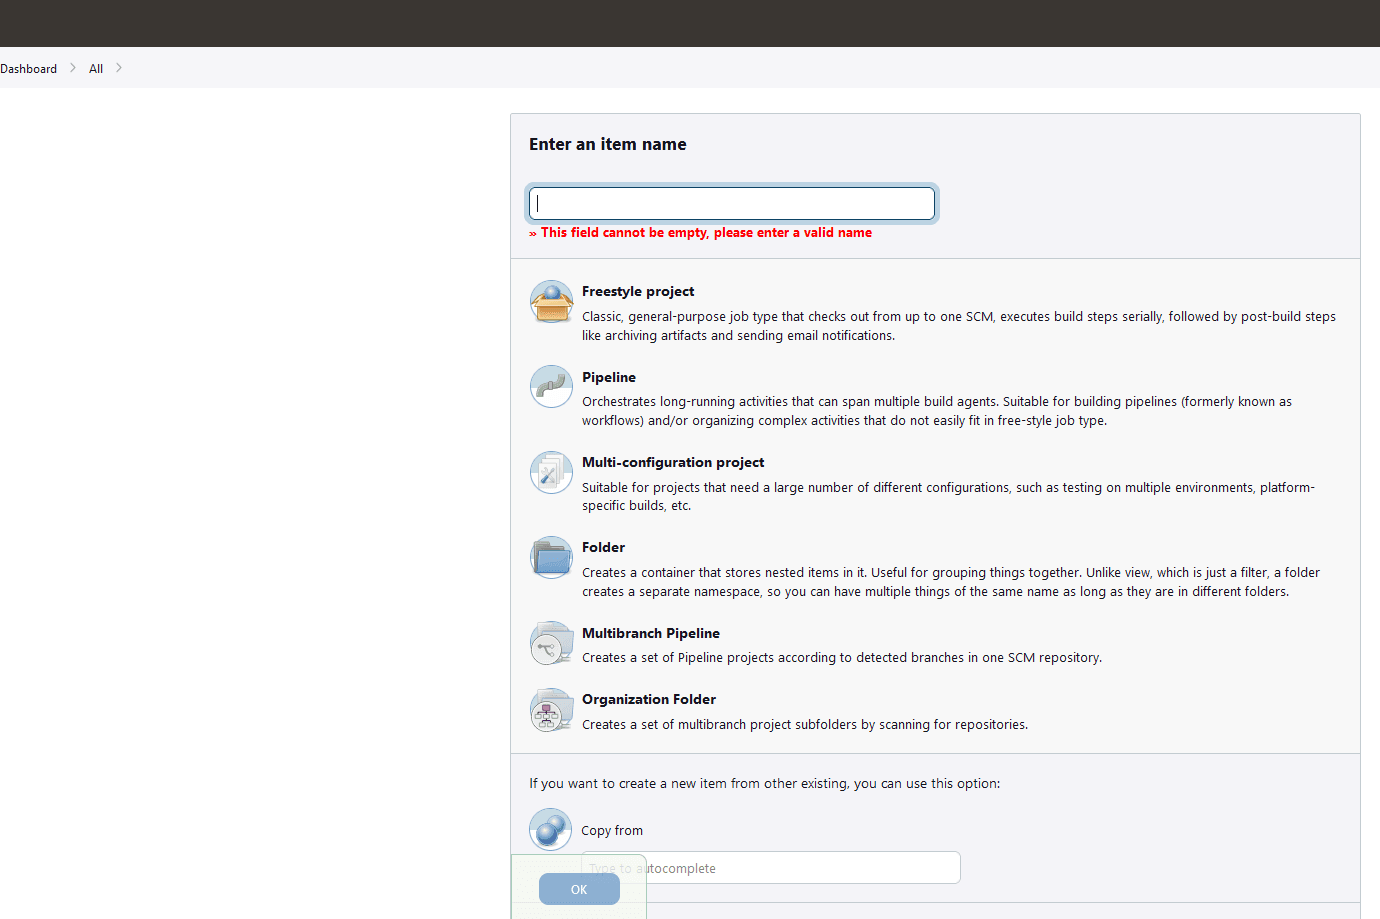
- In the Enter an item name text box, enter the job name. Example: <NF-Specific-name>-NewFeatures.
- In the Copy from text box, enter the actual job name for which you need single-click execution functionality. Example: <NF-Specific-name>-NewFeatures.
- Click OK. You are automatically redirected to edit the newly created job's configuration.
- Under the General group, deselect the This Project is Parameterised option.
- Under the Pipeline group, make the corresponding changes to remove the 'Active Choice Parameters' dependency.
- Provide the default values for the TestSuite,
SUT, Select_Option,
Configuration_Type, and other parameters, as required, on
the BuildWithParameters page.
Example: Pipeline without Active Choice Parameter Dependency
node ('built-in'){ //a = SELECTED_NF b = PCF_NAMESPACE c = PROMSVC_NAME d = GOSTUB_NAMESPACE //e = SECURITY f = PCF_NFINSTANCE_ID g = POD_RESTART_TIME h = POLICY_TIME //i = NF_NOTIF_TIME j = RERUN_COUNT k =INITIALIZE_TEST_SUITE l = STUB_RESPONSE_TO_BE_SET //m = POLICY_CONFIGURATION_ADDITION n = POLICY_ADDITION o = NEXT_MESSAGE //p = PROMSVCIP q = PROMSVCPORT r = TIME_INT_POD_DOWN s = POD_DOWN_RETRIES //t = TIME_INT_POD_UP u = POD_UP_RETRIES v = ELK_WAIT_TIME w = ELK_HOST //x = ELK_PORT y = STUB_LOG_COLLECTION z = LOG_METHOD A = enable_snapshot B = svc_cfg_to_be_read C = PCF_API_ROOT //Description of Variables: //SELECTED_NF : PCF //PCF_NAMESPACE : PCF Namespace //PROMSVC_NAME : Prometheus Server Service name //GOSTUB_NAMESPACE : Gostub namespace //SECURITY : secure or unsecure //PCF_NFINSTANCE_ID : nfInstanceId in PCF application-config config map //POD_RESTART_TIME : Greater or equal to 60 //POLICY_TIME : Greater or equal to 120 //NF_NOTIF_TIME : Greater or equal to 140 //RERUN_COUNT : Rerun failing scenario count //TIME_INT_POD_DOWN : The interval after which we check the POD status if its down //TIME_INT_POD_UP : The interval after which we check the POD status if its UP //POD_DOWN_RETRIES : Number of retry attempt in which will check the pod down status //POD_UP_RETRIES : Number of retry attempt in which will check the pod up status //ELK_WAIT_TIME : Wait time to connect to Elastic Search //ELK_HOST : Elastic Search HostName //ELK_PORT : Elastic Search Port //STUB_LOG_COLLECTION : To Enable/Disable Stub logs collection //LOG_METHOD : To select Log collection method either elasticsearch or kubernetes //enable_snapshot: Enable or disable snapshots that are created at the start and restored at the end of each test run //svc_cfg_to_be_read: Timer to wait for importing service configurations //PCF_API_ROOT: PCF_API_ROOT information to set Ingress gateway service name and port withEnv([ 'TestSuite=NewFeatures', 'SUT=PCF', 'Select_Option=All', 'Configuration_Type=Custom_Config' ]){ sh ''' sh /var/lib/jenkins/ocpcf_tests/preTestConfig-NewFeatures-PCF.sh \ -a PCF \ -b ocpcf \ -c occne-prometheus-server \ -d ocpcf \ -e unsecure \ -f fe7d992b-0541-4c7d-ab84-c6d70b1b0123 \ -g 60 \ -h 120 \ -i 140 \ -j 2 \ -k 0 \ -l 1 \ -m 1 \ -n 15 \ -o 1 \ -p occne-prometheus-server.occne-infra\ -q 80\ -r 30\ -s 5\ -t 30\ -u 5\ -v 0\ -w occne-elastic-elasticsearch-master.occne-infra\ -x 9200\ -y yes\ -z kubernetes\ -A no\ -B 15\ -C ocpcf-occnp-ingress-gateway:80\ ''' load "/var/lib/jenkins/ocpcf_tests/jenkinsData/Jenkinsfile-Policy-NewFeatures" } } - Click Save. The ATS application is ready to run TestSuite with 'SingleClick' using the newly created job.
2.23 Support for ATS Deployment in OCI
Oracle Cloud Infrastructure (OCI) is a set of complementary cloud services that enable you to build and run a range of applications and services in a highly-available, consistently high-performance environment. OCI offers powerful computing capabilities and storage capacity in a flexible virtual network that can be accessed from your on-premises network.
OCI infrastructure consists of Compartments, Network Load balancer, Bastion Host, Dynamic Routing Gateway (DRG), Remote Peering Connection (RPC), Service Gateway, Internet Gateway, and Oracle Kubernetes Engine (OKE) cluster, all in an OKE VCN.
ATS deployment is also supported in OCI.
2.23.1 Accessing ATS GUI in OCI
The following two ways are supported to access the ATS GUI in OCI:
- Add proper Ingress or Egress security rules for ports (8080/8443) and ATS service Node port in loadbalancer (nf_lb_subnet) and Node subnet (nf_node_subnet). To add ingress and egress security rules, see the Adding Ingress and Egress Rules to Access the OCI Console.
- Insert the following annotations under the
Metadata section in ATS service object to assign an
external IP (Loadbalancer
IP):
oci-network-load-balancer.oraclecloud.com/security-list-management-mode: None
oci.oraclecloud.com/load-balancer-type: nlb
Note:
This can be done by editing and saving ATS service object after ATS deployment:For example,kubectl edit svc ats-service-name -n ats-namespace - Access the GUI using URL:
<http/https>://<Loadbalancer
                        IP>:<8080/8443>
Note:
- To open ATS GUI with https (TLS enabled), Load balancer IP must be known before deployment and listed down in the alt_names section of the ssl.conf file while generating the application or client certificate. Otherwise, the ATS GUI will open, but it will show "Not Secure" in the browser address bar. For more information, see the Support for Transport Layer Security section.
- The assignment of Loadbalancer IP to the ATS service is subject to availability. If the Loadbalancer IP is not assigned to the ATS service even after applying the required annotations, try to debug on the OCI side.
- Add an ingress security rule for the node subnet (nf_node_subnet) to allow TCP traffic on all ports from the operator subnet. To add ingress and egress security rules, see the Adding Ingress and Egress Rules to Access the OCI Console section.
- Run the following command from a bash terminal on your local
PC:
ssh -f -N -i <operator instance private key> -o StrictHostKeyChecking=no -o ProxyCommand="ssh -i <bastion private key> -o StrictHostKeyChecking=no -W %h:%p <bastion username>@<bastion IP>" <operator instance username>@<operator instance IP> -L <local PC port>:<Worker Node IP>:<ATS NodePort> -o ServerAliveInterval=60 -o ServerAliveCountMax=300 - Access the GUI using URL:
<http/https>://<localhost/127.0.0.1>:<local PC
                        port>
For example,
ssh -f -N -i id_rsa -o
                            StrictHostKeyChecking=no -o ProxyCommand="ssh -i id_rsa -o
                            StrictHostKeyChecking=no -W %h:%p opc@129.287.66.123" opc@10.1.76.7 -L
                            5009:10.9.60.118:32071 -o ServerAliveInterval=60 -o
                            ServerAliveCountMax=300
Here, ATS GUI URLis http://localhost:5009
2.23.2 Adding Ingress and Egress Rules to Access the OCI Console
Perform the following procedure to add ingress and egress rules:
- Log in to the OCI Console using your login credentials.
- On the OCI Console Dashboard, click Navigation
menu.
Figure 2-77 Navigation menu

- Click Networking, and then click
Virtual cloud networks on the preview pane.
Figure 2-78 Virtual cloud networks

- Click the required OKE cluster VCN.
A list of all subnets in that VCN is displayed.
- Save the value of the "IPv4 CIDR Block" field for
nf_lb_subnet.
This information can be used in the subsequent steps as value of
<CIDR for Load balancer
                            subnet>
. - Save the value of the "IPv4 CIDR Block" field for
nf_node_subnet.
This information can be used in the subsequent steps as value of
<CIDR for Node
                            subnet>
.
Updating Security List for Node Subnet
- To update security list for Node subnet, do the following:
- Navigate to nf_node_subnet, and then to nf_node_security_list.
- Click Add Ingress Rules.
Figure 2-79 Add Ingress Rules
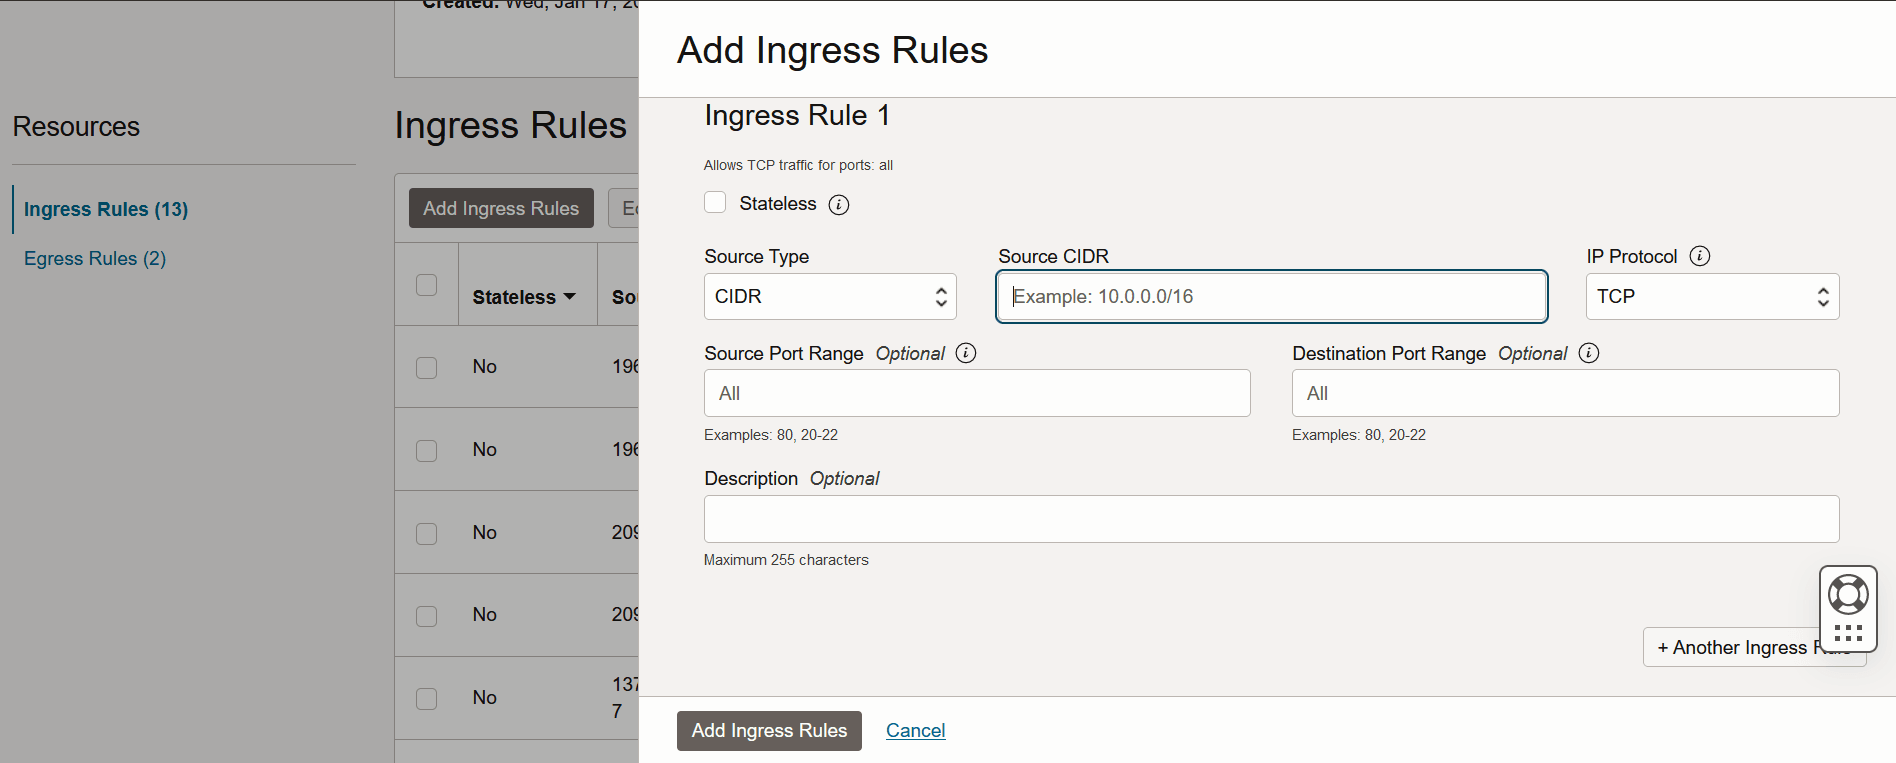
- Add ingress rule if it is unavailable to access the OCI Console
in nf_node_subnet as described in the following
table:
Table 2-10 Adding Ingress Rules for Node Subnet
Option Name Description Source Type Indicates the source type. Value: CIDR
Source CIDR Indicates the source of CIDR. Value: <CIDR for Load balancer subnet>
Note: The value for the variable <CIDR for Node subnet> was determined in a previous step.
IP Protocol Indicates the internet protocol for which this rule is applicable. Value: TCP
Source Port Range Keep this option at its default value. Destination Port Range Keep this option at its default value. Description Keep this option at its default value. Note:
To access ATS API, you can use the above mentioned ingress rule.
Updating Security List for Load Balancer Subnet
- To update security list for Load balancer subnet, do the
following:
- Navigate to nf_lb_subnet, and then to nf_lb_security_list.
- Click Add Ingress Rules.
- Add ingress rule if it is unavailable to access the OCI
Console in nf_lb_subnet by configuring the
options as described in the following table:
Table 2-11 Adding Ingress Rules Load Balancer Subnet
Option Name Description Source Type Indicates the source type. Value: CIDR
Source CIDR Indicates the source of CIDR. Value: <CIDR for Network which will be used to access ATS GUI>
Note: Avoid setting its value to 0.0.0.0/0, as it may result in granting access to ATS GUI from all networks, posing a considerable security risk.
If you intend for ATS GUI to only be accessible within the Corporate Proxy (VPN), using a Source CIDR value of 0.0.0.0/0 would allow access from outside the Corporate Proxy (VPN) as well.
IP Protocol Indicates the internet protocol for which this rule is applicable. Value: TCP
Source Port Range Keep this option at its default value. Destination Port Range Indicates the ATS GUI port number. Port 8080 is used for HTTP and 8443 is used for HTTPS. Value:
<ATS
                                                  service Port>
Description Keep this option at its default value. - To access ATS API, create one more ingress rule if it is
unavailable by following the previous step with the following
changes:
- In the Source CIDR option,
provide the
<CIDR for Network which will be used to
                                        access ATS API>
value. - In the Destination Port Range
option, provide the
<ATS Service API
                                        Port>
value, which refers to the ATS API port, that is, 5001.
- In the Source CIDR option,
provide the
- To add egress rule if it is unavailable to access the OCI Console in
nf_lb_subnet, do the following:
- In the left navigation pane, click Egress Rules.
- Click Add Egress Rules.
- Configure the following options as described in this table:
Table 2-12 Adding Egress Rules Load Balancer Subnet
Option Name Description Destination Type Indicates the destination type. Value: CIDR
Destination CIDR Indicates the destination of CIDR. Value: <CIDR for Node subnet>
Note: The value for the variable <CIDR for Node subnet> was determined in the previous step.
IP Protocol Indicates the internet protocol for which this rule is applicable. Value: TCP
Source Port Range Keep this option at its default value. Destination Port Range Keep this option at its default value. Description Keep this option at its default value. Note:
To access ATS API, you can use the above mentioned egress rule.
Updating Security List for Tunneling
- Log in to the OCI Console using your login credentials.
- On the OCI Console Dashboard, click Navigation
menu.
Figure 2-80 Navigation menu

- Click Networking, and then click Virtual cloud networks on the preview pane.
- Click the required OKE cluster VCN.
A list of all subnets in that VCN is displayed.
- Save the value of the "IPv4 CIDR Block" field for
nf_operator_subnet.
This information can be used in the subsequent steps as value of
<CIDR for
                            Operator subnet>
.
Updating Security list of Node Subnet
- To update security list of Node subnet, do the
following:
- Navigate to nf_node_subnet, and then to nf_node_security_list.
- Click Add Ingress Rules.
- Add ingress rule if it is unavailable to access the OCI
Console in nf_node_subnet by configuring the
options as described in the following table:
Table 2-13 Adding Ingress Rules for Node Subnet Tunneling
Option Name Description Source Type Indicates the source type. Value: CIDR
Source CIDR Indicates the source of CIDR. Value: <CIDR for Operator subnet>
Note: The value for the variable <CIDR for Operator subnet> was determined in the previous step.
IP Protocol Indicates the internet protocol for which this rule is applicable. Value: TCP
Source Port Range Keep this option at its default value. Destination Port Range Keep this option at its default value. Description Keep this option at its default value. Note:
To access ATS API, you can use the above mentioned ingress rule.
2.24 Support for Transport Layer Security
Currently, ATS is accessible through HTTP, which can raise security risks.
With the support of the TLS feature, Jenkins servers have been upgraded to support HTTPS, ensuring a secure and encrypted connection when accessing the ATS dashboard.
To provide encryption, HTTPS uses an encryption protocol known as Transport Layer Security (TLS), which is a widely accepted standard protocol that provides authentication, privacy, and data integrity between two communicating computer applications.
Figure 2-81 Access with TLS
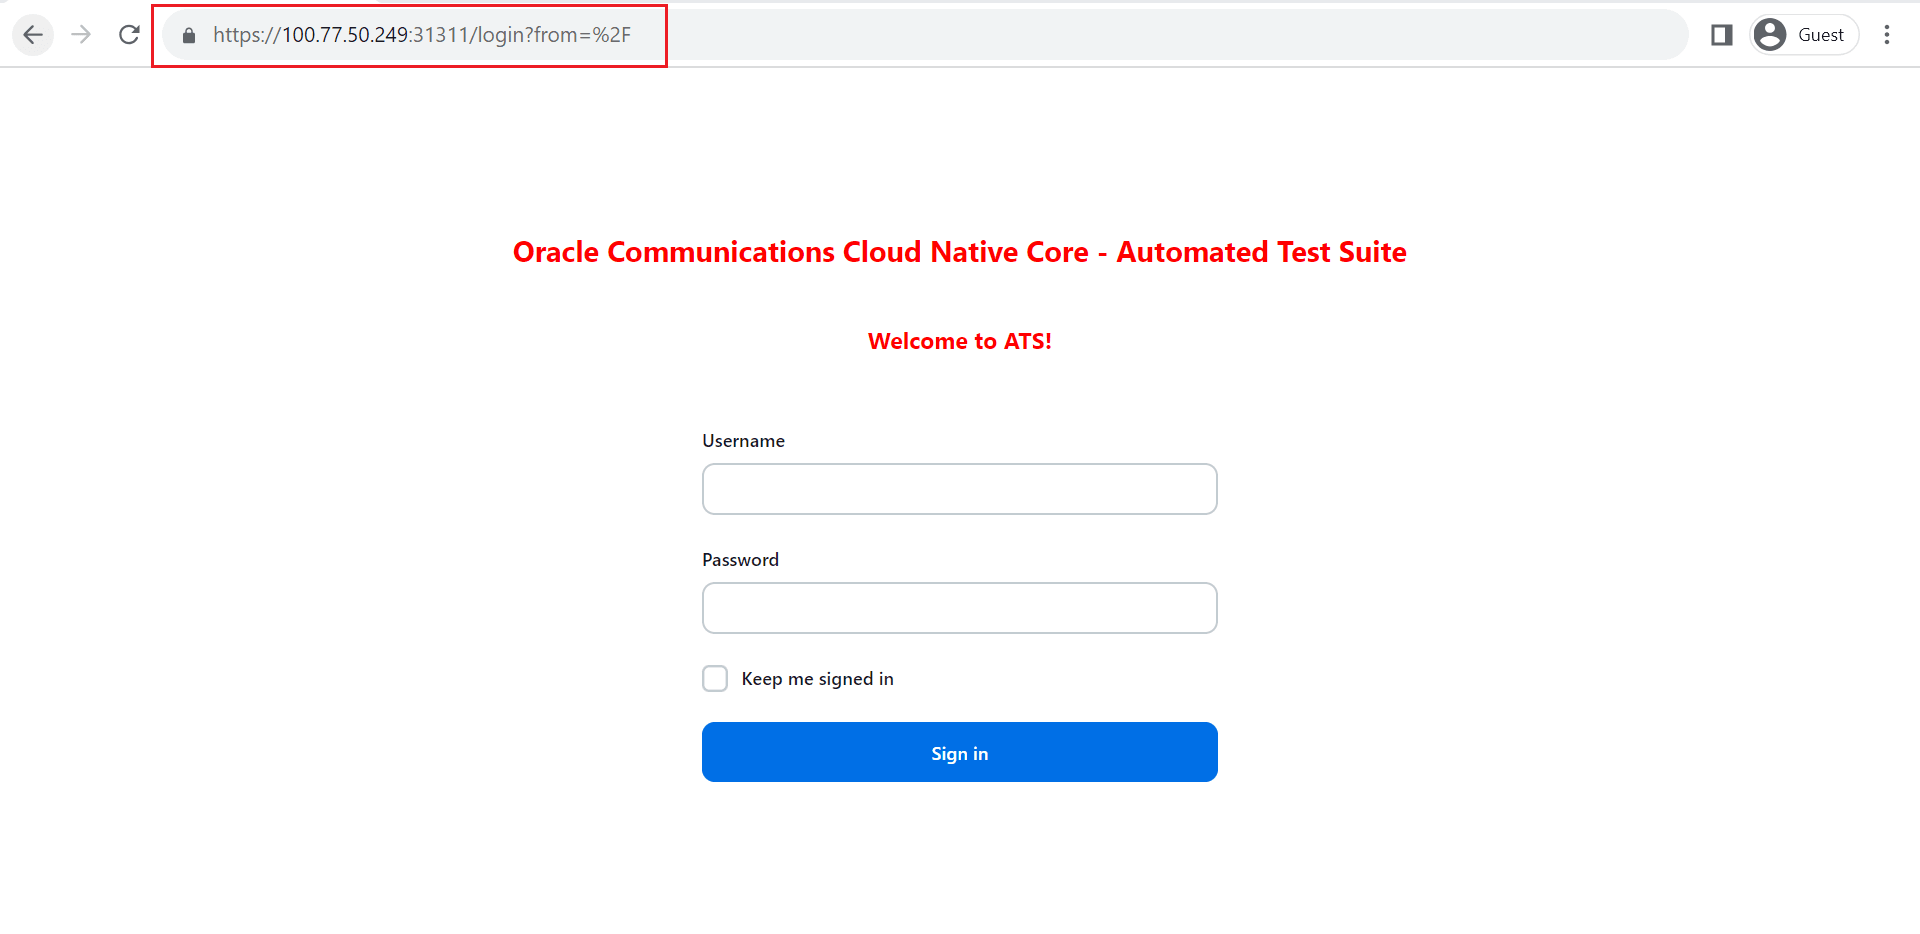
Note:
If this feature is not enabled before installation, HTTP will continue to operate.2.24.1 Deploy ATS with TLS Enabled
Follow the steps in this section to create a Java KeyStore (JKS) file and enable the ATS GUI with HTTPS during installation.
2.24.1.1 Generate JKS File for Jenkins Server
A JKS file needs to be created in order for Jenkins to provide ATS GUI access through HTTPS.
Perform the following steps to generate a JKS file:
Generate the Root Certificate
If a root certificate, for example, caroot.cert, is
not already available, a user can generate one. Users may use their own files if
they have a CA-signed root certificate and key or their own root certificates. The
root certificate is used to sign the application, or ATS certificate.
- Generate a root key with the following
command:
openssl genrsa 2048 > <path_to_root_key>For example,openssl genrsa 2048 > caroot.key - Generate a "caroot" certificate with the
following
command:
openssl req -new -x509 -nodes -days 1000 -key
      <path_to_root_key> > <path_to_root_certificate>
For example,[cloud-user@star23-bastion-1 cert]$ openssl req -new -x509 -nodes -days 1000 -key caroot.key > caroot.cer You are about to be asked to enter information that will be incorporated into your certificate request. What you are about to enter is what is called a Distinguished Name or a DN. There are quite a few fields but you can leave some blank For some fields there will be a default value, If you enter '.', the field will be left blank. ----- Country Name (2 letter code) [XX]:IN State or Province Name (full name) []:KA Locality Name (eg, city) [Default City]:BLR Organization Name (eg, company) [Default Company Ltd]:ORACLE Organizational Unit Name (eg, section) []:CGBU Common Name (eg, your name or your server's hostname) []:ocats Email Address []: [cloud-user@star23-bastion-1 cert]$
Generate Application or Client Certificate
ssl.conf file:
- In the alt_names section, list the IPs,
such as IP.1, IP.2, and so on, that are used to access the ATS
GUI:
[ req ]
default_bits       = 4096
distinguished_name = req_distinguished_name
req_extensions     = req_ext

[ req_distinguished_name ]
countryName                 = Country Name (2 letter code)
countryName_default         = <Country_Name>
stateOrProvinceName         = State or Province Name (full name)
stateOrProvinceName_default = <State_Name>
localityName                = Locality Name (eg, city)
localityName_default        = <Locality_Name>
organizationName            = Organization Name (eg, company)
organizationName_default    = <Org_Name>
commonName                  = Common Name (e.g. server FQDN or YOUR name)
commonName_max              = 64
commonName_default          = <helm_name>.<namespace>.svc.cluster.local

[ req_ext ]
keyUsage = critical, digitalSignature, keyEncipherment
extendedKeyUsage = serverAuth, clientAuth
basicConstraints = critical, CA:FALSE
subjectAltName = critical, @alt_names

[alt_names]
IP.1 = 127.0.0.1
IP.2 = <IP1>
IP.3 = <IP2>
DNS.1 = <helm_name>.<namespace>.svc.cluster.local
For example,[ req ] default_bits = 4096 distinguished_name = req_distinguished_name req_extensions = req_ext [ req_distinguished_name ] countryName = Country Name (2 letter code) countryName_default = <Country_Name> stateOrProvinceName = State or Province Name (full name) stateOrProvinceName_default = <State_Name> localityName = Locality Name (eg, city) localityName_default = <Locality_Name> organizationName = Organization Name (eg, company) organizationName_default = <Org_Name> commonName = Common Name (e.g. server FQDN or YOUR name) commonName_max = 64 commonName_default = ocats.scpsvc.svc.cluster.local [ req_ext ] keyUsage = critical, digitalSignature, keyEncipherment extendedKeyUsage = serverAuth, clientAuth basicConstraints = critical, CA:FALSE subjectAltName = critical, @alt_names [alt_names] IP.1 = 127.0.0.1 IP.2 = 10.75.217.5 IP.3 = 10.75.217.76 DNS.1 = localhost DNS.2 = ocats.scpsvc.svc.cluster.localNote:
- To access the GUI with DNS, make sure that the
commonName_default is the same as the DNS name being used.
- The
/etc/hostsfile in the local system should also be updated with the assigned IP and the DNS mentioned above to open the ATS with DNS. Otherwise, it is not required.
- The
- Ensure the DNS is in this format: <service_name>.<namespace>.svc.cluster.local
- Multiple DNSs, such as DNS.1, DNS.2, and so on, can be added.
- To support the ATS API, add the IP 127.0.0.1 to the list of IPs.
- To access the GUI with DNS, make sure that the
commonName_default is the same as the DNS name being used.
- Create a Certificate Signing Request (CSR) with the following
command:
openssl req -config ssl.conf -newkey rsa:2048 -days 1000 -nodes -keyout <path_to_application_certificate_key> > <path_to_certificate_signing_request>For example,[cloud-user@star23-bastion-1 cert]$ openssl req -config ssl.conf -newkey rsa:2048 -days 1000 -nodes -keyout rsa_private_key_pkcs1.key > ssl_rsa_certificate.csr Ignoring -days; not generating a certificate Generating a RSA private key ...+++++ ........+++++ writing new private key to 'rsa_private_key_pkcs1.key' ----- You are about to be asked to enter information that will be incorporated into your certificate request. What you are about to enter is what is called a Distinguished Name or a DN. There are quite a few fields but you can leave some blank For some fields there will be a default value, If you enter '.', the field will be left blank. ----- Country Name (2 letter code) [IN]: State or Province Name (full name) [KA]: Locality Name (eg, city) [BLR]: Organization Name (eg, company) [ORACLE]: Common Name (e.g. server FQDN or YOUR name) [ocats]: [cloud-user@star23-bastion-1 cert]$ - Use the command to display the components of the file and verify the
configurations:
openssl req -text -noout -verify -in ssl_rsa_certificate.csr - Sign in to this CSR file with the root
certificate:
openssl x509 -extfile ssl.conf -extensions req_ext -req -in <path_to_certificate_signing_request> -days 1000 -CA <path_to_root_certificate> -CAkey <path_to_root_key> -set_serial 04 > <path_to_application_certificate>For example,[cloud-user@star23-bastion-1 cert]$ openssl x509 -extfile ssl.conf -extensions req_ext -req -in ssl_rsa_certificate.csr -days 1000 -CA ../caroot.cer -CAkey ../caroot.key -set_serial 04 > ssl_rsa_certificate.crt Signature ok subject=C = IN, ST = KA, L = BLR, O = ORACLE, CN = ocats Getting CA Private Key [cloud-user@star23-bastion-1 cert]$ - Use the command to verify that the certificate is properly
signed by the root
certificate:
openssl verify -CAfile <path_to_root_certificate>
      <path_to_application_certificate>
For example,[cloud-user@star23-bastion-1 cert]$ openssl verify -CAfile caroot.cer ssl_rsa_certificate.crt ssl_rsa_certificate.crt: OK - Save the generated application certificates and the root certificates.
- Add the
caroot.certo the browser as a trusted author. For more information, see Enable ATS GUI with HTTPS - Generate the
.p12 keystorefile with the following command:openssl pkcs12 -inkey <path_to_application_key> -in <path_to_application_certificate> -export -out <path_to_p12_certificate>For example,
[cloud-user@star23-bastion-1 ocats]$ openssl pkcs12 -inkey rsa_private_key_pkcs1.key -in ssl_rsa_certificate.crt -export -out certificate.p12 Enter Export Password: Verifying - Enter Export Password: - In the prompt, create a password and save it for future use.
- Convert the
.p12 keystorefile into a JKS format file:keytool -importkeystore -srckeystore <path_to_p12_certificate> -srcstoretype pkcs12 -destkeystore <path_to_jks_file> -deststoretype JKSFor example,
[cloud-user@star23-bastion-1 cert]$ keytool -importkeystore -srckeystore ./certificate.p12 -srcstoretype pkcs12 -destkeystore jenkinsserver.jks -deststoretype JKS Importing keystore ./certificate.p12 to jenkinsserver.jks... Enter destination keystore password: Re-enter new password: Enter source keystore password: Entry for alias 1 successfully imported. Import command completed: 1 entries successfully imported, 0 entries failed or cancelled - In the prompt, use the same password used while creating
.p12 keystorefile.Note:
Verify that the passwords linked to the.p12 keystoreand JKS files are the same. - The generated file,
jenkinserver.jks, is provided to the Jenkins server.
2.24.1.2 Enable ATS GUI with HTTPS
- Create a Kubernetes secret by adding the above created
files:
kubectl create secret generic <secret_name> --from-file=<path_to_jks_file> --from-file=<path_to_application_certificate> --from-file=<path_to_application_key> --from-file=<path_to_root_certificate> -n <namespace>For example,
kubectl create secret generic ocats-tls-secret --from-file=jenkinsserver.jks --from-file=ssl_rsa_certificate.crt --from-file=rsa_private_key_pkcs1.key --from-file=caroot.cer -n scpsvcWhere,
jenkinsserver.jks: This file is needed when
atsGuiTLSEnabledis set to true. This is necessary to open ATS GUI with secured TLS protocol.ssl_rsa_certificate.crt: This is client application certificate.
rsa_private_key_pkcs1.key: This is RSA private key.
caroot.cer: This file used during creation of jks file needs to be passed for Jenkins/ATS API communication.
The sample of created secret:[cloud-user@star23-bastion-1 cert]$ kubectl describe secret ocats-tls-secret -n scpsvc Name: ocats-tls-secret Namespace: scpsvc Labels: <none> Annotations: <none> Type: Opaque Data ==== caroot.cer: 1147 bytes ssl_rsa_certificate.crt: 1424 bytes jenkinsserver.jks: 2357 bytes rsa_private_key_pkcs1.key: 1675 bytes - Apply the following changes in
values.yamlfile.
The user can install the ATS, using the helm install command. Change thecertificates: cert_secret_name: "ocats-tls-secret" ca_cert: "caroot.cer" client_cert: "ssl_rsa_certificate.crt" private_key: "rsa_private_key_pkcs1.pem" jks_file: "jenkinsserver.jks" jks_password: "123456" #This is the password given to the jks file while creation.atsGuiTLSEnabledHelm parameter value to true for ATS to get the certificates and support HTTPS for GUI. - A user can now start ATS with HTTPS the protocol.
The link to open the ATS GUI format is
https://<IP>:<port>, for example,https://10.75.217.25:30301The lock symbol in the browser indicates that the server is secured or TLS enabled.
Adding a Certificate in Browser
Note:
Future versions of these browsers may involve different menu options. For more information on importing root certificate, see the browser documentation to add a self-signed certificate to the browser as a trusted certificate.- In the Chrome browser, navigate to the settings and search for security.
- Click the security option that appears next to search.
- Click the Manage Device Certificate option. The Certificate window opens.
- Click the Trusted root certification authorities bar.
- Import the
carootcertificate. - Save and restart the browser.
Adding in Mac laptop
- In the Chrome browser, navigate to the settings and search for security.
- Click the security option that appears next to search.
- Click the Manage Device Certificate option. The Keychain Access window opens.
- Search the tab certificate and drag and drop the downloaded caroot certificate.
- Find the uploaded certificate in the list, usually listed by a temporary name.
- Double click the certificate and expand the Trust option.
- In When using this certificate option, assign it to "always trust".
- Close the window and validate if it asks for the password.
- Save and restart the browser.
Adding for Windows and Mac laptop
- In the Mozilla Firefox browser, navigate to the settings and search for certificates.
- Click the View Certificate that appears next to search. This opens a Certificate Manager window.
- Navigate to the Authorities section, click the
Import button, and upload the
carootcertificate. - Click the Trust options in the pop-up window and click OK.
- Save and restart the browser.
2.25 Test Results Analyzer
The Test Results Analyzer is a plugin available in ATS to view pipeline test results based on XML reports. It provides the test results report in a graphical format, which includes consolidated and detailed stack trace results in case of any failures. It allows you to navigate to each and every test.
- PASSED: If the test case passes.
- FAILED: If the test case fails.
- SKIPPED: If the test case is skipped.
- N/A: If the test cases are not executed in the current build.
2.25.1 Accessing Test Results Analyzer Feature
- From the NF home page, click any new feature pipeline or regression pipeline where you want to run this plugin.
- In the left navigation pane, click Test Results
Analyzer.
When the build completes, the test result report appears. A sample test result report is shown below:
Figure 2-82 Test Results Analyzer Option

Figure 2-83 Sample Test Result Report

- Click any one of the statuses (PASSED, FAILED, SKIPPED) to view the
respective feature detail status report.
Note:
For N/A status, a detailed status report is not available.Figure 2-84 Test Result

Figure 2-85 Test Result

- In the case of a rerun, the test cases that passed in the initial
run but were skipped in the rerun are considered "passed" in the Test Results
Analyzer Report. The following screenshot depicts the scenario:
"Variant2_equal_smPolicySnssaiData,Variant2_exist_smPolicyData,Variant2_exist_smPolicyDnnData_dnn"
where the test cases passed in the initial run but skipped in the rerun are
considered "passed" in general.
Figure 2-86 Test Results
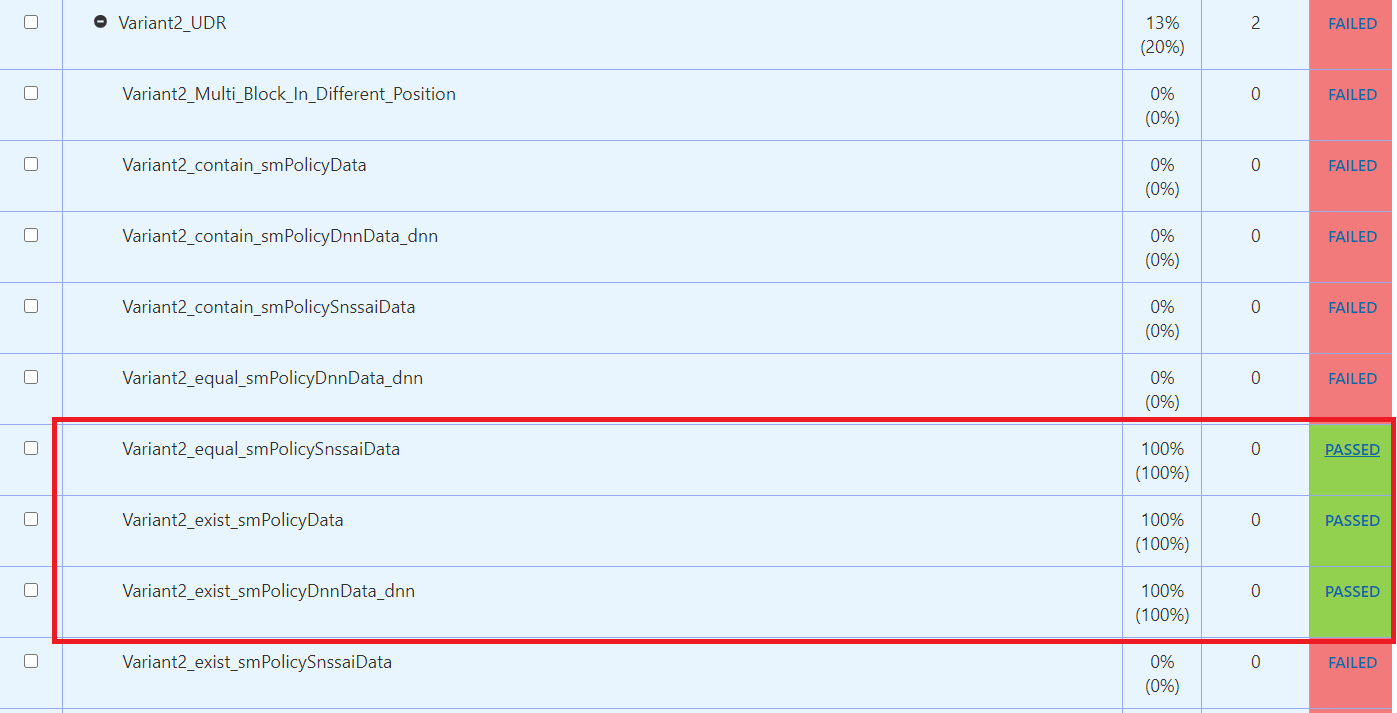
- Click PASSED. The following highlighted
message means the test case was passed in the main run but skipped in the
rerun.
Figure 2-87 Test Result Info
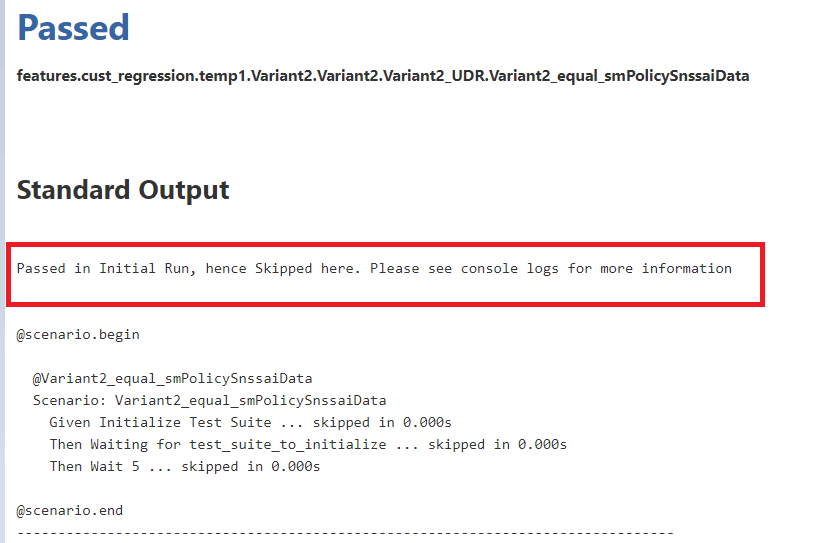
2.26 Support for Test Case Mapping and Count
The Test Case Mapping and Count feature displays the total number of features, test cases, or scenarios and their mapping to each feature in the ATS GUI.
2.26.1 Access Test Case Mapping and Count Feature
- On the NF home page, click any new feature or regression pipeline where you want to use this feature.
- In the left navigation pane, click Build with Parameters.
- On the FEATURE AND TESTCASES section, click
All from the Features drop-down menu to view the
TestCases details mapped to each feature.
Figure 2-88 Test Case Mapping

- Click Select from the
Features drop-down menu to view the the test cases
details.
Figure 2-89 Test Cases Details When Select a Single/MultipleFeatures
