Actions on the Edge Node Applications Tab
You can click the more dots in the Actions column for each application running on an Cloud Connector to perform application-level actions, generate logs, update the configuration, and view statistics in the Application Statistics drawer. For Host Services, you can view CPU and memory usage statistics.
You can start an application, update an application configuration, retrieve log files from the application, and view statistics about the application. Host Services support View Statistics but do not support the other application actions.
Get Application Logs
For applications that support log retrieval, Get Application Logs opens the Get Application Logs drawer for the selected application.
The drawer provides the following inputs:
| Field | Description |
|---|---|
| Start Time | Specifies when the log collection period begins. |
| Duration | Specifies the duration of the log collection period. The end time is calculated automatically from the start time and duration. |
The Results section displays previously retrieved Application Logs with the following information:
- File Name
- Duration
- Creation Date
- Expiration Date
- Size
- Download
Note:
Application Logs are retained for 30 days. Results older than 30 days expire and are no longer available for download.Note:
Get Application Logs is not available for Host Services.For instructions on retrieving and downloading Application Logs, see Get Application Logs.
View Cloud Connector Application Statistics
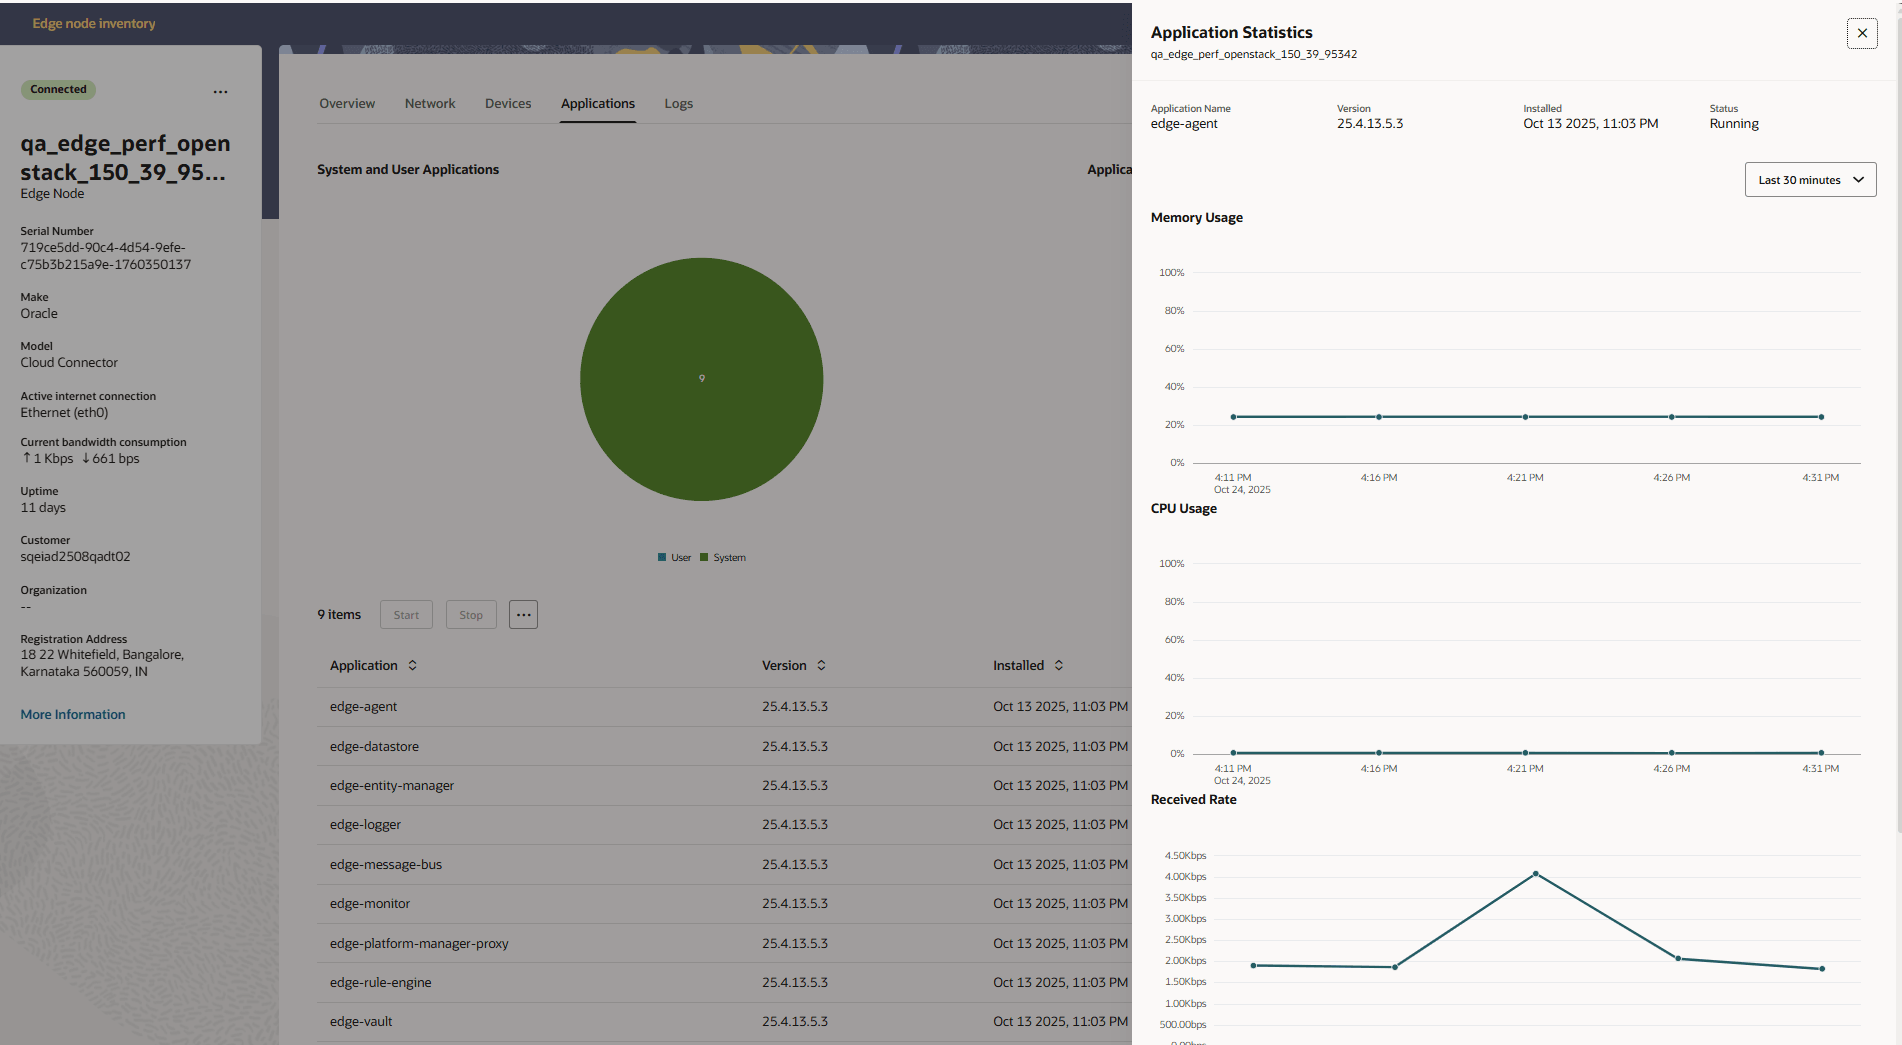
- Memory Usage—Percent over time
- CPU Usage—Percent over time
- Received Rate
- Transmitted Rate
- Last 30 Minutes (default)
- Last 1 Hour
- Last 24 Hours
- Last 7 Days
- Last 30 Days
Host Service Actions and Statistics
Host Services are ECP-managed processes running on the Edge hardware. For a Host Service, View Statistics is the available application action.
- Start
- Stop
- Update Configuration
- Get Application Logs
- Memory Usage
- CPU Usage
- Last 1 Hour
- Last 24 Hours
- Last 7 Days
- Last 30 Days
Received Rate and Transmitted Rate are not displayed for Host Services.
Note:
Host Service statistics are available for Edge Nodes running release 26.3 or later. For earlier releases, View Statistics is not available for Host Services.For instructions on viewing Host Service statistics, see View Host Service Statistics.