Sessions Report
The Sessions Report is a SIP session summary of all logged call sessions on the Oracle® Enterprise Session Border Controller (E-SBC). When Lightweight Directory Access Protocol (LDAP) is enabled on the Active Directory, LDAP session messages may also display.
The columns that display on the Sessions Report page depend on the columns that you specified in the "Customizing the Page Display" procedure.
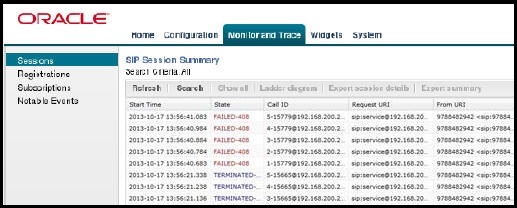
The following table describes the columns on the SIP Session Summary page.
| Start Time | Timestamp of the first SIP message in the call session. |
| State | Status of the call or media session. Valid values
are:
INITIAL—Session for which an INVITE or SUBSCRIBE was forwarded. EARLY—Session that received the first provisional response (1xx other than 100). ESTABLISHED—Session for which a success (2xx) response was received. TERMINATED—Session that ended by receiving or sending a BYE for an “Established” session or forwarding an error response for an “Initial” or "Early" session. The session remains in the terminated state until all the resources for the session are freed up. FAILED—Session that failed due to a 4xx or 5xx error code. |
| Call ID | Identification of the call source. Includes the phone number and source IP address. |
| Request URI | Uniform Resource Identifier (URI) formatted string that identifies a resource by way of a protocol, name, location, and any other applicable characteristic that is sent by the E-SBC in REQUEST headers. |
| From URI | URI formatted string that identifies the call source information. |
| To URI | URI formatted string that identifies the call destination information. |
| Duration | Amount of time, in seconds, that the call or media event was active. |
| Notable Event | Indicates if a notable event has occurred on the
call session. Valid values are:
short session—Sessions that do not meet a minimum configurable duration threshold. Session dialogue, captured media information, and termination signalling. Any event flagged as a short session interesting event. local rejection—Sessions locally rejected at the E-SBC for any reason, for example, Session Agent (SA) unavailable, no route found, SIP signalling error, and so on. Session dialogue, capture media information, and termination signalling. Any event flagged as a local rejection interesting event. |
| Session ID | Identification assigned to the call session. |
| Ingress Src Addr | Source IP address of the incoming call or media event. |
| Egress Dest Addr | Destination IP address of the outgoing call or media event. |
The following table describes the controls on the SIP Session Summary page.
| Search | Use to specify parameters for performing a search for specific session summary records within the current report. |
| Show all | Use to display all of the session summary records in the Sessions Report. |
| Ladder Diagram | Use to display a Ladder Diagram of a specific record in the table. The Ladder Diagram displays detailed information about a call session or media event. |
| Export Session Details | Use to export the SIP messages and media events associated with the selected session to a file in text format on the local machine. |
| Export Summary | Use to export all logged session summary records to a file in text format on the local machine. |
Ladder Diagram
A ladder diagram is a graphical representation in the Web GUI that shows the call and media flow of packets on ingress and egress routes by way of the Oracle® Enterprise Session Border Controller (E-SBC).
A ladder diagram for the Sessions Report displays the following session summary information, which may be useful for troubleshooting:
- Quality of Service (QoS) statistics for call sessions
- SIP messages and media events in time sequence
To display a ladder diagram for a specific record in the Sessions Report, click a record in the summary table or click Ladder diagram on the SIP Sessions Summary page.
The following illustration is an example of an E-SBC ladder diagram.
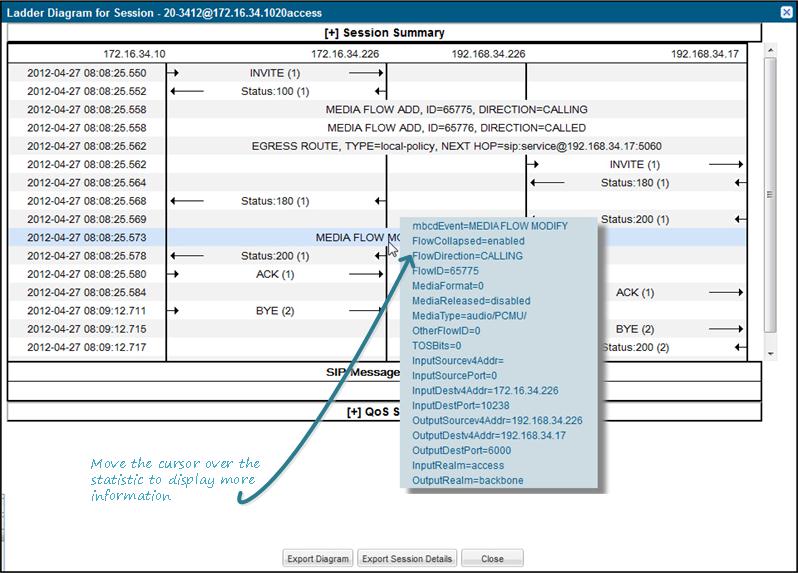
When you hover the mouse over any statistic in the Ladder Diagram, the system displays additional parameters and associated values.
- Session Summary—Summary information.
- SIP Message Details—SIP message and call flow information.
- QoS Statistics—Quality of Service (QoS) statistic information.
| Exports all of the information in the Ladder Diagram (Session Summary, SIP Message Details, and QoS Statistics) to a file in text format on the local machine. | |
| Exports detailed information about the SIP messages and media events associated with the session in focus to a file in text format on the local machine. | |
| Closes the Ladder Diagram page. |
Note:
The E-SBC captures SIP messages, applies the Header Manipulation Rules (HMR) configured on the E-SBC, and applies the Session Plug-in Language (SPL) to that message. When the message is sent from the E-SBC, it applies the SPL, the HMR, and sends the captured SIP message. When viewing the session detail on a Ladder Diagram, the HMR and SPL information may be present.Display a Ladder Diagram
You can display a ladder diagram of call and media flow from the SIP Session Summary page in the Web GUI.
- From the Web GUI, click Monitor and Trace, Sessions.
- On the SIP Session
Summary page, do one of the following:
- Click Ladder Diagram.
- Click a record in the table.
Session Summary
From a ladder diagram, you can launch a summary of a selected call or media session.
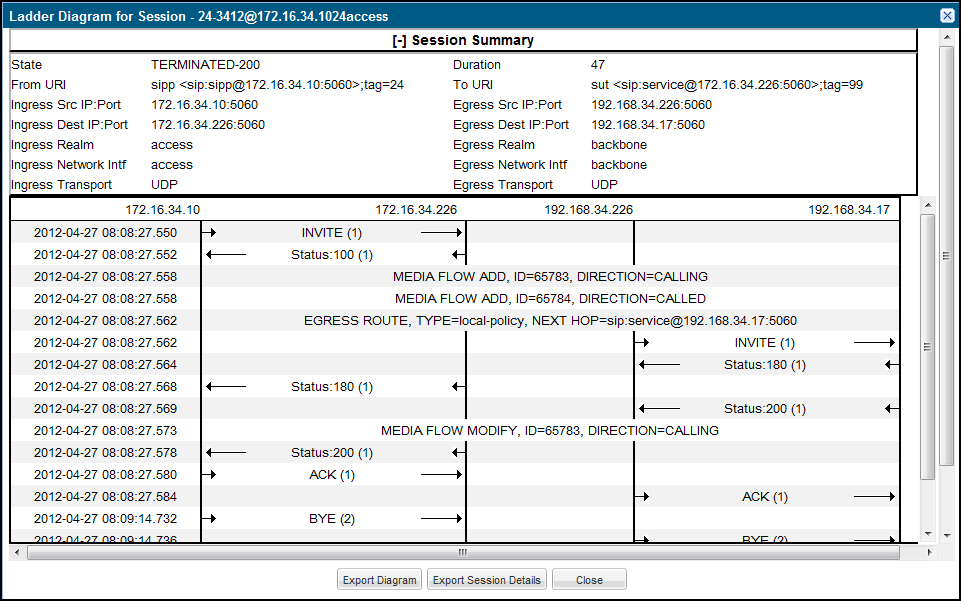
| State | Status of the call or media session. Valid values
are:
INITIAL Session for which an INVITE or SUBSCRIBE was forwarded. EARLY Session received the first provisional response (1xx other than 100). ESTABLISHED Session for which a success (2xx) response was received. TERMINATED Session that has ended by receiving or sending a BYE for an “Established” session or forwarding an error response for an “Initial” or Early session. The session remains in the terminated state until all the resources for the session are freed up. FAILED Session that has failed due to a 4xx or 5xx error code. |
| Duration | Amount of time, in seconds, that the call or media session was active. |
| From URI | URI formatted string that identifies the call source information. |
| To URI | URI formatted string that identifies the call destination information. |
| Ingress Src IP:Port | Source IP address and port number of the incoming call or media session. |
| Egress Src IP: Port | Source IP address and port number of the outgoing call or media session. |
| Ingress Dest IP:Port | Destination IP address and port number of the incoming call or media session. |
| Egress Dest IP: Port | Destination IP address and port number of the outgoing call or media session. |
| Ingress Realm | Incoming realm name. |
| Egress Realm | Outgoing realm name. |
| Ingress Network Intf | Name of the incoming network interface on the Oracle® Enterprise Session Border Controller (E-SBC). |
| Egress Network Intf | Name of the outgoing network interface on the E-SBC. |
| Ingress Transport | Protocol type used on the incoming call or media session. Valid values are User Datagram Protocol (UDP) or Transport Control Protocol (TCP). |
| Egress Transport | Protocol type used on the outgoing call or media session. Valid values are User Datagram Protocol (UDP) or Transport Control Protocol (TCP). |
Display a Session Summary
You can view the details of a call or media session by displaying the session summary from a selected record on a ladder diagram.
SIP Message Details
The SIP Message Detail window displays detailed information and data flow (ingress and egress) about the call or media event.
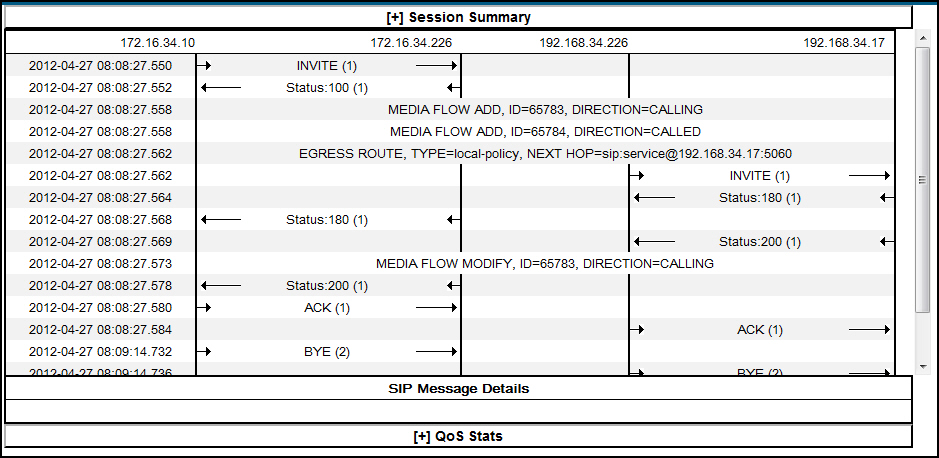
When a session is routed using the a Lightweight Directory Access Protocol (LDAP) configuration (Active Directory) for the local policy, the LDAP information displays in the Session Summary window. The next hop value containing "enum:…" or "dns:…" displays. Similarly, the next hop value "ldap:…" displays for LDAP queries.
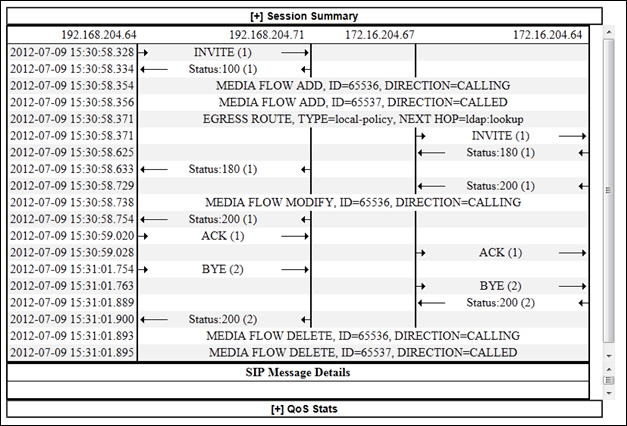
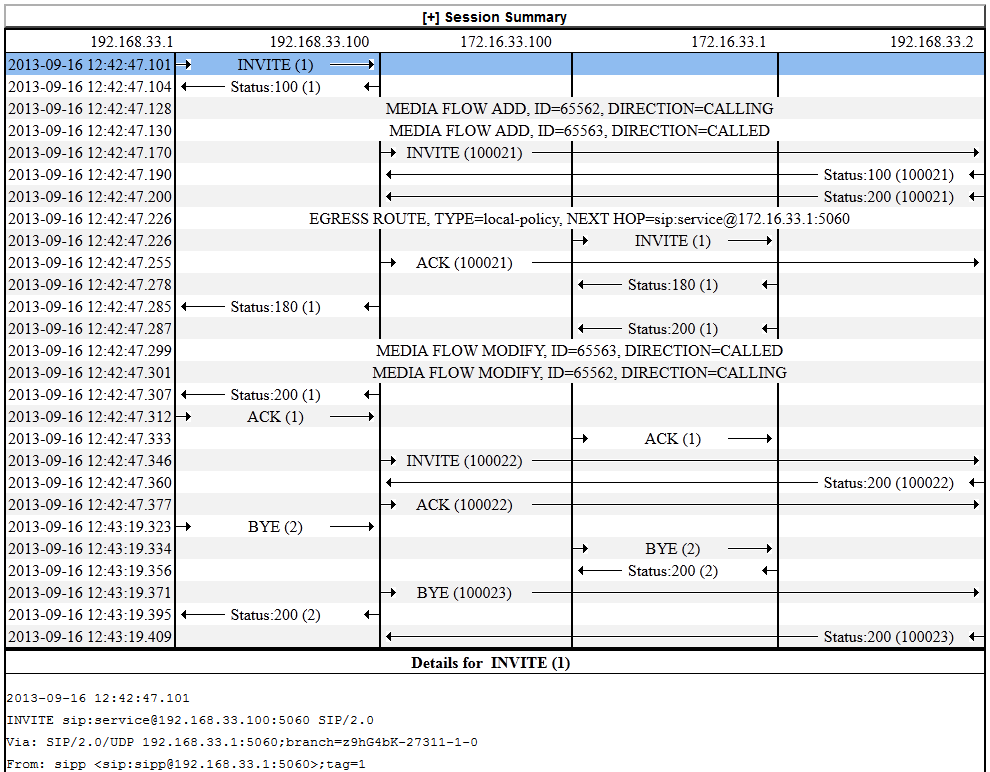
SIPREC Call Data
The following diagram shows SIP Monitor and Trace output for a call with media forwarded by way of SIPREC.
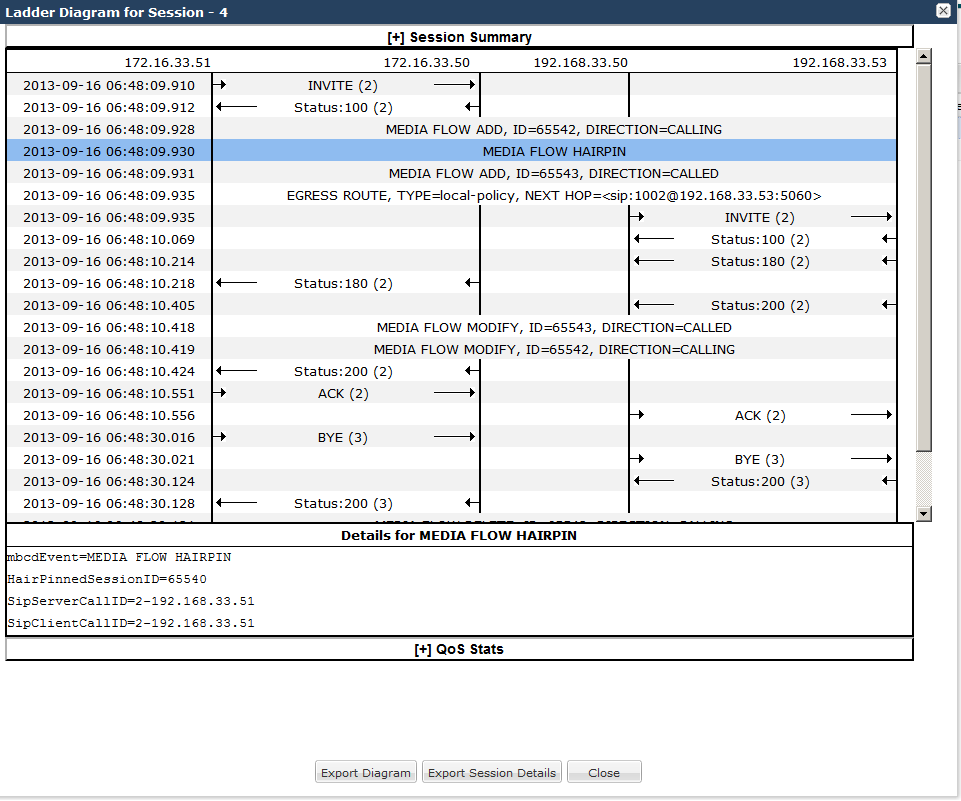
Hairpin Call Data
The following diagram shows SIP Monitor and Trace output for a hairpin call. Note the Media Flow Hairpin indication within the display.
SIP Monitor and Trace Ingress Egress Messages
The SIP Monitor and Trace feature allows the Oracle® Enterprise Session Border Controller (E-SBC) to monitor SIP sessions in your network. The system processes SIP Monitor and Trace data on incoming messages first and then sends the data out on outgoing messages. This allows the E-SBC to capture SIP Monitor and Trace data over the wire for display in the Web GUI.
The E-SBC captures a SIP message, applies the Header Manipulation Rules (HMR) configured on the E-SBC, and applies the Session Plug-in Language (SPL) to that message. When the message is sent out from the E-SBC, the E-SBC applies the SPL, applies the HMR, and sends out the captured SIP message.

Display SIP Message Details
Display the SIP Message Details window to view the messages and status codes that occurred during the active call session or media event. You can use the information to troubleshoot calls and media events that were unsuccessful or timed out while trying to connect.
QoS Statistics
The Quality of Service (QoS) Stats section of the Session Summary displays information about the quality of the service for a selected call session or media event.
Expand QoS Stats section with the [+} control.
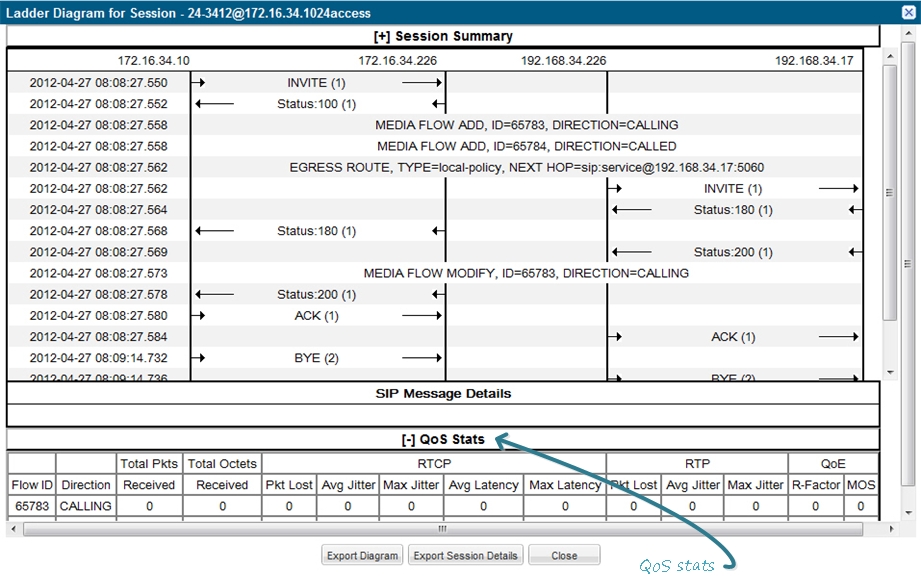
The following table describes each column in the QoS Stats report.
| Flow ID | ID number assigned to the call session or media event flow of data. |
| Direction | The direction of the call or media event flow.
CALLING—egress direction CALLED—ingress direction |
| Total Pkts Received | Total number of data packets received on the interface during the active call session or media event. |
| Total Octets Received | Total number of octets received on the interface during the active call session or media event. |
| RTCP | Real-time Transport Control Protocol—used to send control packets to participants in a call. |
| Pkts Lost | Number of RTCP data packets lost on the interface during the active call session or media event. |
| Avg Jitter | Average measure of the variability, called jitter, over time of the RTCP packet latency across a network. A network with constant latency has no jitter. Jitter is referred to as Packet Delay Variation (PDV). It is the difference in the one-way end-to-end delay values for packets of a flow. Jitter is measured in terms of a time deviation from the nominal packet inter-arrival times for successive packets. |
| Max Jitter | Maximum measure of the variability, called jitter, over time of the RTCP packet latency across a network. A network with constant latency has no variation jitter. |
| Avg Latency | Average observed one-way signaling latency during the active window period. This is the average amount of time the signaling travels in one direction. |
| Max Latency | Maximum observed one-way signaling latency during the sliding window period. This is the maximum amount of time the signaling travels in one direction. |
| RTP | Real-Time Transport Protocol—a standard packet format for delivering audio and video over the internet. |
| Pkts Lost | Number of RTP data packets lost on the interface during the active call session or media event. |
| Avg Jitter | Average measure of the variability, called jitter, over time of the RTP packet latency across a network. A network with constant latency has no jitter. Jitter is referred to as Packet Delay Variation (PDV). It is the difference in the one-way end-to-end delay values for packets of a flow. Jitter is measured in terms of a time deviation from the nominal packet inter-arrival times for successive packets. |
| Max Jitter | Maximum measure of the variability, called jitter, over the time of the RTP packet latency across a network. A network with constant latency has no jitter. |
| QoE | Quality of Experience—measurement used to determine how well the network is satisfying the end user's requirements. |
| R-Factor | Rating Factor—An average Quality of Service (QoS) factor observed during the active window period. QoS shapes traffic to provide different priority and level of performance to different data flows. R-Factors are metrics in VoIP that use a formula to take into account both user perceptions and the cumulative effect of equipment impairments to arrive at a numeric expression of voice quality. This statistic defines the call or transmission quality, which is expressed as an R factor. |
| MOS | Mean Opinion Score (MOS) score—MOS is a measure of voice quality. MOS provides a numerical indication of the perceived quality of the media received after being transmitted and eventually compressed using Codecs. |