8 The Widgets Tab Display and Operations
The Web GUI displays the Widgets tab, which you can use to access graphical views of System, Media, and Signaling data about the Oracle® Enterprise Session Border Controller and a few configuration dialogs. The views, called Widgets, correspond to an Acme Command Line Interface (ACLI) show command.
On the Widgets tab, you can click links to the Widgets you want to see and add Widgets to the Dashboard and Favorites list.
Topics:
Widget Access and Behavior
In the navigation pane, the Widgets tab displays links to the Media, Security, Signaling, and System groups along with a link to your self-created Favorites list.
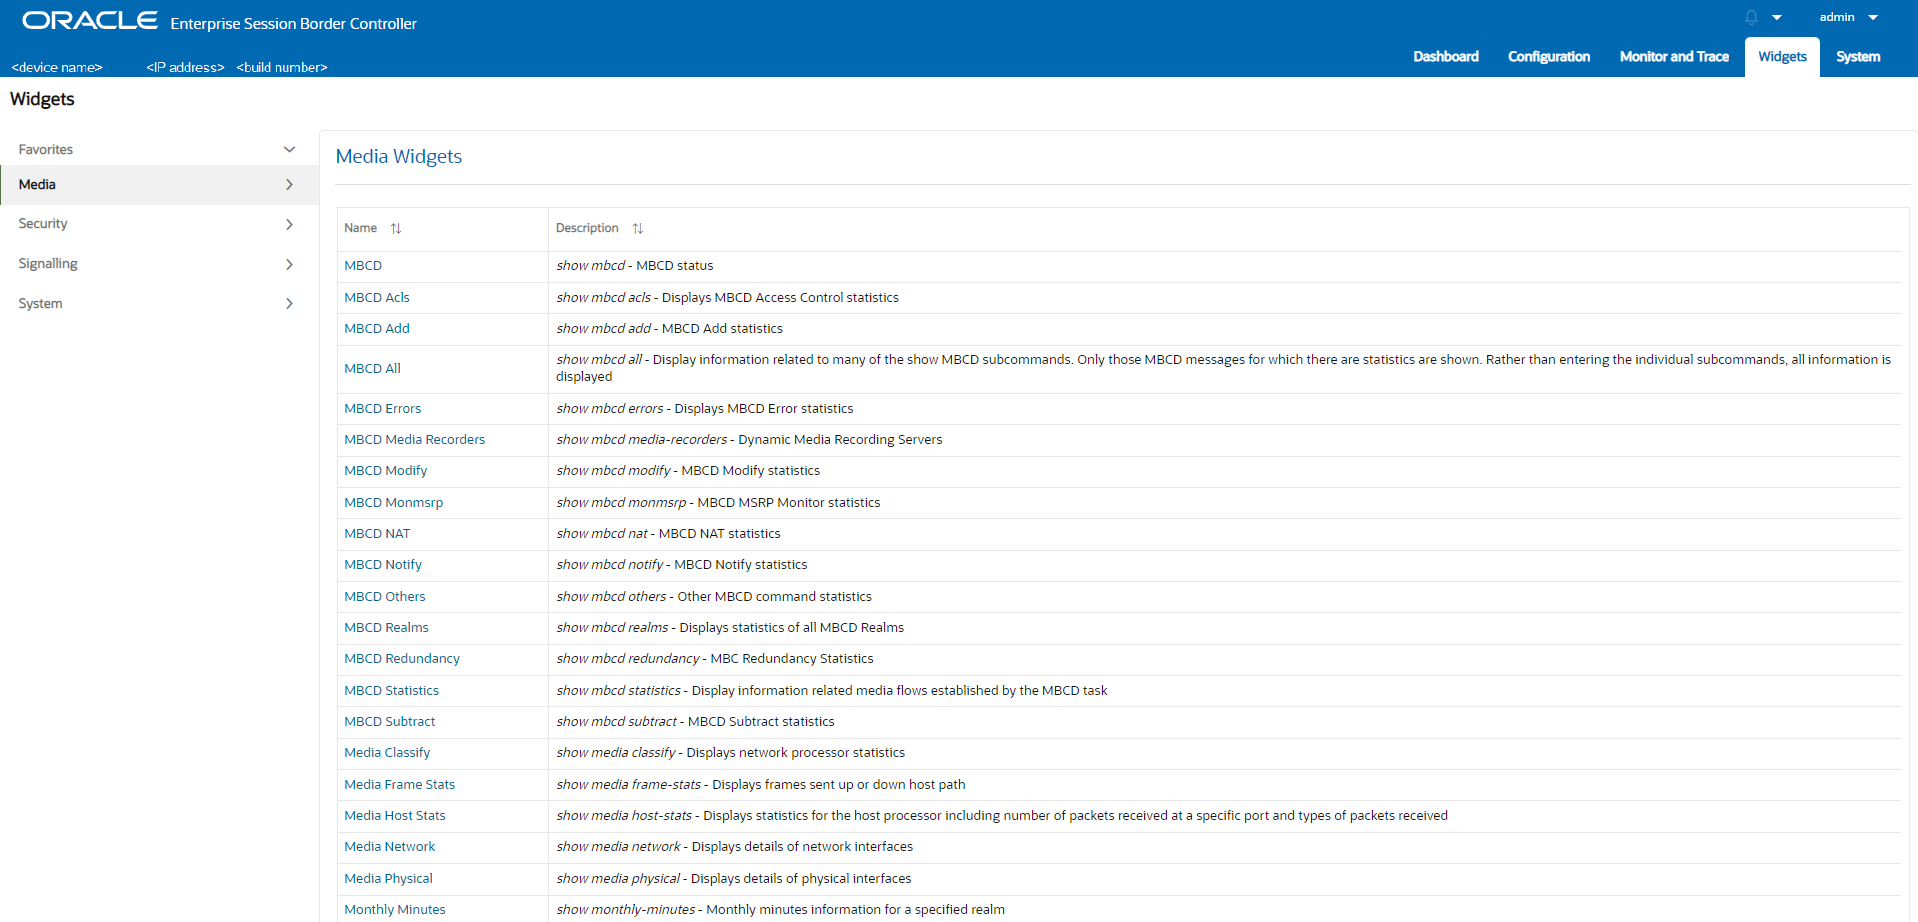
- Click a group link in the navigation pane. The Web GUI lists all the Widgets in
the group in the center pane with a link to each one, the corresponding ACLI
show command, and a description. Scroll to see them all. When you click a link
in the center pane, the Web GUI displays the data for the specified Widget. The
following screen capture shows an example.

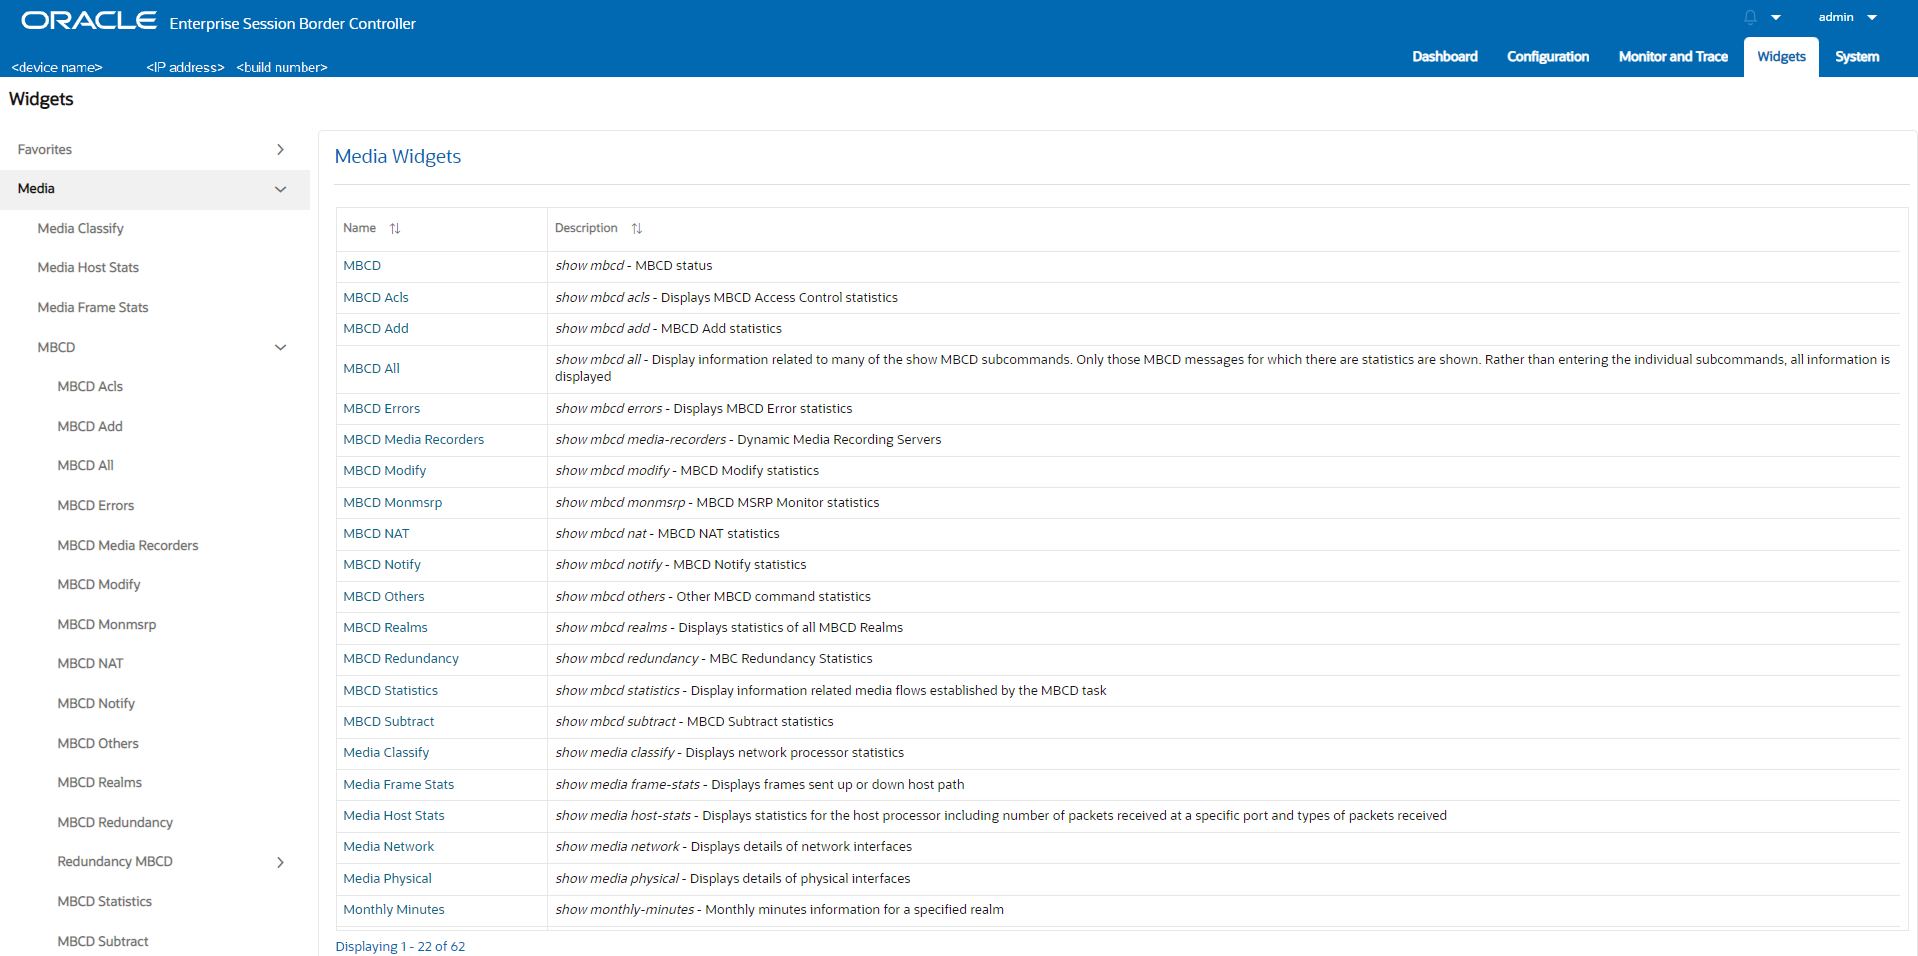
- Click the twister to the right of the group name in the navigation pane. The Web
GUI lists all the Widgets in the group beneath the group name in the navigation
pane, with a link to each one. Scroll to see them all. When you click a link in
the navigation pane, the Web GUI displays the data for the specified Widget. The
following screen capture shows the Media group expanded.
Note:
The Web GUI also displays all the Widgets for the group in the center pane.
Each Widget displays management controls in the upper right corner of the Widget. The Web GUI displays only the controls that apply to the selected Widget.

To learn what each control does, hover over the control. The following list describes the Widget controls.
- Refresh—Updates the data in the Widget.
- Settings—Displays the Settings Page where you set the auto-refresh interval and any other parameters that apply to the particular Widget.
- Export—Sends the data to the location you specify.
- Add—Adds this Widget to the Dashboard.
- Favorites—Adds this Widget to your Favorites list on the Widgets tab.
- Show Information—Describes the data display. For example, in the Current Memory Usage Widget, the information icon says, "Pie graph displays current percentage of free and allocated memory."