2 ATS Framework Features
This chapter describes the ATS Framework features:
Table 2-1 ATS Framework Features Compliance Matrix
| Features | NWDAF | OCNADD |
|---|---|---|
| Application Log Collection | Yes | No |
| ATS API | No | No |
| ATS Health Check | No | No |
| ATS Jenkins Job Queue | Yes | Yes |
| ATS Maintenance Scripts | Yes | Yes |
| ATS System Name and Version Display on Jenkins GUI | Yes | Yes |
| ATS Tagging Support | No | No |
| Custom Folder Implementation | Yes | No |
| Single Click Job Creation | Yes | Yes |
| Final Summary Report, Build Color, and Application Log | Yes | Partially compliant (Application Log is not supported.) |
| Lightweight Performance | Yes | No |
| Modifying Login Password | No | Yes |
| Parallel Test Execution | No | No |
| Parameterization | Yes | No |
| PCAP Log Collection | No | No |
| Persistent Volume | No | Optional |
| Test Result Analyzer | Yes | Yes |
| Test Case mapping and Count | Yes | No |
2.1 Application Log Collection
Using Application Log Collection, you can debug a failed test case by collecting the application logs for NF System Under Test (SUT). Application logs are collected for the duration that the failed test case was run.
Application Log Collection can be implemented by using ElasticSearch or Kubernetes Logs. In both these implementations, logs are collected per scenario for the failed scenarios.
Application Log Collection Using ElasticSearch
- Log in to ATS using respective <NF> login credentials.
- On the NF home page, click any new feature or regression pipeline, from where you want to collect the logs.
- In the left navigation pane, click Build with Parameters.
- Select YES or NO from the drop-down menu of Fetch_Log_Upon_Failure to select whether the log collection is required for a particular run.
- If option Log_Type is also available,
select value AppLog for it.
Figure 2-1 Log Levels
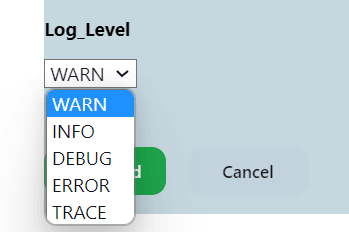
- Select the Log Level from the drop-down menu of Log_Level to set the log
level for all the microservices. The possible values for Log_Level are as
follows:
- WARN: Designates potentially harmful situations.
- INFO: Designates informational messages that highlight the progress of the application at coarse-grained level.
- DEBUG: Designates fine-grained informational events that are most useful to debug an application.
- ERROR: Designates error events that might still allow the application to continue running.
- TRACE: The TRACE log level captures all the details
about the behavior of the application. It is mostly diagnostic and
is more granular and finer than DEBUG log level.
Note:
Log_Level values are NF dependent.
- After the build execution is complete, go into the ATS pod,
then navigate to following path to find the
applogs:
.jenkins/jobs/<Pipeline Name>/builds/<build
                            number>/
For example,
.jenkins/jobs/SCP-Regression/builds/5/Applogs is present in zip form. Unzip it to get the log files.
The following tasks are carried out in the background to collect logs:
- ElasticSearch API is used to access and fetch logs.
- Logs are fetched from ElasticSearch for the failed scenarios
- Hooks (after scenario) within the cleanup file initiate an API call to Elasticsearch to fetch Application logs.
- Duration of the failed scenario is calculated based on the time stamp and passed as a parameter to fetch the logs from ElasticSearch.
- Filtered query is used to fetch the records based on Pod name, Service name, and timestamp (Failed Scenario Duration).
- For ElasticSearch, there is no rollover or rotation of logs over time.
- The maximum records that the ElasticSearch API can fetch per microservice in a failed scenario is limited to 10K.
- The following configuration parameters are used for collecting logs using
Elastic Search:
- ELK_WAIT_TIME: Wait time to connect to Elastic Search
- ELK_HOST: Elastic Search HostName
- ELK_PORT: Elastic Search Port
Application Log Collection Using Kubernetes Logs
- On the NF home page, click any new feature or regression pipeline, from where you want to collect the logs.
- In the left navigation pane, click Build with Parameters.
- Select YES or NO from the drop-down menu of Fetch_Log_Upon_Failure to select whether the log collection is required for a particular run.
- Select the Log Level from the drop-down menu of Log_Level to
set the log level for all the microservices. The possible values for
Log_Level are as follows:
- WARN: Designates potentially harmful situations.
- INFO: Designates informational messages that highlight the progress of the application at coarse-grained level.
- DEBUG: Designates fine-grained informational events that are most useful to debug an application.
- ERROR: Designates error events that might still allow
the application to continue running.
Note:
Log_Level values are NF dependent.
The following tasks are carried out in the background to collect logs:
- Kube API is used to access and fetch logs.
- For failed scenarios, logs are directly fetched from microservices.
- Hooks (after scenario) within the cleanup file initiate an API call to Elasticsearch to fetch Application logs.
- The duration of the failed scenario is calculated based on the time stamp and passed as a parameter to fetch the logs from microservices.
- Logs roll can occur while fetching the logs for a failed scenario. The maximum loss of logs is confined to a single scenario.
2.2 ATS API
- Start: To initiate one of the three test suites, such as Regression, New Features, or Performance.
- Monitor: To obtain the progress of a test suite's execution.
- Stop: To cancel an active test suite.
- Get Artifacts: To retrieve the JUNIT format XML test result files for a completed test suite.
For more information about configuring the tasks, see unresolvable-reference.html#GUID-0E084929-4ACD-4D05-9646-575DB5676FC6.
2.3 ATS Health Check
ATS Health Check functionality is to check the health of the System Under Test (SUT)
Earlier, ATS used Helm test functionality to check the health of the System Under Test (SUT). With the implementation of the ATS Health Check pipeline, the SUT health check process has been automated. ATS health checks can be performed on webscale and non-webscale environments.
Deploying ATS Health Check in a Webscale Environment- Set the Webscale to 'true' and the following parameters by encoding them with base64 in the ATS values.yaml file:
- Set the following parameter to encrypted
data:
webscalejumpserverip: encrypted-data
webscalejumpserverusername: encrypted-data
webscalejumpserverpassword: encrypted-data
webscaleprojectname: encrypted-data
webscalelabserverFQDN: encrypted-data
webscalelabserverport: encrypted-data
webscalelabserverusername: encrypted-data
webscalelabserverpassword: encrypted-data
Encrypted data is the value of parameters encrypted in base64. Fundamentally, Base64 is used to encode the parameters.
For example:
webscalejumpserverip=$(echo -n '10.75.217.42' | base64), Where Webscale Jump server ip needs to be provided
webscalejumpserverusername=$(echo -n 'cloud-user' | base64), Where Webscale Jump server Username needs to be provided
webscalejumpserverpassword=$(echo -n '****' | base64), Where Webscale Jump server Password needs to be provided
webscaleprojectname=$(echo -n '****' | base64), Where Webscale Project Name needs to be provided
webscalelabserverFQDN=$(echo -n '****' | base64), Where Webscale Lab Server FQDN needs to be provided
webscalelabserverport=$(echo -n '****' | base64), Where Webscale Lab Server Portneeds to be provided
webscalelabserverusername=$(echo -n '****' | base64), Where Webscale Lab Server Username needs to be provided
webscalelabserverpassword=$(echo -n '****' | base64), Where Webscale Lab Server Password needs to be provided
Running ATS Health Check Pipeline in a Webscale Environment
- Log in to ATS using respective <NF> login credentials.
- Click <NF>HealthCheck pipeline and then click
Configure.
Note:
<NF> denotes the network function. For example, in Policy, it is called as Policy-HealthCheck pipeline.Figure 2-2 Configure Healthcheck
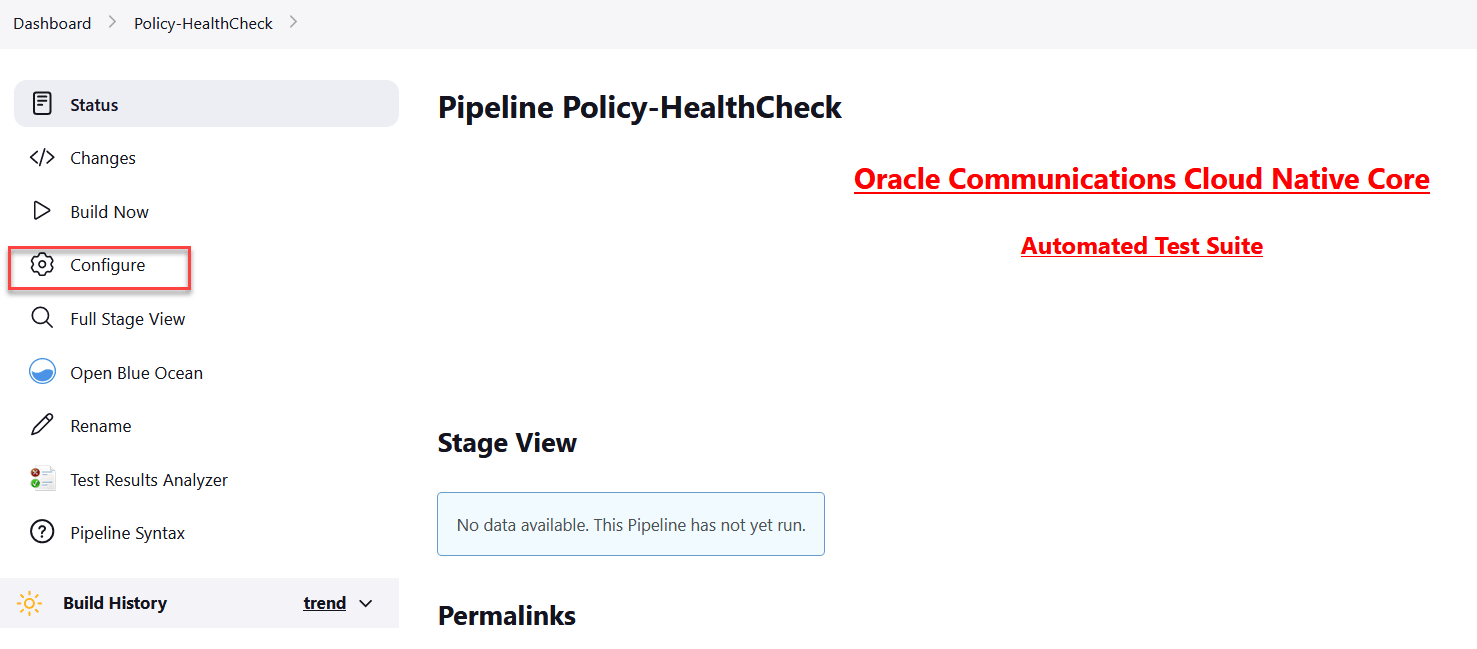
- Provide parameter a with Helm
release name deployed. If there are multiple releases, use comma to provide
all Helm release
names.
//a = helm releases [Provide Release Name with Comma Separated if more than 1 ]Provide parameter c with the appropriate Helm command, such as helm, helm3, or helm2.
//c = helm command name [helm or helm2 or helm3]Figure 2-3 Save the Changes
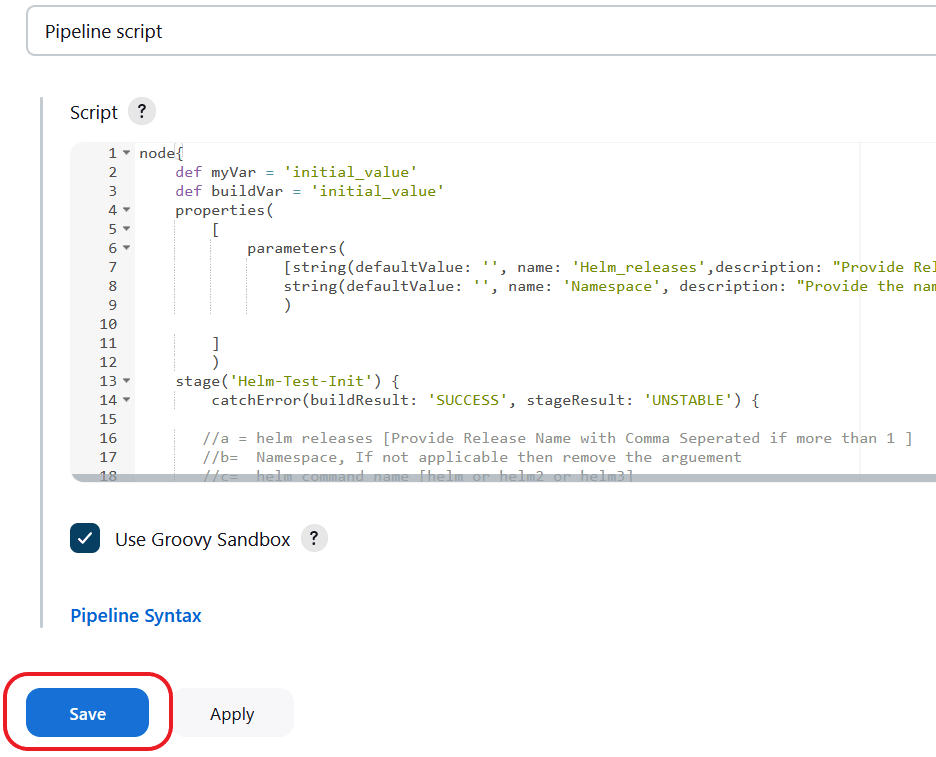
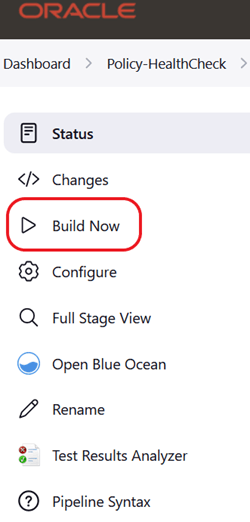
- Save the changes and click Build Now. ATS runs the
health check on respective network function.
Figure 2-4 Build Now
Deploying ATS Health Check in a Non-Webscale Environment
Perform the following procedure to deploy ATS Health Check in a non-webscale environment such as OCCNE:
Set the Webscale parameter set to 'false' and following parameters by encoding it with base64 in the ATS values.yaml file:
occnehostip: encrypted-data
occnehostusername: encrypted-data
occnehostpassword: encrypted-data
Example:
occnehostip=$(echo -n '10.75.217.42' | base64) , Where occne host ip needs to be provided
occnehostusername=$(echo -n 'cloud-user' | base64), Where occne host username needs to be provided
occnehostpassword=$(echo -n '****' | base64), Where password of host needs to be provided
Running ATS Health Check Pipeline in a Non-Webscale Environment
Perform the following procedure to run the ATS Health Check pipeline in a non-webscale environment such as OCCNE:
- Log in to ATS using respective <NF> login credentials.
- Click <NF>HealthCheck pipeline and then click Configure.
- Provide parameter a with Helm
release name deployed. If there are multiple releases, use comma to provide
all Helm release names.
Provide parameter b with SUT deployed namespace name.
Provide parameter c with the appropriate Helm command, such as helm, helm3, or helm2.
//a = helm releases [Provide Release Name with Comma Separated if more than 1 ]
//b = Namespace, If not applicable to WEBSCALE environment then remove the argument
//c = helm command name [helm or helm2 or helm3]
Figure 2-5 Save the Changes

- Save the changes and click Build Now. ATS runs the
health check on respective network function.
Figure 2-6 Build Now

By clicking Build Now, you can run the health check on ATS and store the result in the console logs.
2.4 ATS Jenkins Job Queue
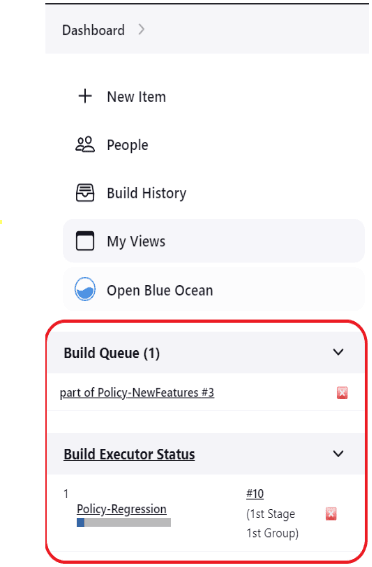
The ATS Jenkins Job Queue feature places the second job in a queue if the current job is already running from the same or different pipelines to prevent jobs from running in parallel to one another.
Figure 2-7 Build Executor Status
2.5 ATS Maintenance Scripts
- Taking a backup of the ATS custom folders and Jenkins pipeline.
- Viewing the configuration and restoring the Jenkins pipeline.
- Viewing the configuration and installing or uninstalling ATS and stubs.
ATS maintenance scripts are present in the ATS image at the
following path: /var/lib/jenkins/ocats_maint_scripts
kubectl cp <NAMESPACE>/<POD_NAME>:/var/lib/jenkins/ocats_maint_scripts <DESTINATION_PATH_ON_BASTION> podkubectl cp ocpcf/ocats-ocats-policy-694c589664-js267:/var/lib/Jenkins/ocats_maint_scripts /home/meta-user/ocats_maint_scripts pod2.6 ATS System Name and Version Display on the ATS GUI
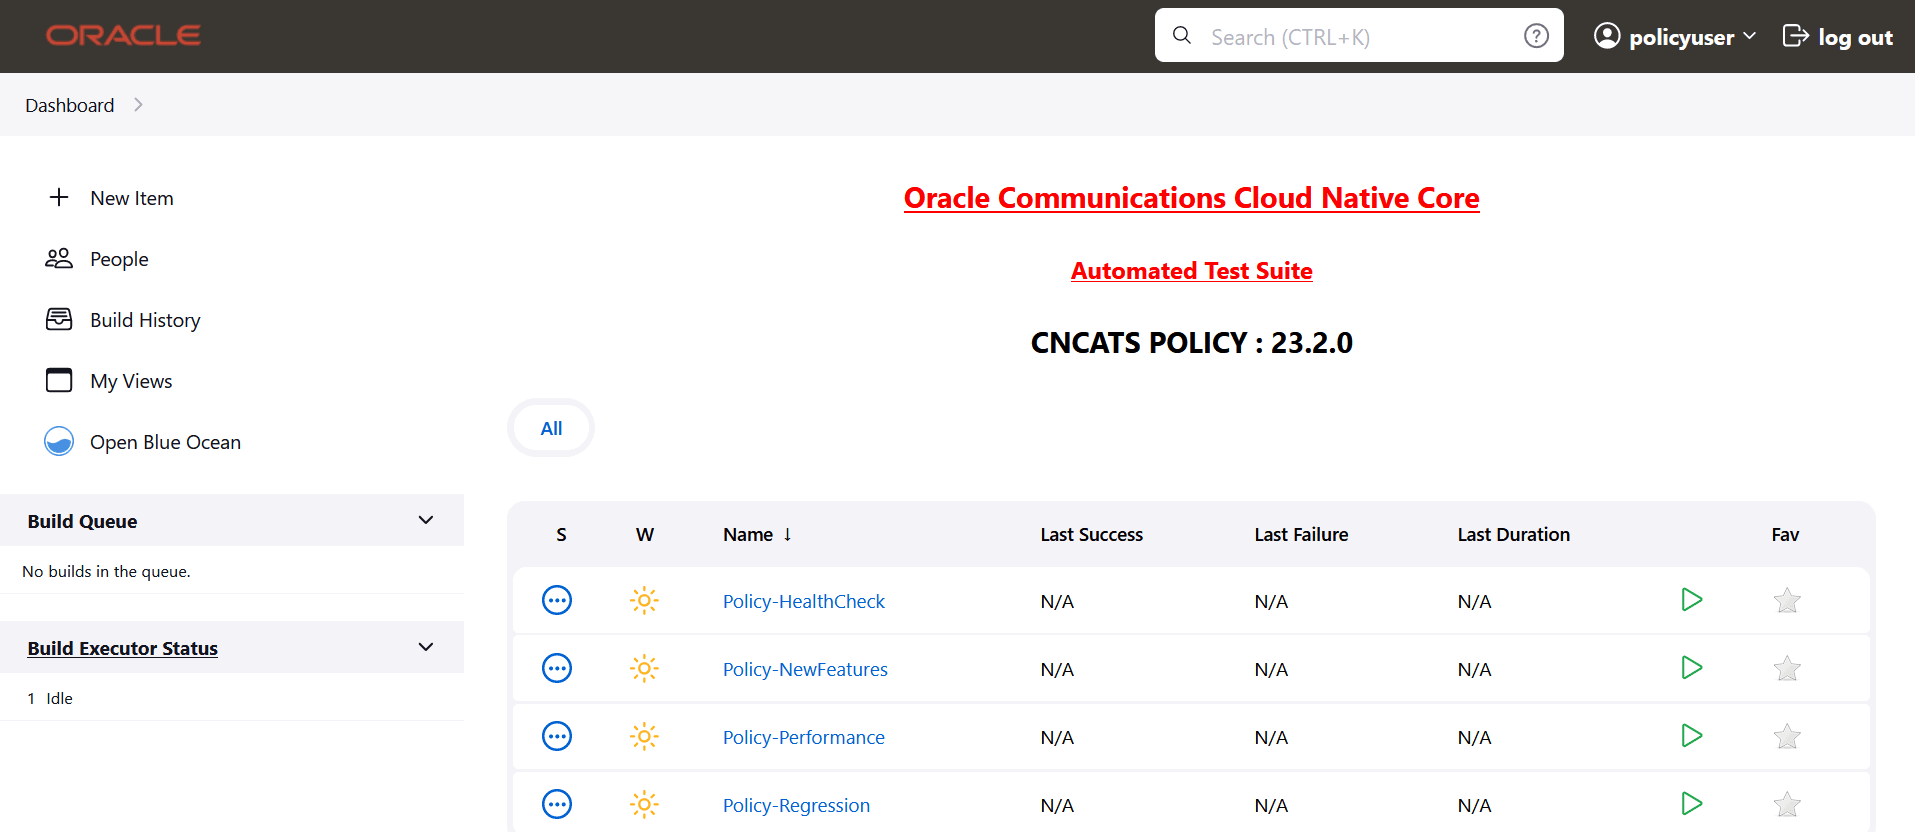
This feature displays the ATS system name and version on the ATS GUI.
- ATS system name: Abbreviated product name followed by NF name.
- ATS Version: Release version of ATS.
Figure 2-8 ATS System Name and Version
2.7 ATS Tagging Support
The ATS Tagging Support feature assists in running the feature files after filtering features and scenarios based on tags. Instead of manually navigating through several feature files, the user can save time by using this feature.
- Feature_Include_Tags: The features that contain either of the tags
available in the Feature_Include_Tags field are
considered for tagging.
- For example, "cne-common", "config-server". All the features that have either "cne-common" or "config-server" tags are taken into consideration.
- Feature_Exclude_Tags: The features that contain neither of the tags
available in the Feature_Exclude_Tags field are
considered for tagging.
- For example, "cne-common","config-server". All the features that have neither "cne-common" nor "config-server" as tags are taken into consideration.
- Scenario_Include_Tags: The scenarios that contain either of the
tags available in the Scenario_Include_Tags field are
considered.
- For example, "sanity", "cleanup". The scenarios that have either "sanity" or "cleanup" tags are taken into consideration.
- Scenario_Exclude_Tags: The features that contain neither of the tags
available in the Scenario_Exclude_Tags field are
considered.
- For example, "sanity", "cleanup". The scenarios that have neither "sanity" nor "cleanup" as tags are taken into consideration.
Filter with Tags
- On the NF home page, click any new feature or regression pipeline, where you want to use this feature.
- In the left navigation pane, click Build with
Parameters. The following image appears.
Figure 2-9 Filter with Tags
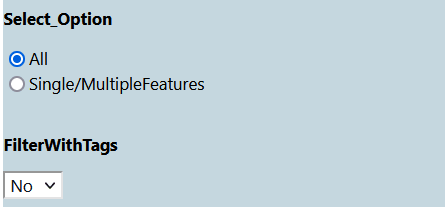
- Select Yes under
FilterWithTags. The result shows four input
fields.
Figure 2-10 Types of Tags

The default value of FilterWithTags field is "No".
- The input fields serve as a search or filter, displaying all tags that match
the prefix entered. You can select one or multiple tags.
Figure 2-11 Tags Matching with Entered Prefix

- Select the required tags from the different tags list and click Submit.
The specified feature-level tags are used to filter out features that contain any one of the include tags and none of the exclude tags. Here, any or both the fields may be left empty. All features are automatically taken into consideration when both fields are empty.
The scenario level tags are used to filter out the scenarios from the features filtered above. Only scenarios with any of the include tags and none of the exclude tags are considered. Any or both fields can be empty. When both fields are empty, all the scenarios from the above filtered feature files are considered.
Note:
- If you select the Select_Option as 'All', all the displayed features and scenarios will run.
- If you select the Select_Option as 'Single/MultipleFeatures, it enables you to select some features, and only those features and respective scenarios are going to run.
2.8 Custom Folder Implementation
The Custom Folder Implementation feature allows the user to update, add, or delete test cases without affecting the original product test cases in the new features, regression, and performance folders. The implemented custom folders are cust_newfeatures, cust_regression, and cust_performance. The custom folders contain the newly created, customised test cases.
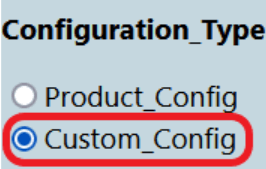
Initially, the product test case folders and custom test case folders will have the same set of test cases. The user can perform customization in the custom test case folders, and ATS always runs the test cases from the custom test case folders. If the option "Configuration_Type" is present on the GUI,the user needs to set its value to "Custom_Config" to populate test cases from the custom test case folders.
Figure 2-12 Custom Config Folder
- Separate folders such as cust_newfeatures, cust_regression, and cust_performance are created to hold the custom cases.
- The prepackaged test cases are available in the newfeature and regression Folder.
- The user copies the required test cases to the cust_newfeatures and cust_regression folders, respectively.
- Jenkins always points to the cust_newfeatures and cust_regression
folders to populate them in the menu.
If someone initially launches ATS, they will not see any test cases in the menu if the cust folders are not populated. To avoid this, it is recommended to prepopulate both the folders, cust and original, and ask the user to modify only the cust folder if needed.
Figure 2-13 Summary of Custom Folder Implementation

2.9 Single Click Job Creation
With the help of Single Click Job Creation feature, ATS users can easily create a job to run TestSuite with a single click.
2.10 Managing Final Summary Report, Build Color, and Application Log
This feature displays an overall execution summary, such as the total run count, pass count, and fail count.
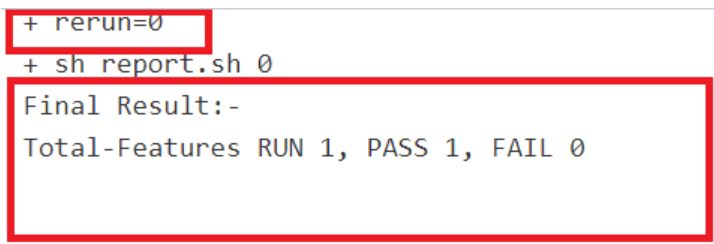
Supports Implementation of Total-Features- If rerun is set to 0, the test result report shows the following
result:
Figure 2-14 Total-Features = 1, and Rerun = 0
- If rerun is set to non-zero, the test result report shows the
following result:
Figure 2-15 Total-Features = 1, and Rerun = 2

After incorporating the Parallel Test Execution feature, the following results were obtained:
Final Summary Report Implementations
Figure 2-16 Group Wise Results
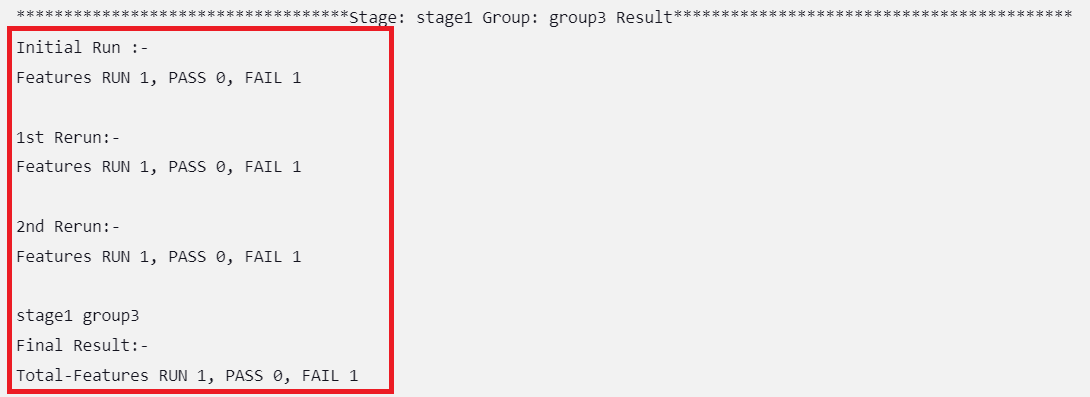
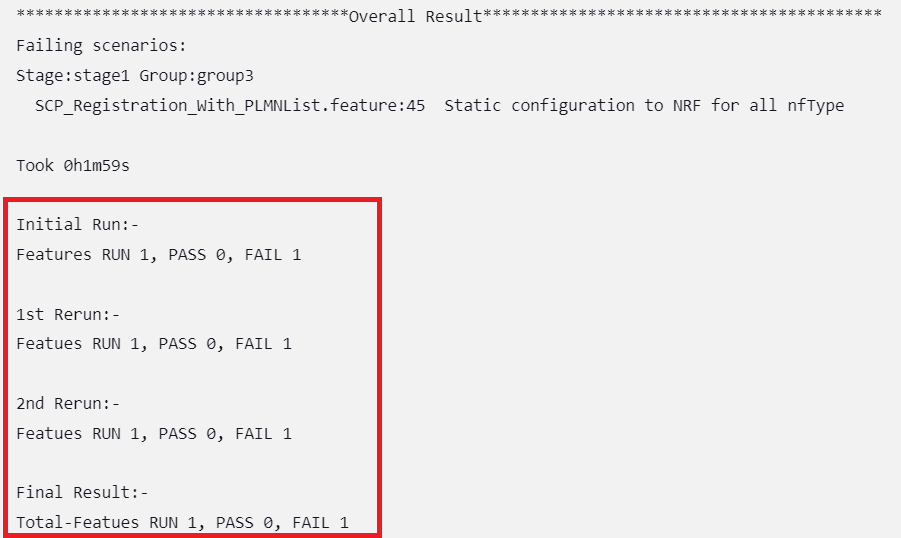
Figure 2-17 Overall Result When Selected Feature Tests Pass

Figure 2-18 Overall Result When Any of the Selected Feature Tests Fail
Implementing Build Colors
Table 2-2 Build Color Details
| Rerun Values | Rerun set to zero | Rerun set to non-zero | |||
|---|---|---|---|---|---|
| Status of Run | All Passed in Initial Run | Some Failed in Initial Run | All Passed in Initial Run | Some Passed in Initial Run, Rest Passed in Rerun | Some Passed in Initial Run, Some Failed Even After Rerun |
| Build Status | SUCCESS | FAILURE | SUCCESS | SUCCESS | FAILURE |
| Pipeline Color | GREEN | Execution Stage where test cases failed shows YELLOW color, rest of the successful stages are GREEN. | GREEN | GREEN | Execution Stage where test cases failed shows YELLOW color, rest of the successful stages are GREEN |
| Status Color | BLUE | RED | BLUE | BLUE | RED |
- the rerun count and the pass or fail status of test cases in the initial run
- the rerun count and the pass or fail status of test cases in the final run
For the parallel test case execution, the pipeline status also depends
on another parameter, "Fetch_Log_Upon_Failure," which is given in the
build with parameters page. If the parameter
Fetch_Log_Upon_Failure is not there, its default value is
considered "NO".
Table 2-3 Pipeline Status When Fetch_Log_Upon_Failure = NO
| Rerun Values | Rerun set to zero | Rerun set to non-zero | |||
|---|---|---|---|---|---|
| Passed/Failed | All Passed in Initial Run | Some Failed in Initial Run | All Passed in Initial Run | Some Passed in Initial Run, Rest Passed in Rerun | Some Passed in Initial Run, Some Failed Even After Rerun |
| Status | SUCCESS | FAILURE | SUCCESS | SUCCESS | FAILURE |
Table 2-4 Pipeline Status When Fetch_Log_Upon_Failure = YES
| Rerun Values | Rerun set to zero | Rerun set to non-zero | ||||
|---|---|---|---|---|---|---|
| Passed/Failed | All Passed in Initial Run | Some Failed in Initial Run and Failed in Rerun | Some Failed in Initial Run and Passed in Rerun | All Passed in Initial Run | Some Passed in Initial Run, Rest Passed in Rerun | Some Passed in Initial Run, Some Failed Even After Rerun |
| Status | SUCCESS | FAILURE | SUCCESS | SUCCESS | SUCCESS | FAILURE |
rerun_count, Fetch_Log_Upon_Failure, and
pass/fail status of test cases in initial and final run and the
corresponding build colors are as follows:
- When
Fetch_Log_Upon_Failureis set to YES andrerun_countis set to 0, test cases pass in the initial run. The pipeline will be green, and its status will show as blue.Figure 2-19 Fetch_Log_Upon_Failure is set to YES and rerun_count is set to 0, test cases pass

- When
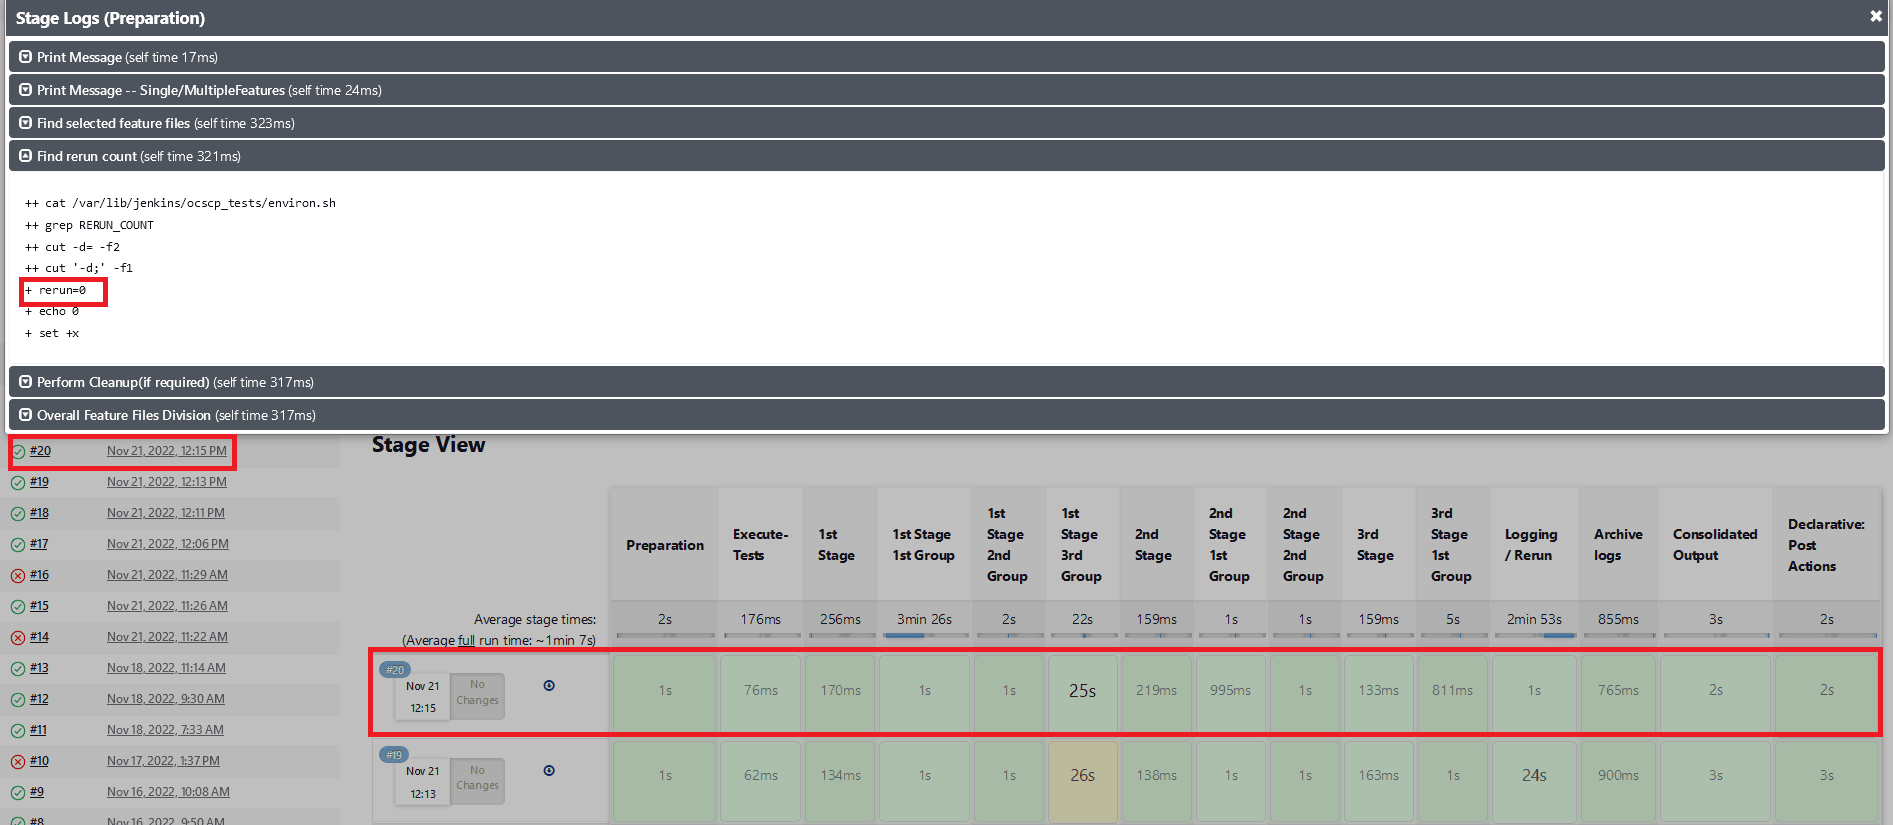
Fetch_Log_Upon_Failureis set to YES andrerun_countis set to 0, test cases fail on the initial run but pass during the rerun. The initial execution stage is yellow and all subsequent successful stages will be green, and the status will be blue.Figure 2-20 Test Cases Fail on the Initial Run but Pass in the Rerun
- When
Fetch_Log_Upon_Failureis set to YES andrerun_countis set to 0, test cases fail in both the initial and the rerun. Execution stages will show as yellow, all other successful stages will be shown as green, and the overall pipeline status will be red.Figure 2-21 Test Cases Fail in Both the initial and the Rerun
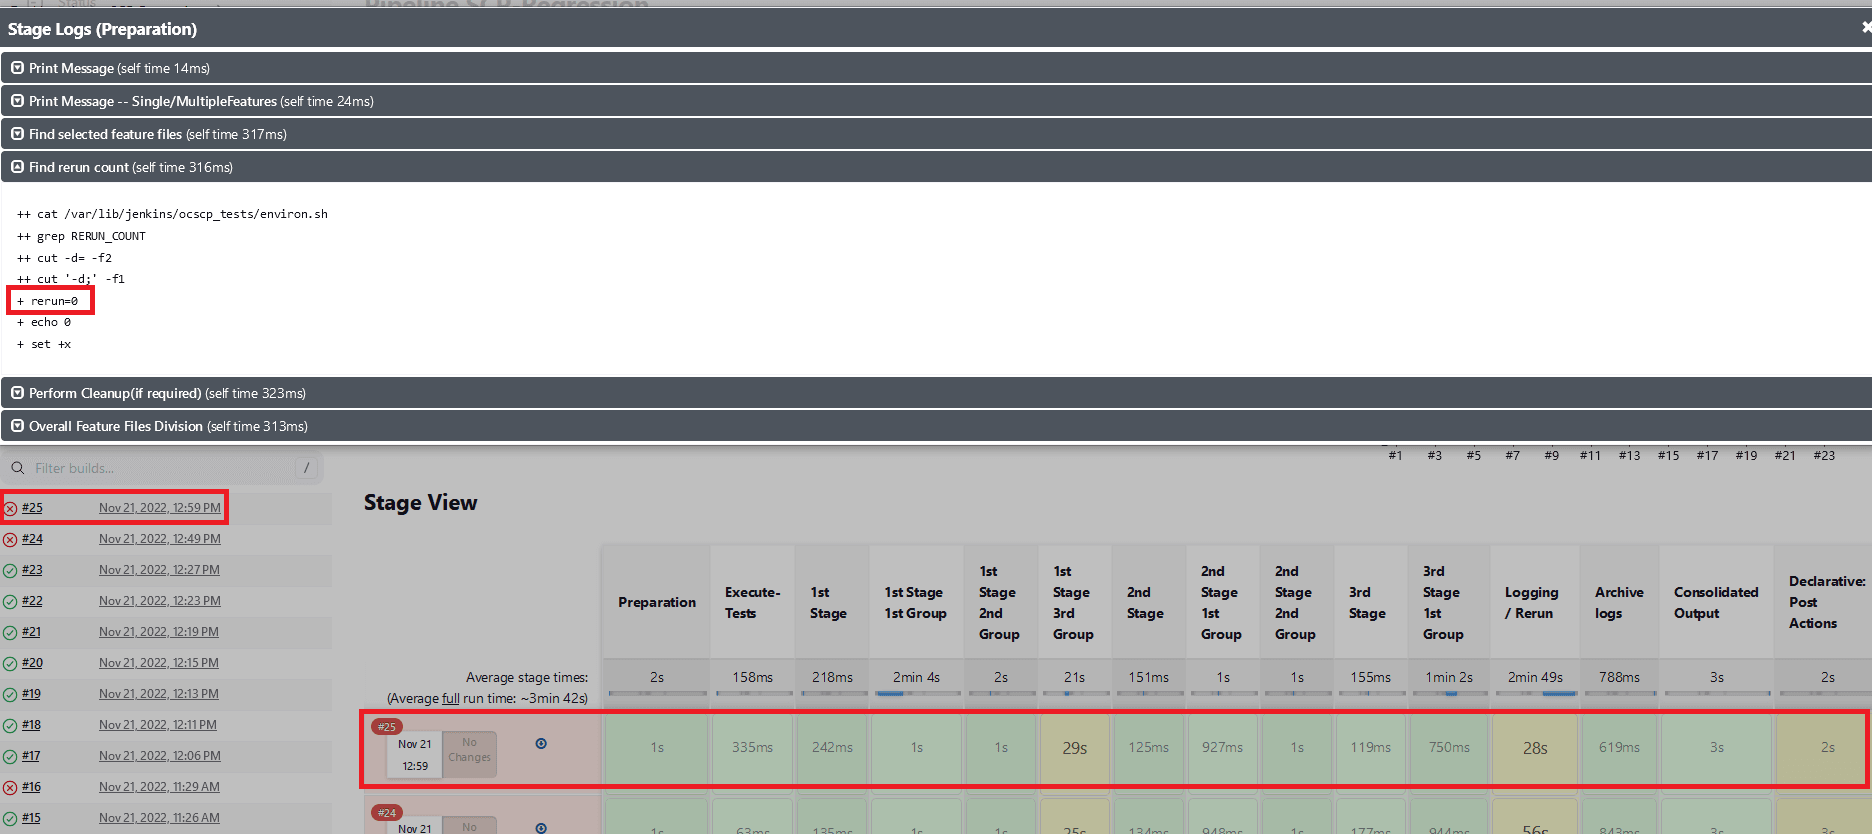
- When
Fetch_Log_Upon_Failureis set to YES and thererun countis set to non-zero. If all of the test cases pass in the first run, no rerun will be initiated because the cases have already been passed. The pipeline will be green, and the status will be indicated in blue.Figure 2-22 All of the Test cases Pass in the Initial Run
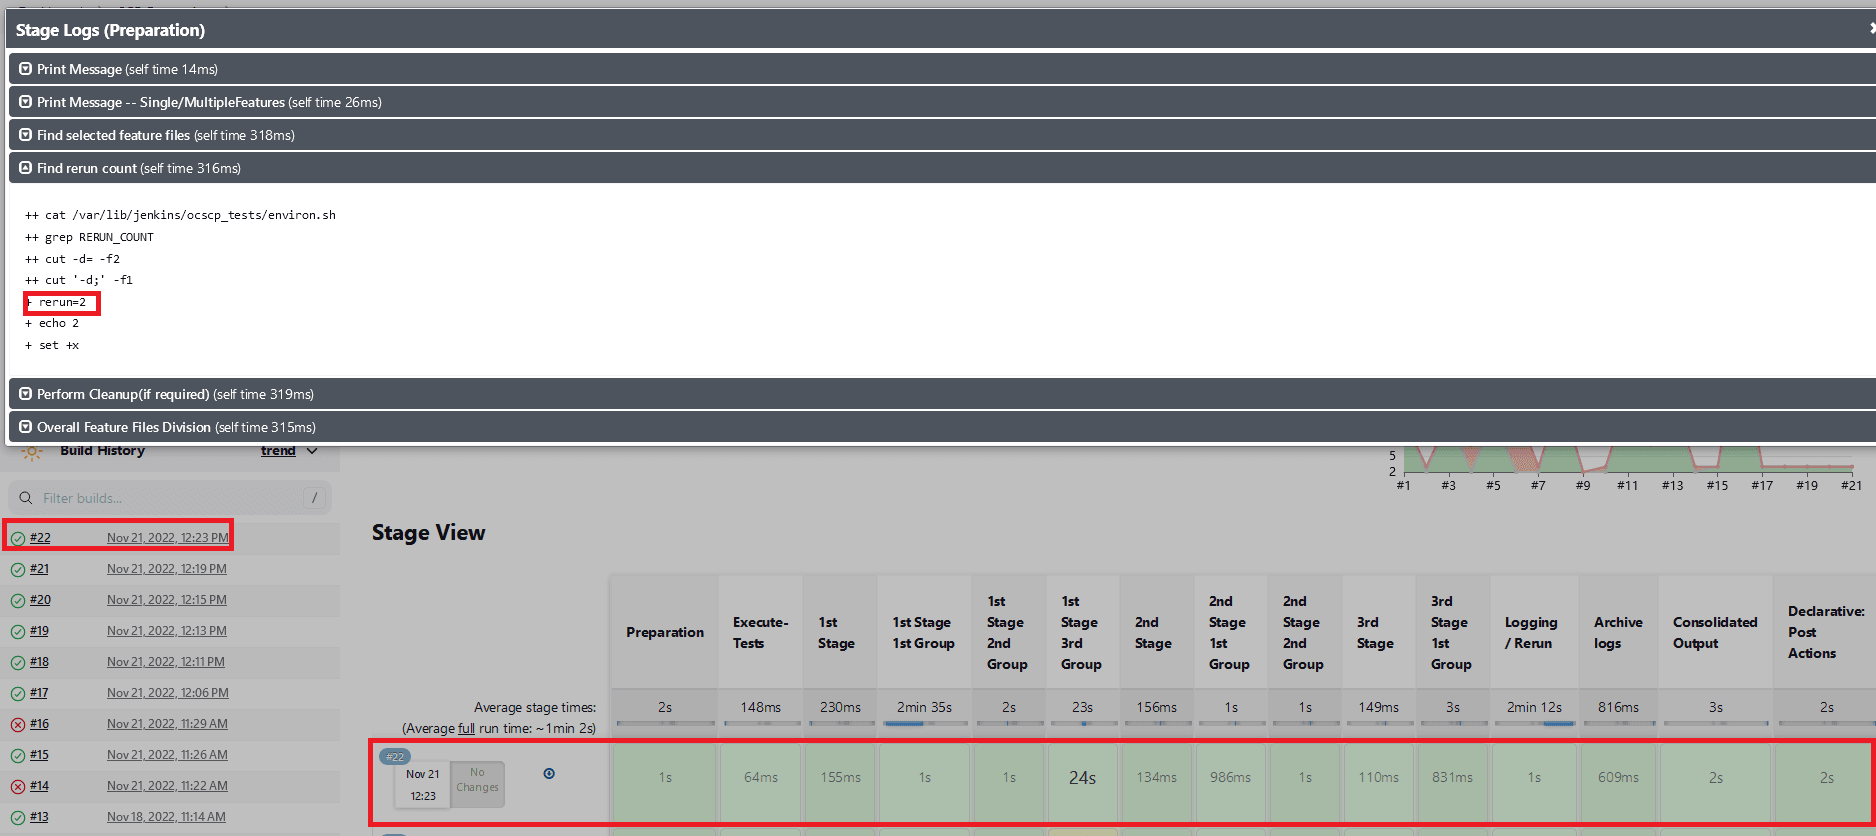
- When
Fetch_Log_Upon_Failureis set to YES and thererun countis set to non-zero. If some of the test cases fail in the initial run and the remaining ones pass in one of the remaining reruns, then the initial test case execution stages will show as yellow, the remaining stages as green, and the overall pipeline status as blue.Figure 2-23 Test Cases Fail in the Initial Run and the Remaining Ones Pass
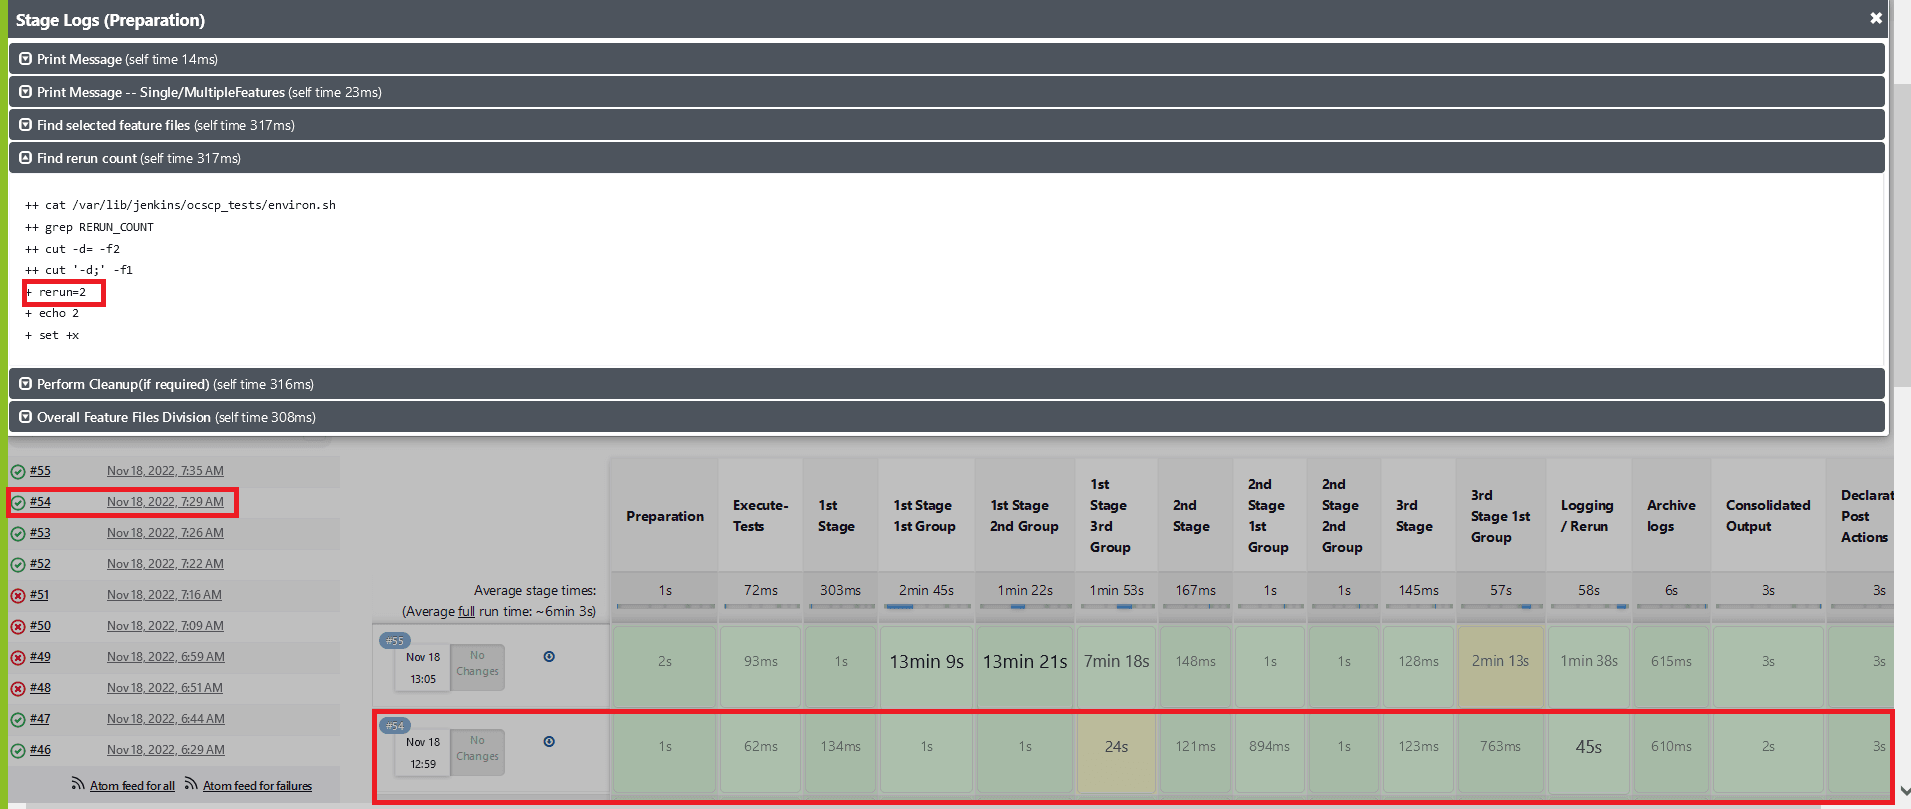
- When
Fetch_Log_Upon_Failureis set to YES and thererun countis set to non-zero. If some of the test cases fail in the initial run and the remaining ones fail in all the remaining reruns, the stages of test case execution will be shown in yellow, the remaining stages in green, and the overall pipeline status in red.Figure 2-24 Test Cases Fail in the Initial and Remaining Reruns

- Whenever any of the multiple Behave processes that are running
in the ATS are exited without completion, the stage in which the process
exited and the consolidated output stage are shown as yellow, and the
overall pipeline status will be yellow. Also in the consolidated output
stage, near the respective stage result, the exact run in which the Behave
processes exited without completion will be printed.
Figure 2-25 Stage View When Behave Process is Incomplete

Figure 2-26 Consolidated Report for a Group When a Behave Process was Incomplete

Implementing Application Log
ATS automatically fetches the SUT Debug logs during the rerun cycle if it encounters any failures and saves them in the same location as the build console logs. The logs are fetched for the rerun time duration only using the timestamps. If, for some microservices, there are no log entries in that time duration, it does not capture them. Therefore, the logs are fetched only for the microservices that have an impact or are associated with the failed test cases.
Location of SUT Logs:
/var/lib/jenkins/.jenkins/jobs/PARTICULAR-JOB-NAME/builds/BUILD-NUMBER/date-timestamp-BUILD-N.txt
Note:
The file name of the SUT log is added as a suffix with the date, timestamp, and build number (for which the logs are fetched). These logs share the same retention period as build console logs, set in the ATS configuration. It is recommended to set the retention period to optimal owing to the Persistent Volume Claim (PVC) storage space availability.
.2.11 Lightweight Performance
The Lightweight Performance feature allows you to run performance test cases. In ATS, a new pipeline known as "<NF>-Performance", where NF stands for Network Function, is introduced, for example, SLF-Performance.
Figure 2-27 Sample Screen: UDR Home Page
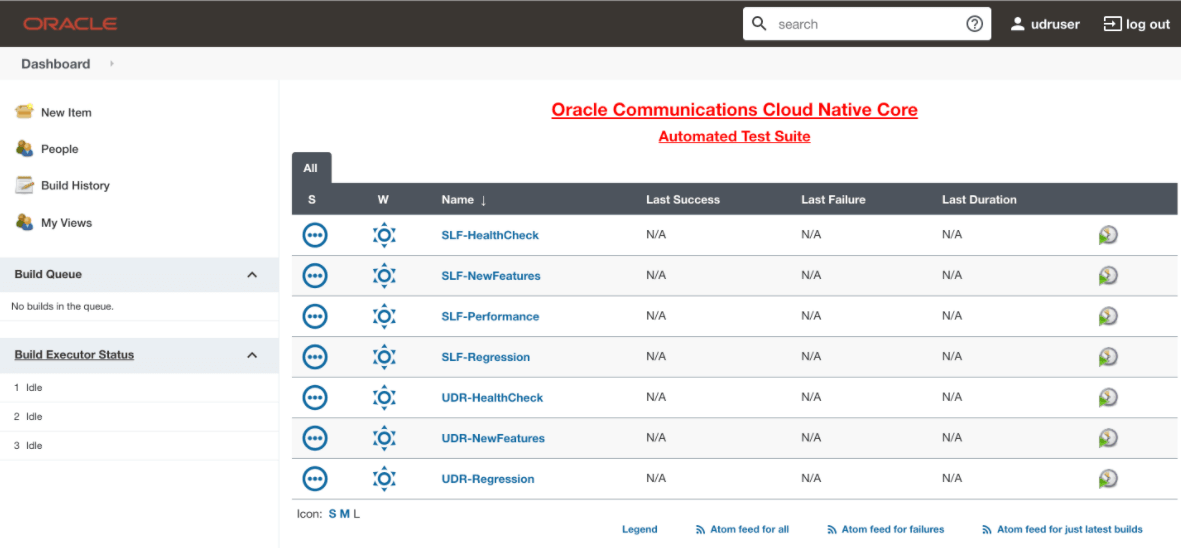
The <NF>-Performance pipeline verifies from 500 to 1k TPS (Transactions per Second) of traffic using the http-go tool, a tool used to run the traffic on the backend. It also helps to monitor the CPU and memory of microservices while running lightweight traffic.
The duration of the traffic run can be configured on the pipeline.
2.12 Modifying Login Password
You can log in to the ATS application using the default login credentials. The default login credentials are shared for each NF in the respective chapter of this guide.
- Log in to the ATS application using the default login credentials.
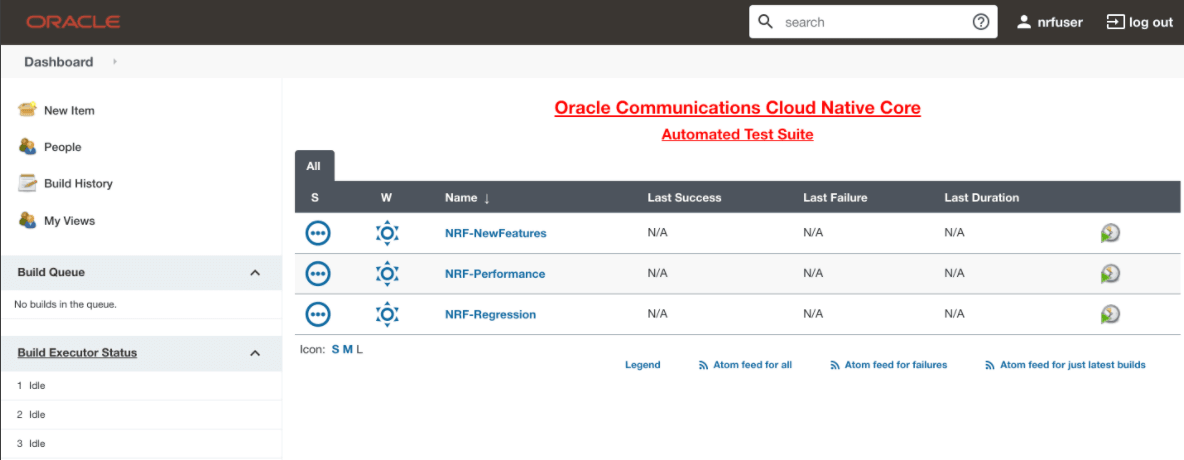
The home page of the respective NF appears with its preconfigured pipelines as
follows:
Figure 2-28 Sample Screen: NRF Home Page
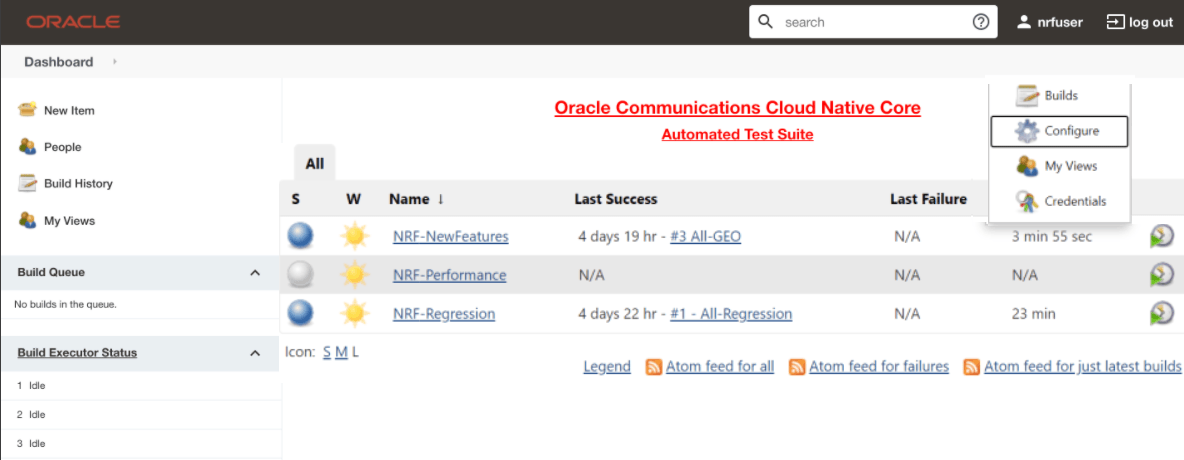
- Hover over the user name and click the down arrow.
- Click Configure.
Figure 2-29 Configure Option
The following page appears:
Figure 2-30 Logged-in User Details
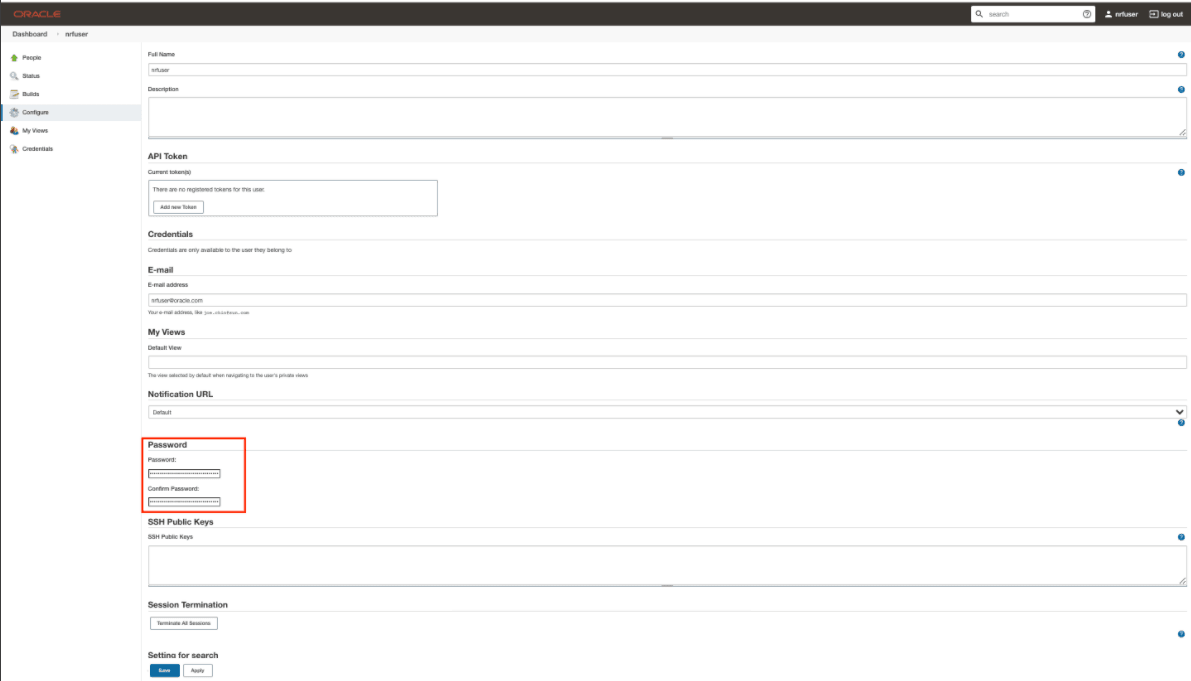
- In the Password section, enter the new password in the Password and Confirm Password fields.
- Click Save.
A new password is set for you.
2.13 Parallel Test Execution
Parallel test execution enables you to perform multiple logically grouped tests simultaneously on the same System Under Test (SUT) to reduce the overall execution time of ATS.
ATS currently executes all its tests in a sequential manner, which is time-consuming. With parallel test execution, tests can be run concurrently rather than sequentially or one at a time. Test cases or feature files are now separated into different folders, such as stages and groups, for concurrent test execution. Different stages, such as stage 1, stage 2, and stage 3, run the test cases in a sequential order, and each stage has its own set of groups. Test cases or feature files available in different groups operate in parallel. When all the groups within one stage have completed their execution, then only the next stage will start the execution.
Pipeline Stage View
The pipeline stage view appears as follows:
Figure 2-31 Pipeline Stage View

Pipeline Blue Ocean View
Figure 2-32 Pipeline Blue Ocean View

Impact on Other Framework Features
2.13.1 Downloading or Viewing Individual Group Logs
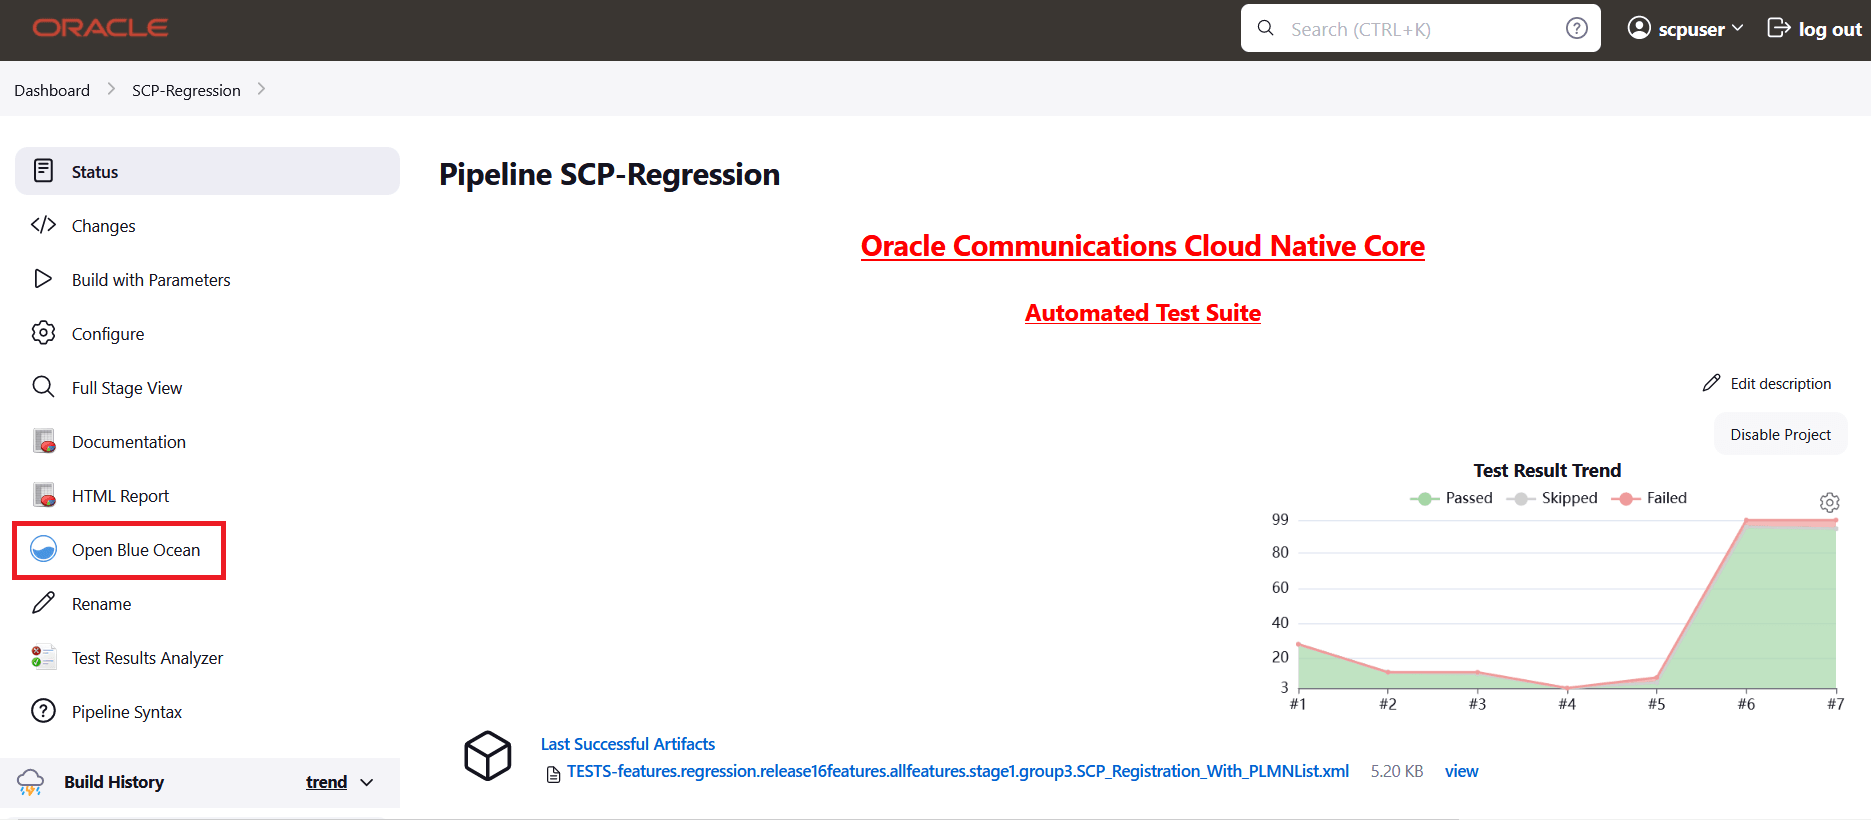
- On the Jenkins pipeline page, click Open Blue Ocean in the left
navigation pane.
Figure 2-33 Jenkins Pipeline Page
- Click the desired build row on the Blue Ocean page.
Figure 2-34 Run the Build
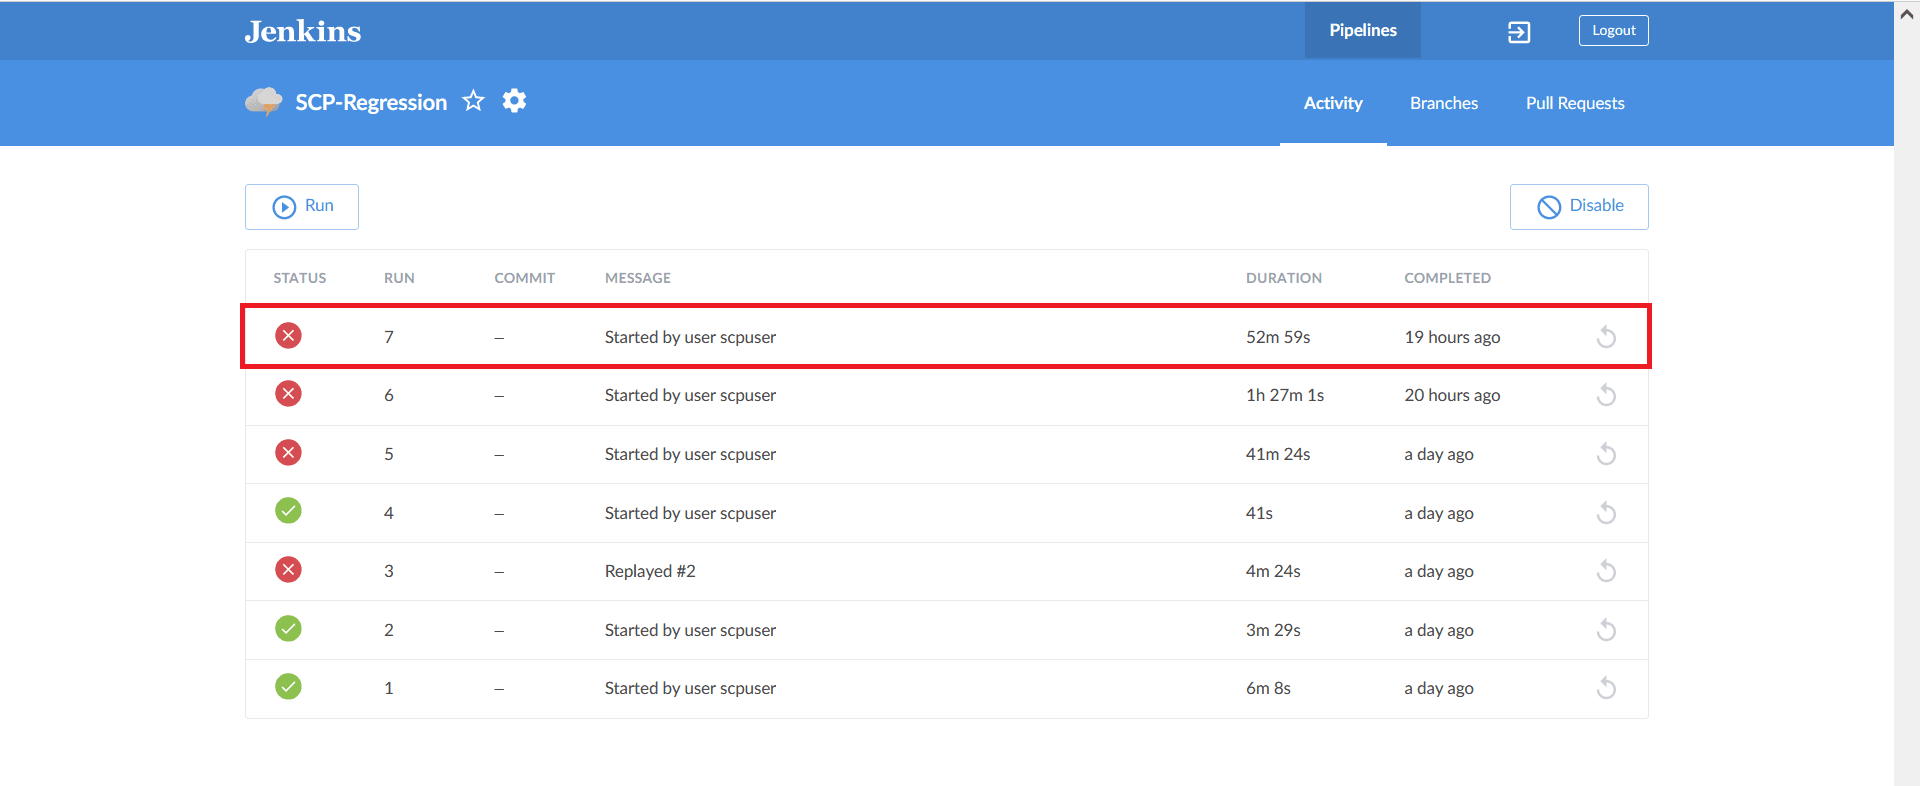
- The selected build appears. The diagram displays the order in which the
different stages, or groups, are executed.
Figure 2-35 Stage Execution

- Click the desired group to download the logs.
Figure 2-36 Executed Groups
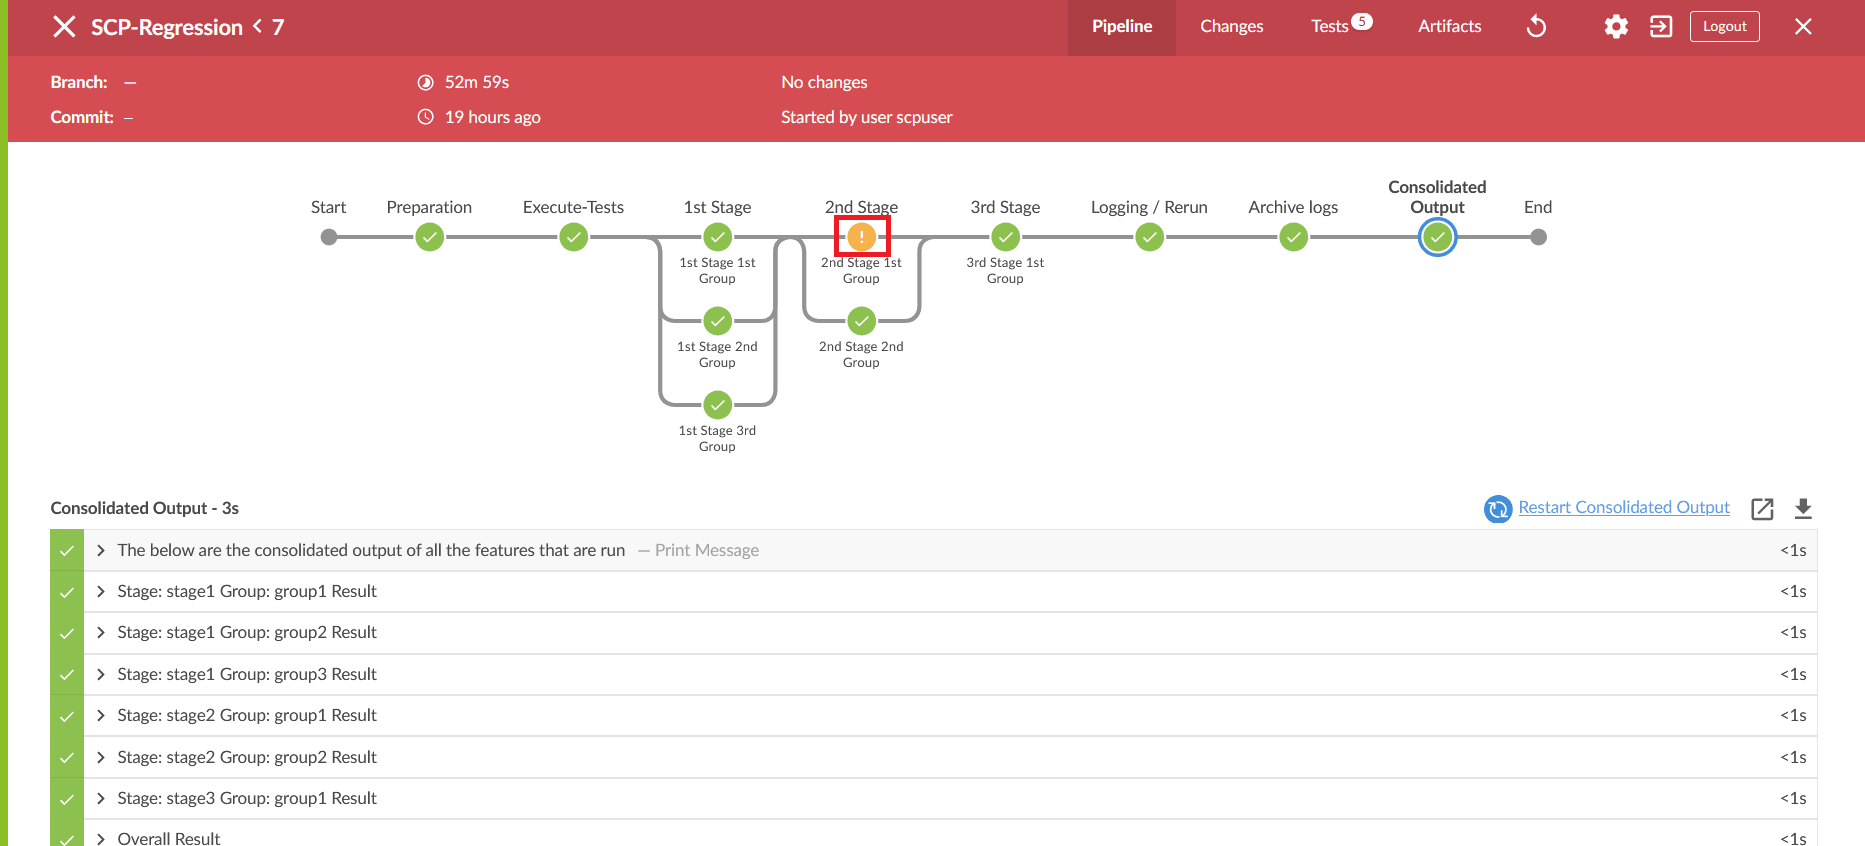
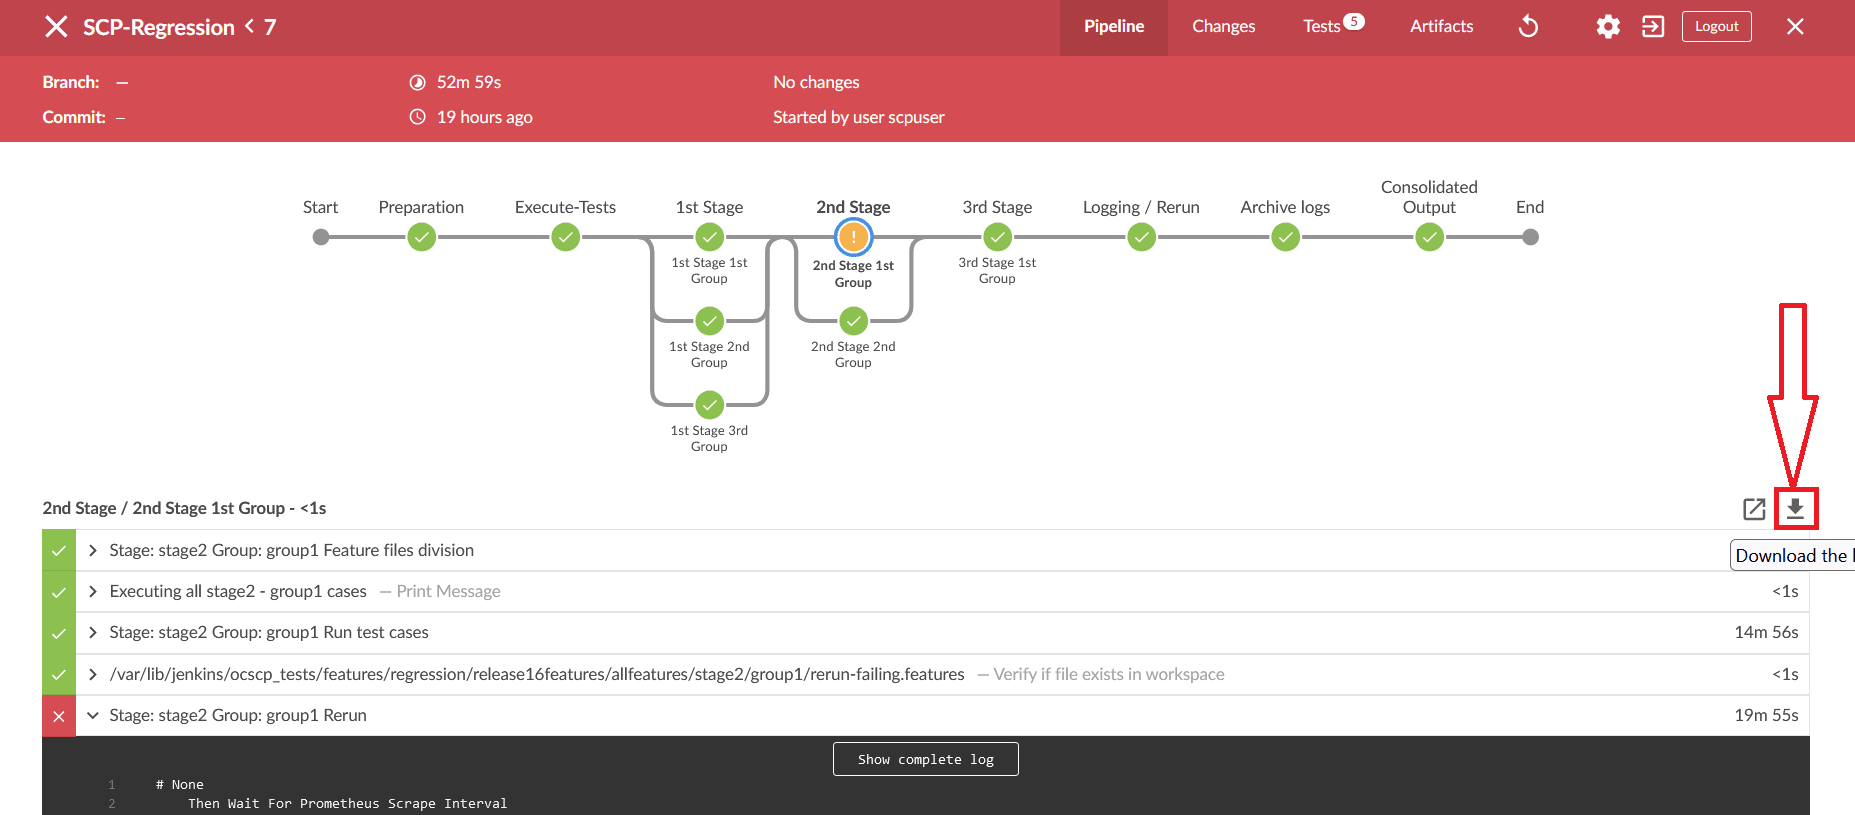
- Click the Download icon on the bottom right of the pipeline. The log for
the selected group is downloaded to the local system.
Figure 2-37 Download Logs
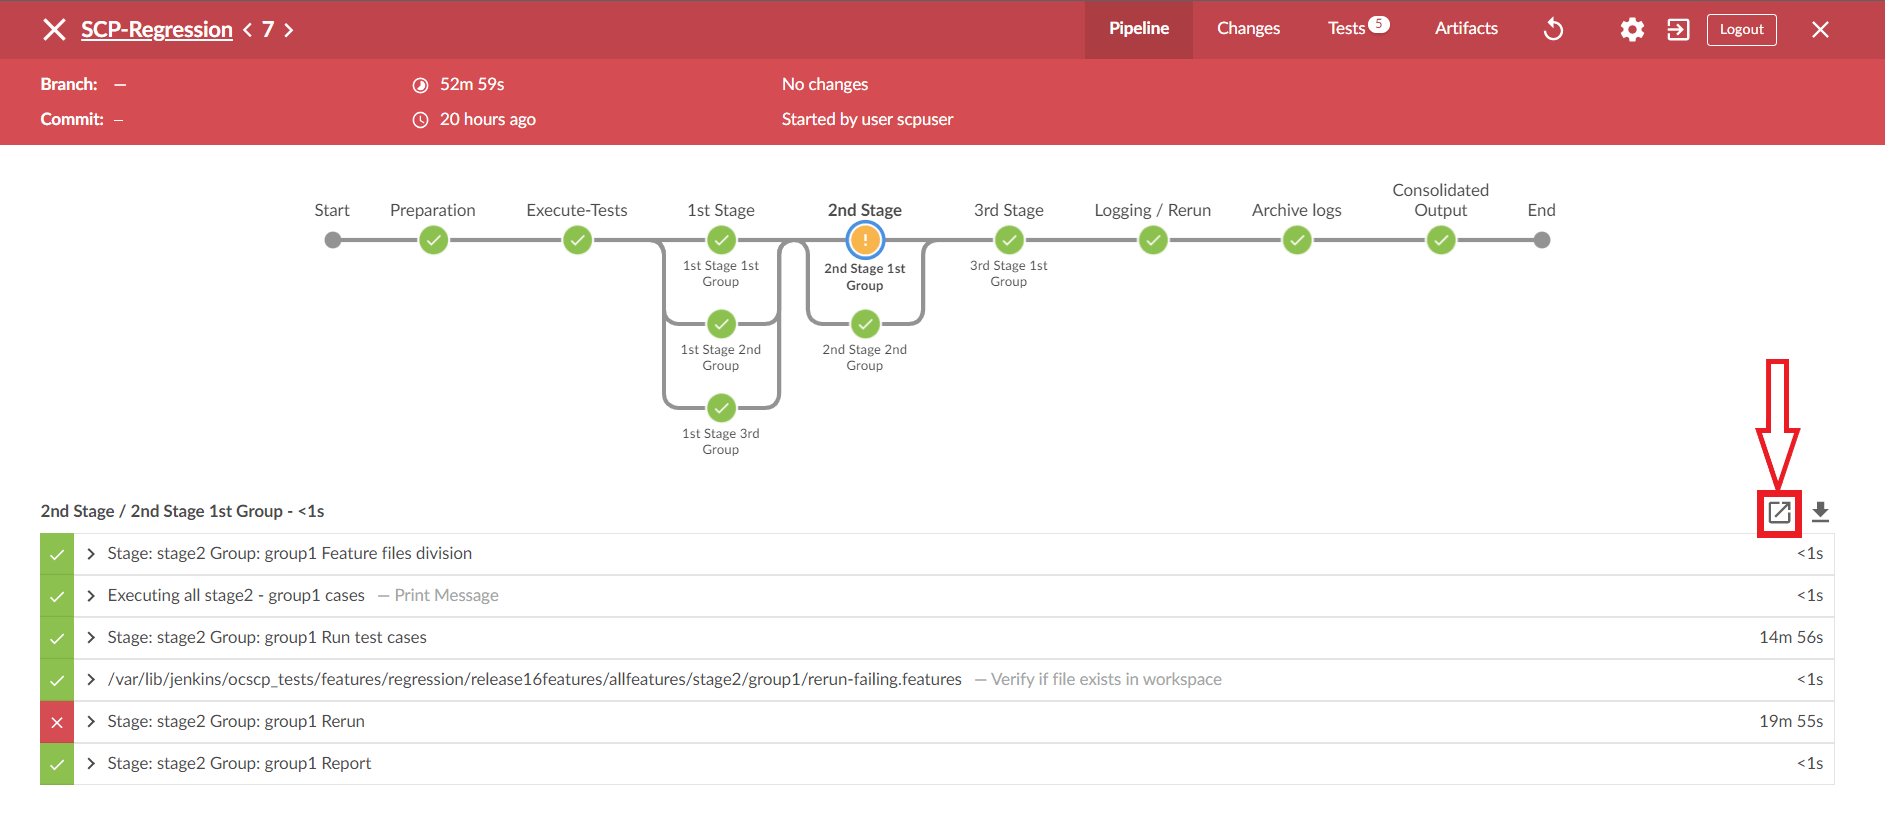
- To view the log, click the Display Log icon. The logs are displayed in a
new window.
Figure 2-38 Display Logs
Viewing Individual Group Logs without using Blue Ocean
- Using Stage View
- On the Jenkins pipeline page, hover the cursor over the group in stage view to view the logs.
- A pop-up with the label "Logs" will appear. Click on it.
- There will be a new pop-up window.It contains many rows, where each row corresponds to the execution of one Jenkins step.
- Click on the row labelled Stage: stage_name>."Group: <group_name> Run test cases to view the log for this group's execution.
- Click on the row labelled Stage: stage_name>." "group_name> Rerun to display the re-run logs.
- Using Pipeline Steps Page
- On the Jenkins pipeline page, under the Build History dropdown, click on the desired build number.
- Click the Pipeline Steps button on the left pane.
- A table with columns for step, arguments, and status appears.
- Under the Arguments column, find the label for the desired stage and group.
- Click on the step with the label Stage: <stage_name> Group: <group_name> Run test cases under it or click the Console output icon near the status to view the log for this group execution.
- To see rerun logs, find the step with the label Stage: <stage_name> Group: <group_name> Rerun under it.
2.14 Parameterization
This feature allows you to provide or adjust values for the input and output
parameters needed for the test cases to be compatible with the SUT configuration. You
can update or adjust the key-value pair values in the global.yaml
and feature.yaml files for each of the feature files so that they
are compatible with SUT configuration. In addition to the existing custom test case
folders (Cust New Features, Cust Regression, and Cust Performance), this feature enables
folders to accommodate custom data, default product configuration, and custom
configuration. You can maintain multiple versions or copies of the custom data folder to
suit varied or custom SUT configurations. With this feature, the ATS GUI has the option
to either execute test cases with the default product configuration or with a custom
configuration.
- Define parameters and assign or adjust values to make them compatible with SUT configuration.
- Execute test cases either with default product configurations or custom configurations and multiple custom configurations to match varied SUT configurations.
- Assign or adjust values for input or output parameters through custom or default configuration yaml files (key-value pair files).
- Define or adjust the input or output parameters for each feature file with its corresponding configuration.
- Create and maintain multiple configuration files to match multiple SUT configurations.
Figure 2-39 SUT Design Summary

- The Product Config folder contains default product configuration files (feature-wise yaml per key-value pair), which are compatible with default product configuration.
- New features, Regression and Performance, Data folder, and Product Config folders are replicated or copied into custom folders and delivered as part of the ATS package in every release.
- You can customize custom folders by:
- Removing test cases not needed or as appropriate for your use.
- Adding new test cases as needed or as appropriate for your use.
- Removing or adding data files in the cust_data folder or as appropriate for your use.
- Adjusting the parameters or values in the key-value pair per yaml file in the custom config folder for test cases to run or pass with a custom configured SUT.
- The product folders are always intact (unchanged) and you can update the Custom folders
- You can maintain multiple copies of Custom Configurations and bring them to use as needed or as appropriate for the SUT configuration.
Figure 2-40 Folder Structure

2.15 PCAP Log Collection
PCAP Log Collection allows collecting the NF, SUT, or PCAP logs from the debug tool sidecar container. This feature can be integrated and delivered as a standalone or along with the Application Log Collection feature. For information, see Application Log Collection.
PCAP Log Integration
- The Debug tool should be enabled on SUT Pods while deploying the NF. The
name of the Debug container must be "tools".
For example, in SCP, the debug tool should be enabled for all the SCP microservice pods.
- Update the following parameters in the values.yaml file, under the
resource section, with ATS minimum resource requirements:
- CPU: 3
- memory: 3Gi
- On the home page, click any new feature or regression pipeline.
- In the left navigation pane, click Build with Parameters.
- Select YES from the drop-down menu of Fetch_Log_Upon_Failure.
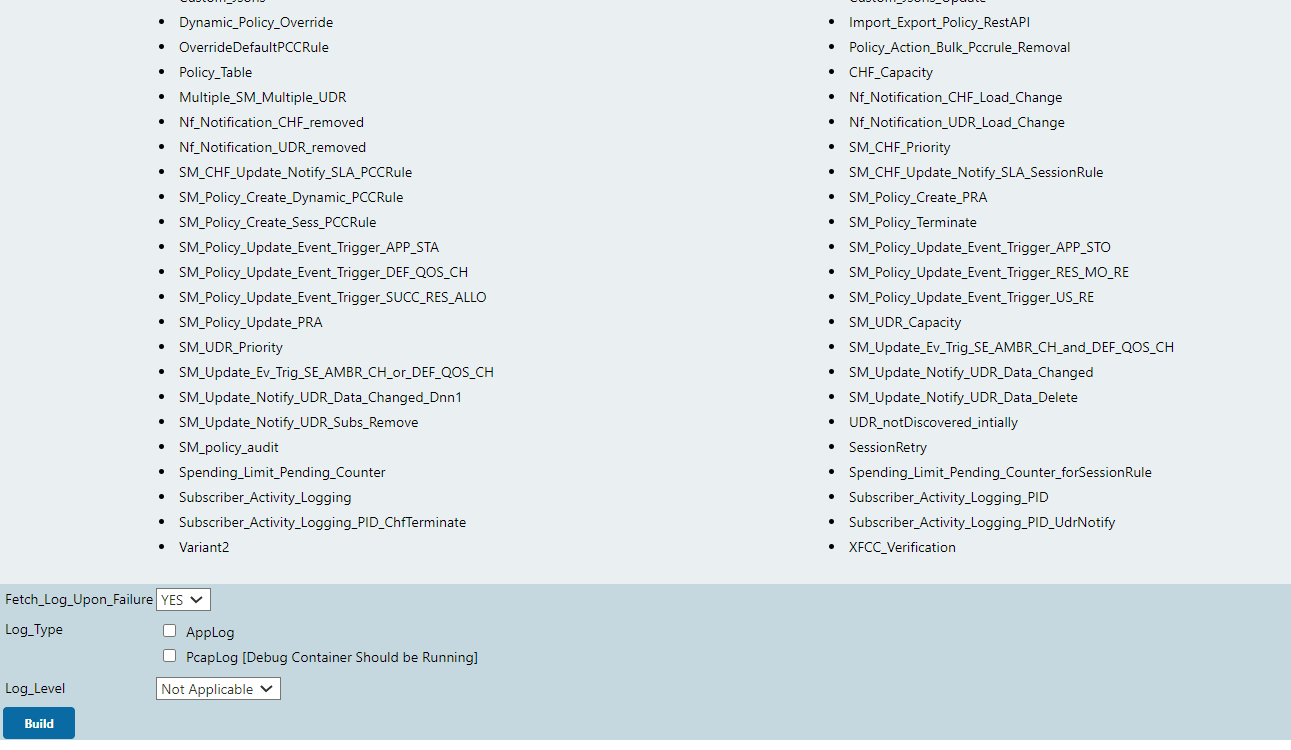
- If option Log_Type is available, select value PcapLog [Debug Container Should be Running] for it.
- Select PcapLog [Debug Container Should be
Running] to activate PCAP Log Collection in ATS-NF.
The following Build with Parameters page appears when only the PCAP logs feature has been integrated.
Figure 2-41 PCAP Logs Selection Option

- After the build execution is complete, go into the ATS pod, then
navigate to below path to find the pcaplogs:
.jenkins/jobs/<Pipeline
                    Name>/builds/<build number>/
For example,
.jenkins/jobs/SCP-Regression/builds/5/Pcaplogs is present in zip form. Unzip it to get the log files.
Figure 2-42 Both Application Logs and PCAP Logs Selection
2.16 Persistent Volume for 5G ATS
The Persistent Volume (PV) feature allows ATS to retain historical build execution data, test cases, and ATS environment configurations.
ATS Packaging When Using Persistent Volume
- Without the Persistent Volume option: ATS package includes an ATS image with test cases.
- With Persistent Volume option: ATS package includes the ATS
image and test cases separately. The new test cases are provided between the
releases.
To support both with and without Persistent Volume options, test cases and execution job data are packaged in the ATS image as well as a tar file.
2.17 Test Results Analyzer
The Test Results Analyzer is a plugin available in ATS to view pipeline test results based on XML reports. It provides the test results report in a graphical format, which includes consolidated and detailed stack trace results in case of any failures. It allows you to navigate to each and every test.
- PASSED: If the test case passes.
- FAILED: If the test case fails.
- SKIPPED: If the test case is skipped.
- N/A: If the test cases are not executed in the current build.