2 ATS Framework Features
This chapter describes the ATS Framework features:
Table 2-1 ATS Framework Features Compliance Matrix
| Features | OCNADD |
|---|---|
| Application Log Collection | No |
| ATS API | No |
| ATS Health Check | No |
| ATS Jenkins Job Queue | Yes |
| ATS Maintenance Scripts | Yes |
| ATS System Name and Version Display on Jenkins GUI | Yes |
| ATS Tagging Support | Yes |
| Custom Folder Implementation | No |
| Single Click Job Creation | Yes |
| Managing Final Summary Report, Build Color, and Application Log | Partially compliant (Application Log is not supported.) |
| Lightweight Performance | No |
| Modifying Login Password | Yes |
| Parallel Test Execution | No |
| Parameterization | No |
| PCAP Log Collection | No |
| Persistent Volume | Optional |
| Test Result Analyzer | Yes |
| Test Case mapping and Count | Yes |
| TLS Support | Yes |
Changes in Jenkins GUI
Listed below are some enhancements to the ATS Jenkins:
- Displays test cases under their stage and group names on the BuildWithParameters page of the ATS GUI.
- ATS Framework supports TLSv1.2 and TLSv1.3.
- ATS GUI Layout is enhanced.
2.1 ATS API
- Start: To initiate one of the three test suites, such as Regression, New Features, or Performance.
- Monitor: To obtain the progress of a test suite's execution.
- Stop: To cancel an active test suite.
- Get Artifacts: To retrieve the JUNIT format XML test result files for a completed test suite.
For more information about configuring the tasks, see Use the RESTful Interfaces.
2.1.1 Creating API User and Granting Access
You require an account as an API user with access authorization and an API token that has to be generated for the user to perform routine ATS tasks using the Restful Interfaces API.
2.1.1.1 Creating an API User
- Log in to the ATS application using admin credentials.
- In the left navigation pane of the ATS application, click Manage ATS.
- Scroll down and click Manage Users.
- In the left navigation pane, click Create User.
- Enter the username as
<nf>apiuser, for example,policyapiuser,udrapiuser, and a password. - The Full name field is optional. If left blank, it’s automatically assigned a value by Jenkins.
- Enter your email address as
<nf>apiuser@oracle.com. - Click Create User. The API user is created.
2.1.1.2 Granting Access to the API User
- In the left navigation pane, click Manage ATS.
- Scroll down and click Configure Global Security.
- Scroll down to Authorization and click Add User.
- Enter the username created in the prompt that appears.
- Check all the boxes in the Authorization matrix for apiuser that
are also checked for
<nf>user. - Click Save.
- Go to the ATS main page and choose each of your NFs' pipeline.
- In the left navigation pane, click Configure.
- Scroll down to Enable project-based security and click Add user.
- Enter the user name created in the prompt that appears.
- Check all the boxes in the Authorization matrix for API user that
are also checked for
<nf>user. - Click Save.
Now, API user can be used in API calls.
2.1.1.3 Generating an API Token for a User
Any API call requires the use of an API token for authentication. You can generate the API token, and it works until it is revoked or deleted.
Perform the following procedure to generate an API token for a user:
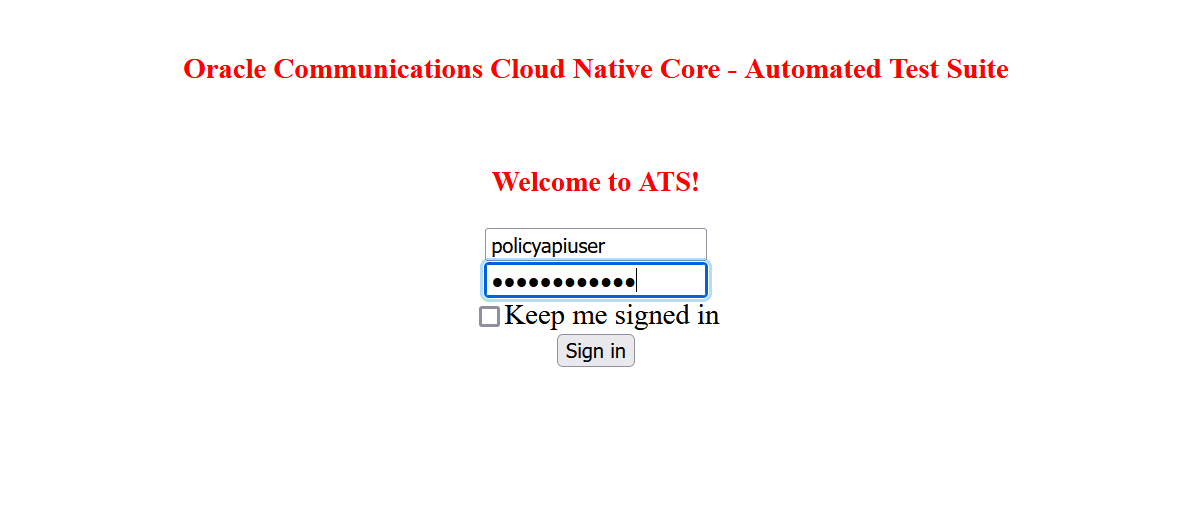
- Log in to Jenkins as an NF API user to generate an API token.
Figure 2-1 ATS Login Page
- Click user name from the drop-down list at the top right of the Jenkins
GUI, and then click Configure.
Figure 2-2 Configure to Add Token

- In the API Token section, click Add New Token.
Figure 2-3 Add New Token

- Enter a suitable name for the token, such as policy, and then click
Generate.
Figure 2-4 Generate Token

- Copy and save the generated token.
You cannot retrieve the token after closing the prompt.
Figure 2-5 Save Generated Token

- Click Save.
An API token is generated and can be used for starting, monitoring, and stopping a job using the REST API.
2.1.2 Use the RESTful Interfaces
This section provides an overview of each RESTful interface.
2.1.2.1 Starting Jobs
- Default Jenkins API: The default Jenkins API to start a pipeline job
- Custom API: To start a job forcibly
- Run the following command to start a job (Default Jenkins
method):
curl --request POST <Jenkins_host_port>/job/<Pipeline_name>/buildWithParameters –user
      <username>:<API_token> --verbose
The details of the parameters for the API are as follows:Table 2-2 API Parameters
Parameters Mandatory Default Value Description userName YES NA This parameter indicates the name of API user. token YES NA This parameter indicates the API token for API user. Startjob_host_port YES NA This parameter's format is <host>:<port><host>will be same as Jenkins host<port>will be different( 5001 or its nodeport )
pipelineName YES NA This parameter indicates the name of the pipeline for which build is to be triggered. pageAndQuery YES NA This parameter can have two values: - buildWithParameters: for parametrized pipelines
- build: for non-parametrized pipelines
jenkins_wait_time NO 5 This parameter indicates the wait time for Jenkins in seconds. - If Jenkins is very slow in responding and the API response is not as expected, this wait time can be increased.
- It is required when multiple running builds must be aborted before starting a new API build.
jenkins_host_port YES NA This parameter's format is <Jenkins host>:<Jenkins port>.For example,curl --request POST http://10.123.154.163:30427/job/Policy-NewFeatures/buildWithParameters --user policyapiuser:111ad02d7471cec9ca689696e9c7a55c62 --verbose
Starting a Job Forcibly using Custom API
If another job is already running and has not been started by an API user, the running job is aborted, along with all other jobs in the queue that have not been started by an API user, and a new job is started.
If the running job is started by the API user, the new job does not start, and the start job request fails, returning a message in response: Build <job_id> of pipeline <pipeline_name> is already running, triggered by an API user.
Builds are aborted gracefully by a forceful API, such as when a running scenario completes its execution and cleanup before the corresponding build is aborted.
The forceful API now returns an
aborted-builds parameter in response, which contains job IDs
for all the aborted builds. It also returns a parameter called
cancelled_builds_in_queue, which contains queue IDs for all the
builds aborted in queue.
If a job ID is assigned to a build in queue, it contains a list of two values: [queueid, jobid] rather than just the queue ID.
Run the following command to start a job forcibly:
curl -s --request POST <Startjob_host_port>/build -H "Content-Type: application/json" –d
      '{"jenkins_host_port": "<Jenkins_host_port>", "pipelineName": "<Pipeline_name>",
      "pageAndQuery": "<pageAndQuery>", "userName": "<username>", "token":
"<API_token>"}' --verbosecurl --request POST 10.123.154.163:31423/build -H "Content-Type: application/json" –d
'{"jenkins_host_port": "10.123.154.163:30427", "pipelineName": "Policy-NewFeatures",
"pageAndQuery": "buildWithParameters", "userName": "policyapiuser", "token":
"111ad02d7471cec9ca689696e9c7a55c62"}' --verboseNote:
- Jenkins port (8080) with its nodeport
- StartAPI port (5001) with its nodeport
Customizing Job Parameters
paramx=valuex.
- Append
paramx=valuetobuildWithParameters?.Example 1,
curl --request POST 10.75.217.40:31378/job/Policy-NewFeatures/buildWithParameters?paramx=valuex --user
      policyapiuser:110ed65222b9e63445689314998ff8c3bk -- verbose
Example 2,
curl --request POST 10.75.217.4:32476/build -H "Content-Type: application/json" -d '{"jenkins_host_port": "10.75.217.40:31378", "pipelineName": "Policy-NewFeatures", "pageAndQuery": "buildWithParameters?paramx=valuex", "userName": "policyapiuser", "token": "110ed65222b9e63445689314998ff8c3bk"}' –verbose - To add more than 1 parameter, such as
paramx=valuexandparamy=valuey, append the other parameters to the API call using&.Example 1,
curl --request POST 10.75.217.40:31378/job/Policy-NewFeatures/buildWithParameters?paramx=valuex¶my=valuey --user policyapiuser:110ed65222b9e63445689314998ff8c3bk -- verboseExample 2,
curl --request POST 10.75.217.4:32476/build -H "Content-Type: application/json" -d '{"jenkins_host_port": "10.75.217.40:31378", "pipelineName": "Policy-NewFeatures", "pageAndQuery": "buildWithParameters?paramx=valuex¶my=valuey", "userName": "policyapiuser", "token": "110ed65222b9e63445689314998ff8c3bk"}' --verbose - Replace
buildWithParameters?withbuildfor non-parametrized pipeline jobs. - Start the pipeline by using the default Jenkins API or by
changing the pageAndQuery parameter's value to build in the following
way:
curl --request POST <Jenkins_host_port>/job/<Pipeline_name>/build --user <username>:<API_token> --verboseExample 1,
curl --request POST 10.75.217.40:31378/job/Policy-NewFeatures/build --user policyapiuser:110ed65222b9e63445689314998ff8c3bk --
      verbose
Example 2,
curl --request POST 10.75.217.4:32476/build -H "Content-Type: application/json" -d '{"jenkins_host_port": "10.75.217.40:31378",
      "pipelineName": "Policy-NewFeatures", "pageAndQuery": "build", "userName": "policyapiuser", "token":
      "110ed65222b9e63445689314998ff8c3bk"}' –verbose
2.1.2.2 Monitoring Jobs
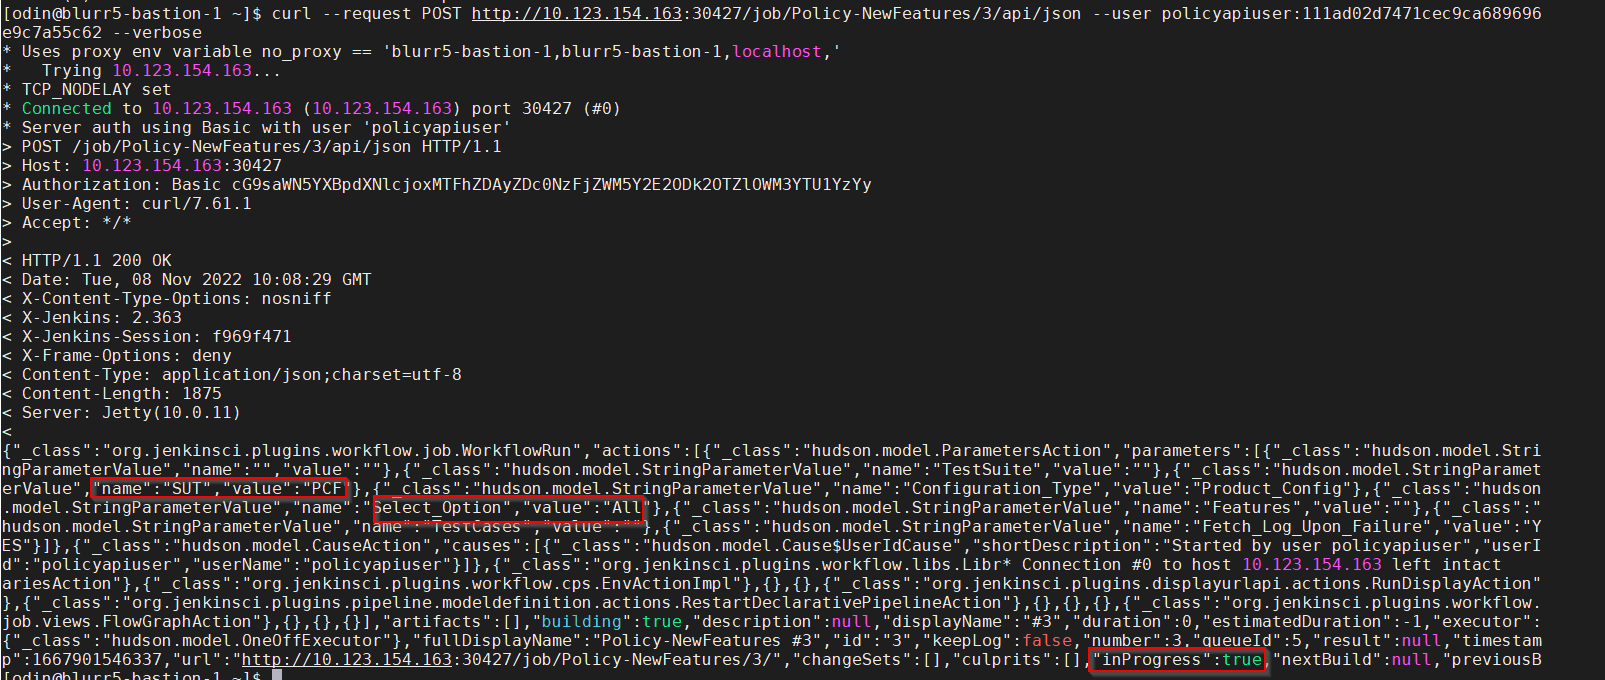
This Default Jenkins API is used to monitor the progress of the job that was started.
- A qid is obtained from the Location header in the
response for
starting a job. The first API uses this qid to get queue status about the corresponding job, including its job_id. - The second API uses the job_id to obtain further information about the job status.
curl --request POST
                            <Jenkins_host_port>/queue/item/<qid>/api/json --user
                            <username>:<API_token> --verbose
For example,curl --request POST http://10.123.154.163:30427/queue/item/5/api/json--user policyapiuser:111ad02d7471cec9ca689696e9c7a55c62 --verbosecurl --request POST <Jenkins_host_port>/job/<Pipeline_name>/<job_id>/api/json --user <username>:<API_token> --verboseFor example,curl --request POST http://10.123.154.163:30427/job/Policy-NewFeatures/3/api/json--user policyapiuser:111ad02d7471cec9ca689696e9c7a55c62 --verbose
Figure 2-6 Monitoring a Job
2.1.2.3 Stopping Jobs
Stop API is used to stop the currently running job using its job_id. It is also a default Jenkins API.
Stopping a Job
curl --request POST
      <Jenkins_host_port>/job/<Pipeline_name>/<job_id>/stop  --user <username>:<API_token>
--verbosecurl --request POST http://10.75.217.4:31881/job/UDR-Regression/21/stop --user
udrapiuser:1139a72213e0a686972cbff4a2f9333a9f --verboseNote:
- If the rerun count is greater than zero, the job must be stopped twice.
- This Stop API call does not abort the build gracefully.
curl --request POST
      <Stopjob_host_port>/job/<Pipeline_name>/<job_id>/stop  --user <username>:<API_token>
--verbosecurl --request POST http://10.75.217.4:32476/job/UDR-Regression/21/stop --user
udrapiuser:1139a72213e0a686972cbff4a2f9333a9f --verboseTable 2-3 Stop API Details
| Parameter | Mandatory | Default Value | Description |
|---|---|---|---|
| userName | Yes | NA | Name of API user |
| token | Yes | NA | The API token for the API user |
| Stopjob_host_port | Yes | NA | Format is <host>:<port>
|
| pipelineName | Yes | NA | Name of the pipeline for which build is to be stopped |
| immediate | No | False | To stop the build immediately, send a query
parameter ("immediate=true") with API call.
For
example,
|
2.1.2.4 Getting Test Suite Artifacts
Default Jenkins API is used to get the JUNIT-formatted XML test result files for a completed test suite.
- For getting an overall build summary
- For getting a JUNIT XML test result file for every feature file that ran
curl --request POST <Jenkins_host_port>/job/<Pipeline_name>/<job_id>/testReport/api/xml?exclude=testResult/suite --user <username>:<API_token> --verbosecurl --request POST http://10.123.154.163:30427/job/Policy-NewFeatures/4/testReport/api/xml?exclude=testResult/suite--user policyapiuser:111ad02d7471cec9ca689696e9c7a55c62 --verboseFor getting Feature-wise XML, Select_Option = All:
curl --request POST
      <Jenkins_host_port>/job/<Pipeline_name>/<job_id>/artifact/test-results/reports/*zip*/test-results.zip
--user <username>:<API_token> --verbose --output test-results.zipcurl --request POST http://
10.75.217.4:31881/job/Policy-NewFeatures/21/artifact/test-results/reports/*zip*/test-results.zip --user policyapiuser:11c3344996c4fda01ded2124bec4f9aa17
--verbose –-output test-results.zipFor getting Feature-wise XML, Select_Option = Single/MultipleFeatures:
curl --request POST
      <Jenkins_host_port>/job/<Pipeline_name>/<job_id>/artifact/test-results/reports/
      *.<Feature1_name>.xml,*.<Feature2_name>.xml/*zip*/test-results.zip  --user <username>:<API_token>
--verbose --output test-results.zipcurl --request POST http://
10.75.217.4:31881/job/Policy-NewFeatures/21/artifact/test-results/reports/*.goldenfeature.xml,*.AMPolicy.xml/*zip*/test-results.zip
–user policyapiuser:11c3344996c4fda01ded2124bec4f9aa17 --verbose --output test-results.zipAPI calls for Select_Option = All and Select_Option =
Single/MultipleFeatures return a zip file with JUNIT XMLs, one XML for
each feature.
Figure 2-7 Sample XML Output for AMPolicy.feature

In the API call, specify other selected features in comma-separated form
as
/*<Feature1_name>.xml,*<Feature2_name>.xml,*<Feature3_name>.xml,*<Feature4_name>.xml/
for Select_Option = Single/MultipleFeatures.
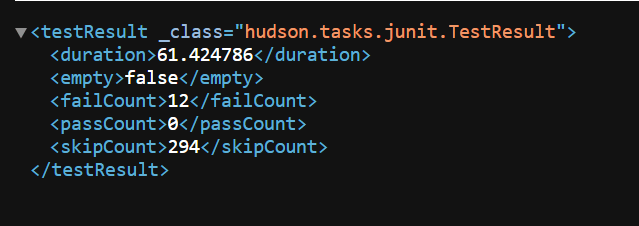
duration, failCount, passCount, and
skipCount for the current build.
Figure 2-8 Sample Output
It is recommended to maintain a gap of at least a few seconds between two API calls. This gap depends on the time Jenkins takes to complete the API request.
2.2 ATS Health Check
ATS Health Check functionality is to check the health of the System Under Test (SUT)
Earlier, ATS used Helm test functionality to check the health of the System Under Test (SUT). With the implementation of the ATS Health Check pipeline, the SUT health check process has been automated. ATS health checks can be performed on webscale and non-webscale environments.
Convert a Value in Base64
echo-n "value"| base64echo-n "126.98.76.43"| base64Deploying ATS Health Check in a Webscale Environment
- Set the Webscale to 'true' and the following parameters by encoding them with base64 in the ATS values.yaml file:
- Set the following parameter to encrypted
data:
webscalejumpserverip: encrypted-data
webscalejumpserverusername: encrypted-data
webscalejumpserverpassword: encrypted-data
webscaleprojectname: encrypted-data
webscalelabserverFQDN: encrypted-data
webscalelabserverport: encrypted-data
webscalelabserverusername: encrypted-data
webscalelabserverpassword: encrypted-data
Encrypted data is the value of parameters encrypted in base64. Fundamentally, Base64 is used to encode the parameters.
For example:
webscalejumpserverip=$(echo -n '10.75.217.42' | base64), Where Webscale Jump server ip needs to be provided
webscalejumpserverusername=$(echo -n 'cloud-user' | base64), Where Webscale Jump server Username needs to be provided
webscalejumpserverpassword=$(echo -n '****' | base64), Where Webscale Jump server Password needs to be provided
webscaleprojectname=$(echo -n '****' | base64), Where Webscale Project Name needs to be provided
webscalelabserverFQDN=$(echo -n '****' | base64), Where Webscale Lab Server FQDN needs to be provided
webscalelabserverport=$(echo -n '****' | base64), Where Webscale Lab Server Portneeds to be provided
webscalelabserverusername=$(echo -n '****' | base64), Where Webscale Lab Server Username needs to be provided
webscalelabserverpassword=$(echo -n '****' | base64), Where Webscale Lab Server Password needs to be provided
Running ATS Health Check Pipeline in an Webscale Environment
- Log in to ATS using respective <NF> login credentials.
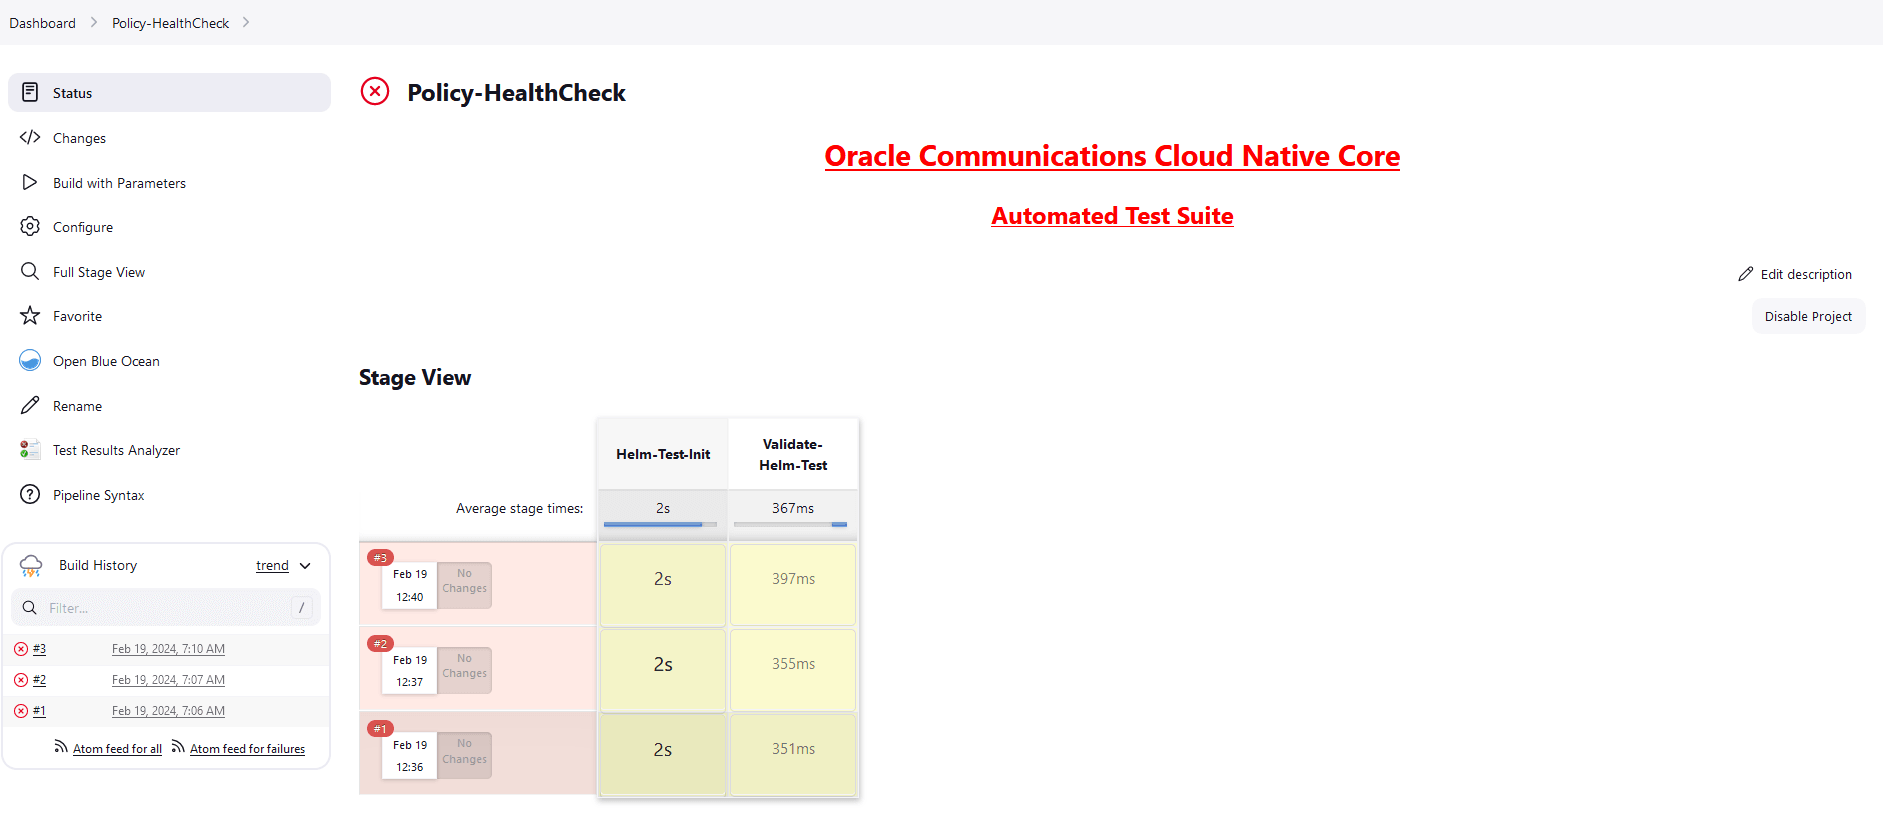
- Click <NF>HealthCheck pipeline and then click
Configure.
Note:
<NF> denotes the network function. For example, in Policy, it is called as Policy-HealthCheck pipeline.Figure 2-9 Configure Healthcheck
- Provide parameter a with Helm
release name deployed. If there are multiple releases, use comma to provide
all Helm release
names.
//a = helm releases [Provide Release Name with Comma Separated if more than 1 ]Provide parameter c with the appropriate Helm command, such as helm, helm3, or helm2.
//c = helm command name [helm or helm2 or helm3]Figure 2-10 Save the Changes
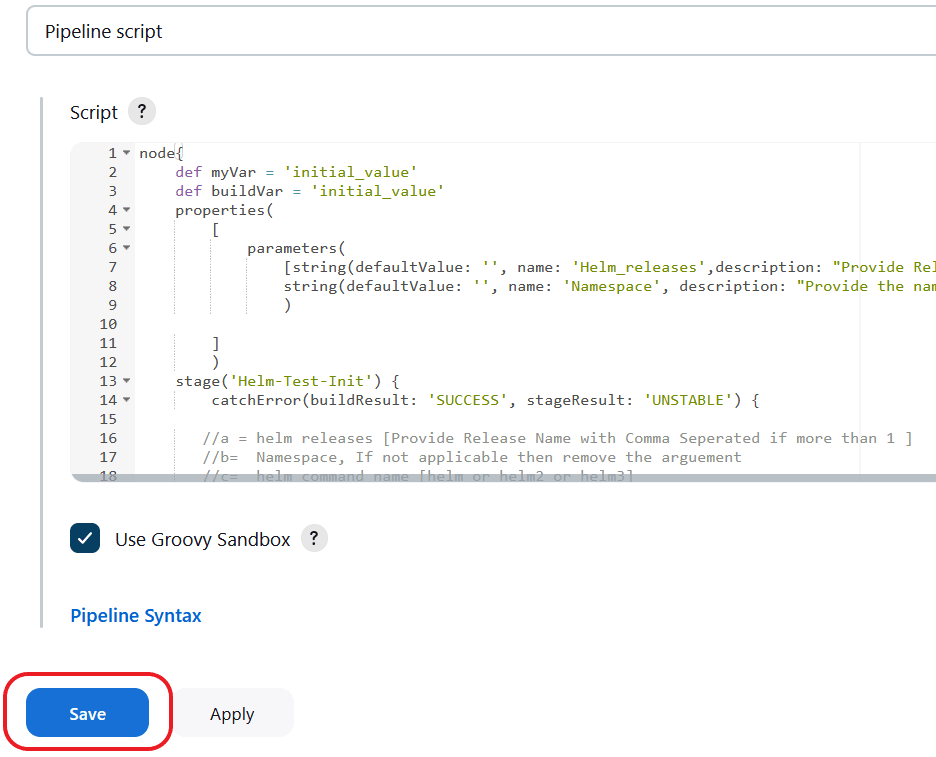
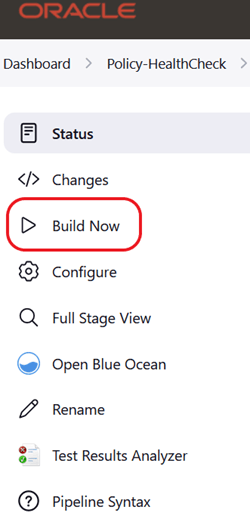
- Save the changes and click Build Now. ATS runs the
health check on respective network function.
Figure 2-11 Build Now
Deploying ATS Health Check Pipeline in an OCI Environment
To use a ssh private key, create healthcheck-oci-secret and set the value of the key "passwordAuthenticationEnabled" to false.
Creating healthcheck-oci-secret
kubectl create secret generic healthcheck-oci-secret --from-file=bastion_key_file='<path of bastion ssh private key file>' --from-file=operator_instance_key_file='<path of operator instance ssh private key file>' -n <ATS namespace>kubectl create secret generic healthcheck-oci-secret --from-file=bastion_key_file='/tmp/bastion_private_key' --from-file=operator_instance_key_file='/tmp/operator_instance_private_key' -n seppsvcNote:
- Maintain the name of the secret as "healthcheck-oci-secret".
- Ensure that the '--from-file' keys retain the same names: "bastion_key_file" and "operator_instance_key_file".
- If the SSH private key is identical for both the bastion and operator instance, you can use the same path for both in the secret creation command.
Perform the following procedure to deploy ATS Health Check in a OCI environment:
- To use password, provide base64 encoded values for key "password" for both bastion and operator instances, and set the value of key passwordAuthenticationEnabled to "true".
- Set the following parameter to encrypted data:
envtype: encrypted-data
ociHealthCheck:
  passwordAuthenticationEnabled: true or false
  bastion:
    ip: encrypted-data
    username: encrypted-data
    password: encrypted-data
  operatorInstance:
    ip: encrypted-data
    username: encrypted-data
    password: encrypted-data
Note:
All fields are mandatory except for passwords. When the "passwordAuthenticationEnabled" field is set to true, only the "password" field needs to be updated; otherwise, it can remain with its default value.
Running ATS Health Check Pipeline in an OCI Environment
- Log in to ATS using respective <NF> login credentials.
- Click <NF>HealthCheck pipeline and then click
Configure.
Note:
<NF> denotes the network function. For example, in Policy, it is called as Policy-HealthCheck pipeline.Figure 2-12 Configure Healthcheck

- Provide parameter a with Helm
release name deployed. If there are multiple releases, use comma to provide
all Helm release
names.
//a = helm releases [Provide Release Name with Comma Separated if more than 1 ]Provide parameter c with the appropriate Helm command, such as helm, helm3, or helm2.
//c = helm command name [helm or helm2 or helm3]Figure 2-13 Save the Changes

- Save the changes and click Build Now. ATS runs the
health check on respective network function.
Figure 2-14 Build Now

Deploying ATS Health Check in a Non-Webscale or Non-OCI Environment
Perform the following procedure to deploy ATS Health Check in a non-webscale or non-OCI environment such as OCCNE:
Set the Webscale parameter set to 'false' and following parameters by encoding it with base64 in the ATS values.yaml file:
occnehostip: encrypted-data
occnehostusername: encrypted-data
occnehostpassword: encrypted-data
Example:
occnehostip=$(echo -n '10.75.217.42' | base64) , Where occne host ip needs to be provided
occnehostusername=$(echo -n 'cloud-user' | base64), Where occne host username needs to be provided
occnehostpassword=$(echo -n '****' | base64), Where password of host needs to be provided
Running ATS Health Check Pipeline in a Non-Webscale or Non-OCI Environment
Perform the following procedure to run the ATS Health Check pipeline in a non-webscale or non-OCI environment such as OCCNE:
- Log in to ATS using respective <NF> login credentials.
- Click <NF>HealthCheck pipeline and then click Configure.
- Provide parameter a with Helm
release name deployed. If there are multiple releases, use comma to provide
all Helm release names.
Provide parameter b with SUT deployed namespace name.
Provide parameter c with the appropriate Helm command, such as helm, helm3, or helm2.
//a = helm releases [Provide Release Name with Comma Separated if more than 1 ]
//b = Namespace, If not applicable to WEBSCALE environment then remove the argument
//c = helm command name [helm or helm2 or helm3]
Figure 2-15 Save the Changes

- Save the changes and click Build Now. ATS runs the
health check on respective network function.
Figure 2-16 Build Now

By clicking Build Now, you can run the health check on ATS and store the result in the console logs.
2.3 ATS Jenkins Job Queue
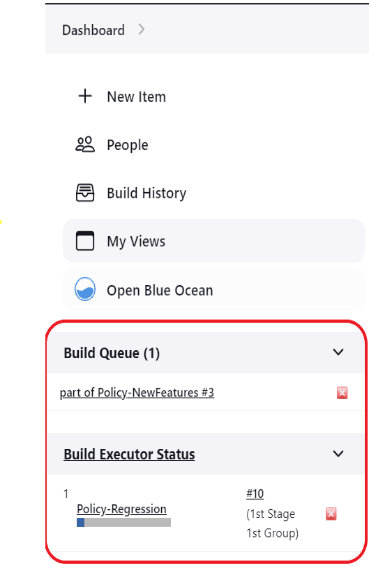
The ATS Jenkins Job Queue feature places the second job in a queue if the current job is already running from the same or different pipelines to prevent jobs from running in parallel to one another.
Figure 2-17 Build Executor Status
2.4 Application Log Collection
Using Application Log Collection, you can debug a failed test case by collecting the application logs for NF System Under Test (SUT). Application logs are collected for the duration that the failed test case was run.
Application Log Collection can be implemented by using ElasticSearch or Kubernetes Logs. In both these implementations, logs are collected per scenario for the failed scenarios.
Application Log Collection Using ElasticSearch
- Log in to ATS using respective <NF> login credentials.
- On the NF home page, click any new feature or regression pipeline, from where you want to collect the logs.
- In the left navigation pane, click Build with Parameters.
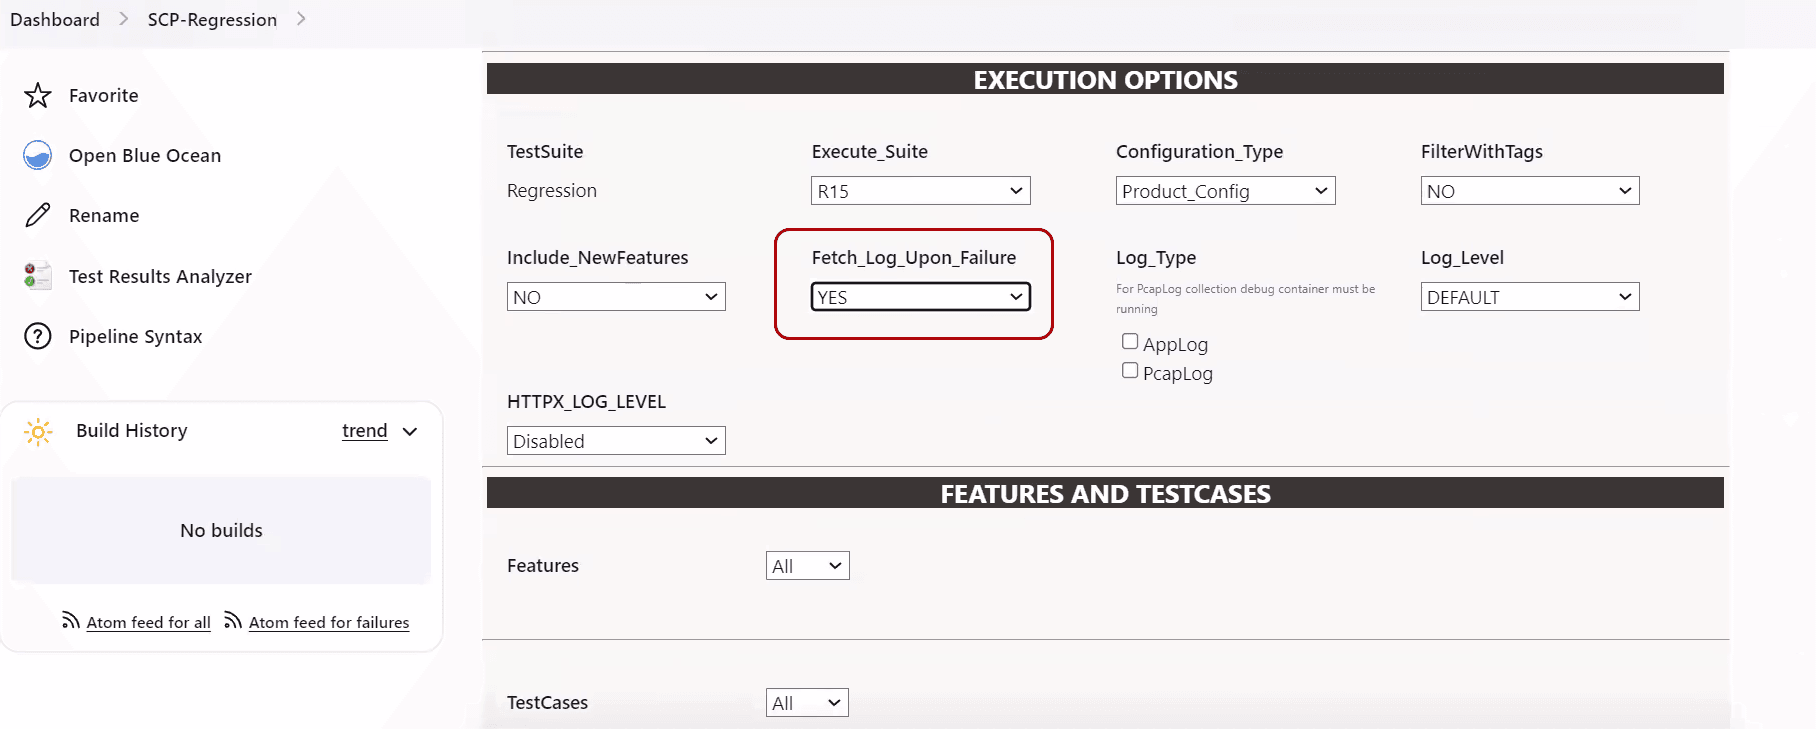
- Select YES or NO from the drop-down menu of
Fetch_Log_Upon_Failure to select whether the log
collection is required for a particular run.
Figure 2-18 Fetch_Log_Upon_Failure
- If option Log_Type is also available, select value AppLog for it.
- Select the Log Level from the drop-down menu of Log_Level to set the log
level for all the microservices. The possible values for Log_Level are as
follows:
- WARN: Designates potentially harmful situations.
- INFO: Designates informational messages that highlight the progress of the application at coarse-grained level.
- DEBUG: Designates fine-grained informational events that are most useful to debug an application.
- ERROR: Designates error events that might still allow the application to continue running.
- TRACE: The TRACE log level captures all the details
about the behavior of the application. It is mostly diagnostic and
is more granular and finer than DEBUG log level.
Note:
Log_Level values are NF dependent.
- After the build execution is complete, go into the ATS pod,
then navigate to following path to find the
applogs:
.jenkins/jobs/<Pipeline Name>/builds/<build
                            number>/
For example,
.jenkins/jobs/SCP-Regression/builds/5/Applogs is present in zip form. Unzip it to get the log files.
The following tasks are carried out in the background to collect logs:
- ElasticSearch API is used to access and fetch logs.
- Logs are fetched from ElasticSearch for the failed scenarios
- Hooks (after scenario) within the cleanup file initiate an API call to Elasticsearch to fetch Application logs.
- Duration of the failed scenario is calculated based on the time stamp and passed as a parameter to fetch the logs from ElasticSearch.
- Filtered query is used to fetch the records based on Pod name, Service name, and timestamp (Failed Scenario Duration).
- For ElasticSearch, there is no rollover or rotation of logs over time.
- The maximum records that the ElasticSearch API can fetch per microservice in a failed scenario is limited to 10K.
- The following configuration parameters are used for collecting logs using
Elastic Search:
- ELK_WAIT_TIME: Wait time to connect to Elastic Search
- ELK_HOST: Elastic Search HostName
- ELK_PORT: Elastic Search Port
Application Log Collection Using Kubernetes Logs
- On the NF home page, click any new feature or regression pipeline, from where you want to collect the logs.
- In the left navigation pane, click Build with Parameters.
- Select YES or NO from the drop-down menu of Fetch_Log_Upon_Failure to select whether the log collection is required for a particular run.
- Select the Log Level from the drop-down menu of Log_Level to
set the log level for all the microservices. The possible values for
Log_Level are as follows:
- WARN: Designates potentially harmful situations.
- INFO: Designates informational messages that highlight the progress of the application at coarse-grained level.
- DEBUG: Designates fine-grained informational events that are most useful to debug an application.
- ERROR: Designates error events that might still allow
the application to continue running.
Note:
Log_Level values are NF dependent.
The following tasks are carried out in the background to collect logs:
- Kube API is used to access and fetch logs.
- For failed scenarios, logs are directly fetched from microservices.
- Hooks (after scenario) within the cleanup file initiate an API call to Elasticsearch to fetch Application logs.
- The duration of the failed scenario is calculated based on the time stamp and passed as a parameter to fetch the logs from microservices.
- Logs roll can occur while fetching the logs for a failed scenario. The maximum loss of logs is confined to a single scenario.
2.4.1 Application Log Collection and Parallel Test Execution Integration
A new stage,"Logging/Rerun", has been added at the end of the Execute-Tests stage to collect rerun logs, such as applog and PCAP logs, by running the failed test cases in a sequence.
Figure 2-19 Logging/Rerun new stage

Fetch_Log_Upon_Failure parameter is set to YES and if any
test case fails in the initial run, then:
- The failed test case reruns and log collection start in the Logging/Rerun stage after the initial run is completed for all the test cases.
- The logs from the initial execution are collected, but they might be incorrect.
- Even if the
rerunparameter is set to 0, the failed test case reruns in the Logging/Rerun stage and the log is collected. - If the
Fetch_Log_Upon_Failureparameter is set to NO and if any test case fails in the initial run, then the failed test case rerun starts in the same stage after the initial execution is over for all the test cases in its group.
2.5 ATS Maintenance Scripts
- Taking a backup of the ATS custom folders and Jenkins pipeline.
- Viewing the configuration and restoring the Jenkins pipeline.
- Viewing the configuration and installing or uninstalling ATS and stubs.
ATS maintenance scripts are present in the ATS image at the
following path: /var/lib/jenkins/ocats_maint_scripts
kubectl cp <NAMESPACE>/<POD_NAME>:/var/lib/jenkins/ocats_maint_scripts <DESTINATION_PATH_ON_BASTION> podkubectl cp ocpcf/ocats-ocats-policy-694c589664-js267:/var/lib/Jenkins/ocats_maint_scripts /home/meta-user/ocats_maint_scripts pod2.5.1 ATS Scripts
ATS maintenance scripts are used to perform various task related to ATS and Jenkin pipeline.
- ats_backup.sh: This script requires the user's input and
takes a backup of the ATS custom folders, Jenkins jobs, and user's folders on
the user's system. The backup can be of the Jenkins jobs and user's folder, the
custom folders, or both. The custom folders include cust_regression,
cust_newfeatures, cust_performance, cust_data, and custom_config. For a Jenkins
job or a user's folder, the script only takes a backup of the config.xml file.
Also, the script requires the user to store a backup on the user's system (the
default path is the location from where the script is being run) and to create a
backup folder on the system and take the backup of the chosen folder from the
corresponding ATS into the backup folder. The backup folder name can be of the
following notation:
ats_<version>_backup_<date>_<time>. - ats_uninstall.sh: This script requires the user's input and uninstalls the corresponding ATS.
- ats_install.sh: This script requires the user's input and
installs a new ATS. If PVEnabled is set to
true, the script also reads the PVC name
from values.yaml and creates values.yaml before installation. Also, if needed,
the script performs the postinstallation steps, such as copying tests and
Jenkins jobs' folders from the
ats_datatar file to the ATS pod when PV is deployed, and then restarts the pod. - ats_restore.sh: This script requires the user's inputs,
restores the new release ATS pipeline, and views the configuration by referring
to the last release ATS Jenkins jobs and the user's configuration. It depends on
the user whether to use the backup folders from the user's system to restore the
ATS configuration. If the user instructs the script to use the backup from the
system, the script requires the path of the backup and uses the backup to
restore. Otherwise, the script requires the last ATS Helm release name to refer
to its Jenkins jobs and the user's configuration to restore.
The script refers to the last release of ATS Jenkins pipelines and sets the Discard old builds property if this property is set in the last release of ATS for a pipeline but not in the current release. If this property is set in both releases, the script just updates the values according to the last release. Also, the script restores the pipeline environment variables values as per the last release of ATS. If any custom pipeline (created by the user) was present in the last release of ATS, the script restores that as well. It also restores the extra views created by NF users, for example, policy users, SCP users, and NRF users. Moreover, the script displays messages about the pending configuration that the user needs to perform manually. For example, a new pipeline or a new environment variable (for a pipeline) is introduced in the new release.
While deploying ATS without PV, Jenkins needs to be restarted for the restore process to complete. If the last release ATS contains the Configuration_Type parameter, the Configuration_Type script needs to be approved with the In Process Script Approval setting under Manage ATS in Jenkins for the restore process to complete.
2.5.2 Updating ats_install.sh
Currently, the ats_install.sh script copies the tests folder and Jenkins jobs folder into the ATS pod and then restarts the pod when deployed with PV.
How to Update ats_install.sh
Other NFs can also use the ats_install.sh scripts. However, additional post installation steps may have to be performed manually for a few NFs.
- In the ats_install.sh script,
there is a post install section between ####POST_INSTALL_START#### and ####
POST_INSTALL_END ####.
- Add the required post install commands.
Note:
These commands are NF-specific. - Use the following commands:
$namespacefor the namespace value$pod_namefor the pod name$ats_data_pathfor theats_datafolder path (it has tests folder and Jenkins jobs folder provided as tar file in ATS package)
- In the if-else block related to whether PV is enabled
or not, add the following:
- Add a command specific to PVEnabled=true in the if block.
- Add a command specific to PVEnabled=false in the else block.
- Add the required post install commands.
- For additional inputs, enter the required code between #### INPUT_START #### and #### INPUT_END ####.
2.5.3 Restarting Jenkins without Restarting Pod
Perform the following procedure to restart Jenkins without restarting pods:
- Log in as the Jenkins admin.
- Go to the
<Jenkins_IP>:<port>/safeRestart, for example,10.87.73.32:32156/safeRestart.Figure 2-20 Safe Restart

- Click Yes.
Figure 2-21 Restart Jenkins

2.5.4 Updating Stub Scripts
- stub_uninstall.sh: This script requires the user's inputs and uninstalls all the stubs.
- stub_install.sh: This script requires the user's inputs and installs all the stubs.
Note:
Currently, stub_uninstall.sh and stub_install.sh work.- Go to the
stubfolder. - From each script:
- Remove the CNC Policy-specific stubs inputs (dns, amf, and ldap), and add the input code blocks for NRF-specific stubs.
- For the stubs to uninstall, change the value of the
stubUninstallList variable,
and delete the variables for the CNC Policy-specific stubs below it.
Note:
stubUninstallList contains the Helm release names of the common stubs that are deployed generally. - Declare the variables for the NRF-specific stubs below the stubUninstallList line.
- Remove the Helm uninstallation commands of the policy-specific stubs, and add the Helm uninstallation commands of the NRF-specific stubs.
- For the stubs to install, change the value of the
stubInstallList variable, and
delete the variables for the CNC Policy-specific stubs below it.
Note:
stubInstallList contains the Helm release names of the common stubs that are deployed generally. - Declare the variables for the NRF-specific stubs below the stubInstallList line.
- Remove the Helm installation commands of the CNC Policy-specific stubs, and add the Helm installation commands of the NRF-specific stubs.
2.5.5 Running ATS and Stub Deployment Scripts
Perform the following procedure to run ATS and stub deployment scripts:
Note:
If you want to take a backup of the custom folders or Jenkins jobs and user's configuration or both, run the ats_backup.sh script.- Run the ats_install.sh script to install the new release ATS (values.yaml of the ATS Helm chart must be updated before this step).
- Run the ats_restore.sh script to
restore the new ATS pipeline and view configuration.
Note:
- You might perform the manual steps required for the restore script.
- You must copy all the necessary changes to the new release ATS from the last release ATS. To get the changes in the last release, you must refer to the custom folders in the last release ATS backup on the system with an existing backup using ats_backup.sh before this step.
- You can remove the last release ATS pod using the ats_uninstall.sh script while continuing to retain the last release PVC. You can use the last release PVC to port backward. Delete the last release PVC when you do not require the backward porting.
- Run the stub_install.sh script to install all the new release stubs values.yaml of the stub Helm charts must be updated before this step.
- Run the stub_uninstall.sh script to uninstall all the last release stubs.
2.6 ATS System Name and Version Display on the ATS GUI
This feature displays the ATS system name and version on the ATS GUI.
- ATS system name: Abbreviated product name followed by NF name.
- ATS Version: Release version of ATS.
Figure 2-22 ATS System Name and Version

2.7 ATS Tagging Support
The ATS Tagging Support feature assists in running the feature files after filtering features and scenarios based on tags. Instead of manually navigating through several feature files, the user can save time by using this feature.
- Feature_Include_Tags: The features that contain either of the tags
available in the Feature_Include_Tags field are
considered for tagging.
- For example, "cne-common", "config-server". All the features that have either "cne-common" or "config-server" tags are taken into consideration.
- Feature_Exclude_Tags: The features that contain neither of the tags
available in the Feature_Exclude_Tags field are
considered for tagging.
- For example, "cne-common","config-server". All the features that have neither "cne-common" nor "config-server" as tags are taken into consideration.
- Scenario_Include_Tags: The scenarios that contain either of the
tags available in the Scenario_Include_Tags field are
considered.
- For example, "sanity", "cleanup". The scenarios that have either "sanity" or "cleanup" tags are taken into consideration.
- Scenario_Exclude_Tags: The features that contain neither of the tags
available in the Scenario_Exclude_Tags field are
considered.
- For example, "sanity", "cleanup". The scenarios that have neither "sanity" nor "cleanup" as tags are taken into consideration.
Filter with Tags
- On the NF home page, click any new feature or regression pipeline, where you want to use this feature.
- In the left navigation pane, click Build with
Parameters. The following image appears.
Figure 2-23 Filter with Tags

- Select Yes under
FilterWithTags. The result shows four input
fields.
Figure 2-24 Types of Tags

The default value of FilterWithTags field is "No".
- The input fields serve as a search or filter, displaying all tags that match
the prefix entered. You can select one or multiple tags.
Figure 2-25 Tags Matching with Entered Prefix

- Select the required tags from the different tags list and click Submit.
The specified feature-level tags are used to filter out features that contain any one of the include tags and none of the exclude tags. Here, any or both the fields may be left empty. All features are automatically taken into consideration when both fields are empty.
The scenario level tags are used to filter out the scenarios from the features filtered above. Only scenarios with any of the include tags and none of the exclude tags are considered. Any or both fields can be empty. When both fields are empty, all the scenarios from the above filtered feature files are considered.
Note:
- If you select the Select_Option as 'All', all the displayed features and scenarios will run.
- If you select the Select_Option as 'Single/MultipleFeatures, it enables you to select some features, and only those features and respective scenarios are going to run.
2.7.1 Combination of Tags and their Results
The combination of tags and expected results are as follows.
Table 2-4 Result of Filtered Tags
| Feature_Include | Feature_Exclude | Scenario_Include | Scenario_Exclude | Results |
|---|---|---|---|---|
| - | - | - | - | All the features and scenarios are taken into consideration. |
| "abc","def" | - | - | - | Features with either "abc" or "def" tags and all scenarios from the filtered features are taken into consideration. |
| - | "abc","def" | - | - | All the features with neither "abc" nor "def" tags and all scenarios from the filtered features are taken into consideration. |
| - | - | "sanity","cne" | - | Scenarios with either "sanity" or "cne" tags and features having these scenarios are taken into consideration. |
| - | - | - | "sanity","cne" | Scenarios with neither "sanity" nor "cne" tags and features having these filtered scenarios are taken into consideration. |
| "abc","def" | "ghi" | - | - | Features with either "abc" or "def" tags but without the "ghi" tag and all scenarios from filtered features are taken into consideration. |
| "abc","def" | - | "sanity","cne" | - | Scenarios only with either "sanity" or "cne" tags and only features that contain these scenarios and have either "abc" or "def" as feature tags are taken into consideration. |
| "abc","def" | - | - | "sanity","cne" | Scenarios with neither "sanity" nor "cne" tags and only features that contain the filtered scenarios and have either "abc" or "def" feature tags are taken into consideration. |
| - | "ghi" | "sanity","cne" | - | Features without the "ghi" tag and scenarios with either "sanity" or "cne" tags from the filtered features are taken into consideration. |
| - | "ghi" | - | "sanity","cne" | Features without the "ghi" tag and scenarios without the "sanity" and "cne" tags from filtered features are taken into consideration. |
| - | - | "sanity","cne" | "cleanup" | Scenarios with either the "sanity" or "cne" tags and without the "cleanup" tag and features with filtered scenarios are taken into consideration. |
| "abc","def" | "ghi" | "sanity","cne" | - | Scenarios with either the "sanity" or "cne" tags and features that have these scenarios and have either the "abc" or "def" tags but not the "ghi" tag are taken into consideration. |
| "abc","def" | - | "sanity","cne" | "cleanup" | Scenarios with either the "sanity" or "cne" tags and without the "cleanup" tag, and features having the filtered scenarios and having the feature tags either "abc" or "def" are taken into consideration. |
| "abc","def" | "ghi" | - | "cleanup" | Scenarios without the tag "cleanup", and features with filtered scenarios and having either "abc" or "def" as feature tags but not the "ghi" tag are taken into consideration. |
| - | "ghi" | "sanity","cne" | "cleanup" | Scenarios with either the "sanity" or "cne" tags and without the "cleanup" tag, and features with filtered scenarios and not the tag "ghi," are taken into consideration. |
| "abc","def" | "ghi" | "sanity","cne" | "cleanup" | Scenarios with either "sanity" or "cne" tags and without the "cleanup" tag, and features with filtered scenarios and feature tags either "abc" or "def" but without the tag "ghi" are taken into consideration. |
Note:
The tags mentioned in the table are just examples; they may or may not be actually used.
2.8 Custom Folder Implementation
The Custom Folder Implementation feature allows the user to update, add, or delete test cases without affecting the original product test cases in the new features, regression, and performance folders. The implemented custom folders are cust_newfeatures, cust_regression, and cust_performance. The custom folders contain the newly created, customised test cases.
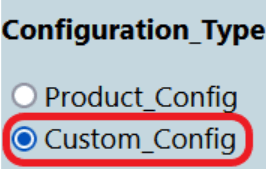
Initially, the product test case folders and custom test case folders will have the same set of test cases. The user can perform customization in the custom test case folders, and ATS always runs the test cases from the custom test case folders. If the option "Configuration_Type" is present on the GUI,the user needs to set its value to "Custom_Config" to populate test cases from the custom test case folders.
Figure 2-26 Custom Config Folder
- Separate folders such as cust_newfeatures, cust_regression, and cust_performance are created to hold the custom cases.
- The prepackaged test cases are available in the newfeature and regression Folder.
- The user copies the required test cases to the cust_newfeatures and cust_regression folders, respectively.
- Jenkins always points to the cust_newfeatures and cust_regression
folders to populate them in the menu.
If someone initially launches ATS, they will not see any test cases in the menu if the cust folders are not populated. To avoid this, it is recommended to prepopulate both the folders, cust and original, and ask the user to modify only the cust folder if needed.
Figure 2-27 Summary of Custom Folder Implementation

2.9 Single Click Job Creation
With the help of Single Click Job Creation feature, ATS users can easily create a job to run TestSuite with a single click.
2.9.1 Configuring Single Click Job
Prerequisite: The network function specific user should have 'Create Job' access.
Perform the following procedure to configure the single-click feature:
- Log in to ATS using network function specific log-in credentials..
- Click New Item in the left navigation pane of
the ATS application. The following page appears:
Figure 2-28 New Item Window
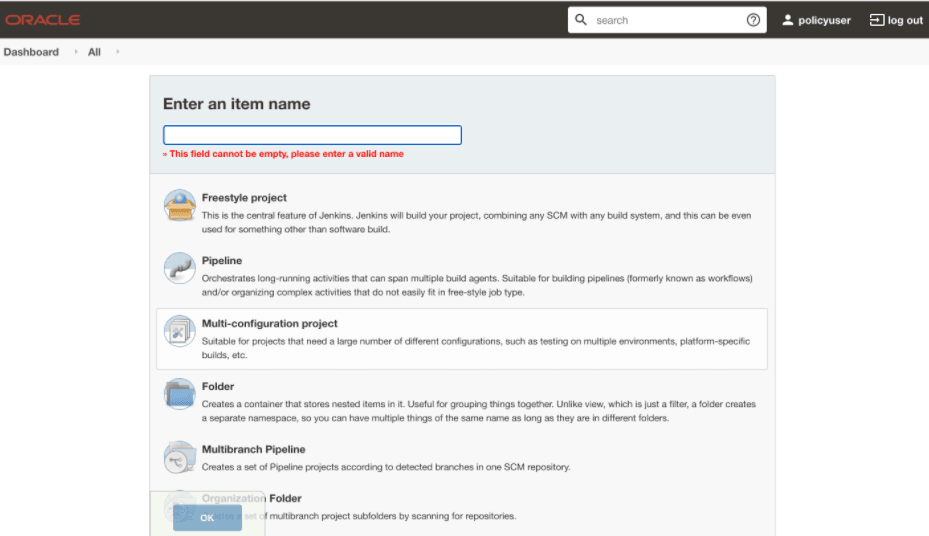
- In the Enter an item name text box, enter the job name. Example: <NF-Specific-name>-NewFeatures.
- In the Copy from text box, enter the actual job name for which you need single-click execution functionality. Example: <NF-Specific-name>-NewFeatures.
- Click OK. You are automatically redirected to edit the newly created job's configuration.
- Under the General group, deselect the This Project is Parameterised option.
- Under the Pipeline group, make the corresponding changes to remove the 'Active Choice Parameters' dependency.
- Provide the default values for the TestSuite,
SUT, Select_Option,
Configuration_Type, and other parameters, as required, on
the BuildWithParameters page.
Example: Pipeline without Active Choice Parameter Dependency
node ('built-in'){ //a = SELECTED_NF b = PCF_NAMESPACE c = PROMSVC_NAME d = GOSTUB_NAMESPACE //e = SECURITY f = PCF_NFINSTANCE_ID g = POD_RESTART_TIME h = POLICY_TIME //i = NF_NOTIF_TIME j = RERUN_COUNT k =INITIALIZE_TEST_SUITE l = STUB_RESPONSE_TO_BE_SET //m = POLICY_CONFIGURATION_ADDITION n = POLICY_ADDITION o = NEXT_MESSAGE //p = PROMSVCIP q = PROMSVCPORT r = TIME_INT_POD_DOWN s = POD_DOWN_RETRIES //t = TIME_INT_POD_UP u = POD_UP_RETRIES v = ELK_WAIT_TIME w = ELK_HOST //x = ELK_PORT y = STUB_LOG_COLLECTION z = LOG_METHOD A = enable_snapshot B = svc_cfg_to_be_read C = PCF_API_ROOT //Description of Variables: //SELECTED_NF : PCF //PCF_NAMESPACE : PCF Namespace //PROMSVC_NAME : Prometheus Server Service name //GOSTUB_NAMESPACE : Gostub namespace //SECURITY : secure or unsecure //PCF_NFINSTANCE_ID : nfInstanceId in PCF application-config config map //POD_RESTART_TIME : Greater or equal to 60 //POLICY_TIME : Greater or equal to 120 //NF_NOTIF_TIME : Greater or equal to 140 //RERUN_COUNT : Rerun failing scenario count //TIME_INT_POD_DOWN : The interval after which we check the POD status if its down //TIME_INT_POD_UP : The interval after which we check the POD status if its UP //POD_DOWN_RETRIES : Number of retry attempt in which will check the pod down status //POD_UP_RETRIES : Number of retry attempt in which will check the pod up status //ELK_WAIT_TIME : Wait time to connect to Elastic Search //ELK_HOST : Elastic Search HostName //ELK_PORT : Elastic Search Port //STUB_LOG_COLLECTION : To Enable/Disable Stub logs collection //LOG_METHOD : To select Log collection method either elasticsearch or kubernetes //enable_snapshot: Enable or disable snapshots that are created at the start and restored at the end of each test run //svc_cfg_to_be_read: Timer to wait for importing service configurations //PCF_API_ROOT: PCF_API_ROOT information to set Ingress gateway service name and port withEnv([ 'TestSuite=NewFeatures', 'SUT=PCF', 'Select_Option=All', 'Configuration_Type=Custom_Config' ]){ sh ''' sh /var/lib/jenkins/ocpcf_tests/preTestConfig-NewFeatures-PCF.sh \ -a PCF \ -b ocpcf \ -c occne-prometheus-server \ -d ocpcf \ -e unsecure \ -f fe7d992b-0541-4c7d-ab84-c6d70b1b0123 \ -g 60 \ -h 120 \ -i 140 \ -j 2 \ -k 0 \ -l 1 \ -m 1 \ -n 15 \ -o 1 \ -p occne-prometheus-server.occne-infra\ -q 80\ -r 30\ -s 5\ -t 30\ -u 5\ -v 0\ -w occne-elastic-elasticsearch-master.occne-infra\ -x 9200\ -y yes\ -z kubernetes\ -A no\ -B 15\ -C ocpcf-occnp-ingress-gateway:80\ ''' load "/var/lib/jenkins/ocpcf_tests/jenkinsData/Jenkinsfile-Policy-NewFeatures" } } - Click Save. The ATS application is ready to run TestSuite with 'SingleClick' using the newly created job.
2.10 Managing Final Summary Report, Build Color, and Application Log
This feature displays an overall execution summary, such as the total run count, pass count, and fail count.
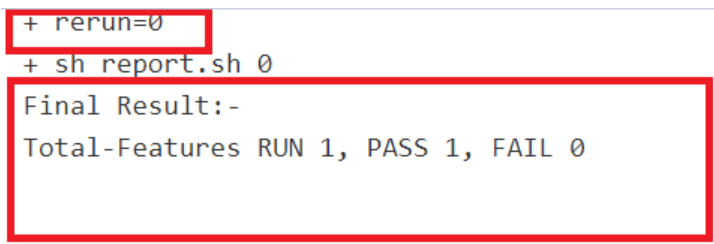
Supports Implementation of Total-Features- If rerun is set to 0, the test result report shows the following
result:
Figure 2-29 Total-Features = 1, and Rerun = 0
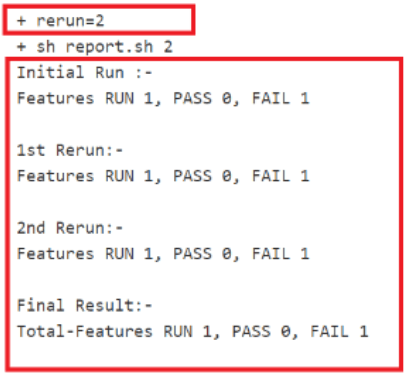
- If rerun is set to non-zero, the test result report shows the
following result:
Figure 2-30 Total-Features = 1, and Rerun = 2
After incorporating the Parallel Test Execution feature, the following results were obtained:
Final Summary Report Implementations
Figure 2-31 Group Wise Results
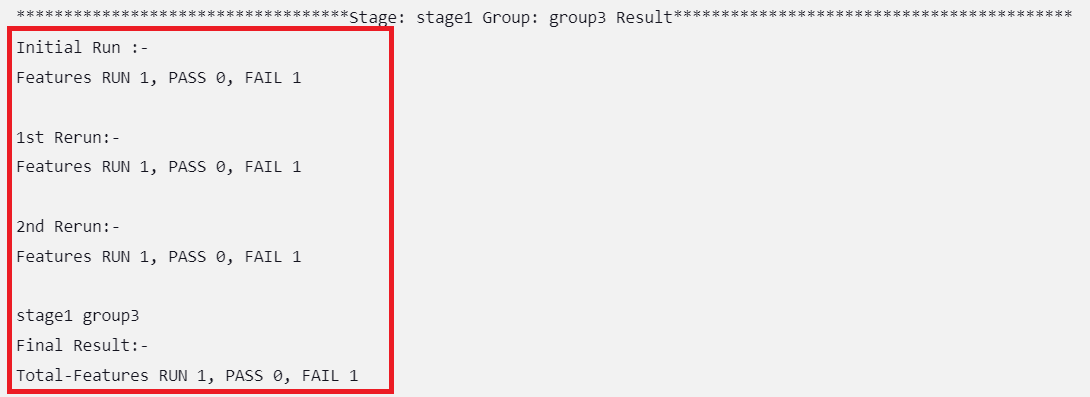
Figure 2-32 Overall Result When Selected Feature Tests Pass

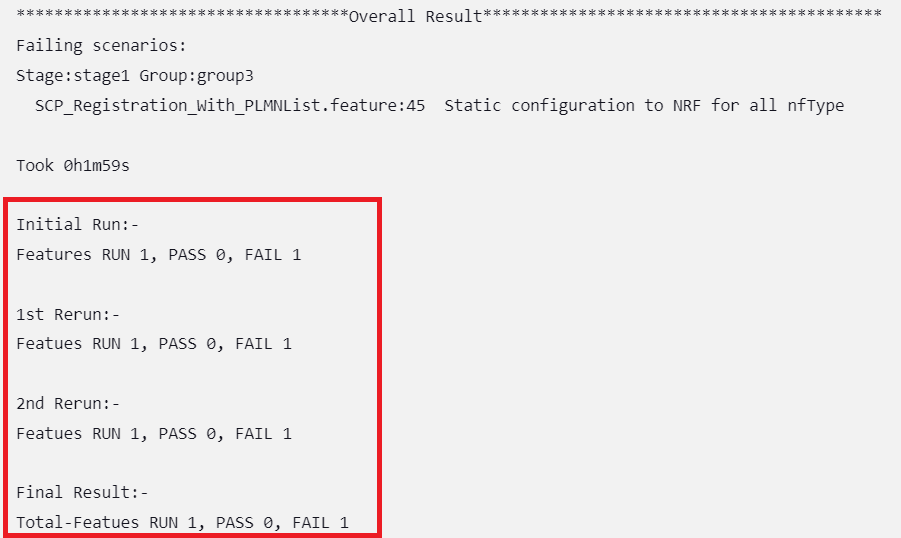
Figure 2-33 Overall Result When Any of the Selected Feature Tests Fail
Implementing Build Colors
Table 2-5 Build Color Details
| Rerun Values | Rerun set to zero | Rerun set to non-zero | |||
|---|---|---|---|---|---|
| Status of Run | All Passed in Initial Run | Some Failed in Initial Run | All Passed in Initial Run | Some Passed in Initial Run, Rest Passed in Rerun | Some Passed in Initial Run, Some Failed Even After Rerun |
| Build Status | SUCCESS | FAILURE | SUCCESS | SUCCESS | FAILURE |
| Pipeline Color | GREEN | Execution Stage where test cases failed shows YELLOW color, rest of the successful stages are GREEN. | GREEN | GREEN | Execution Stage where test cases failed shows YELLOW color, rest of the successful stages are GREEN |
| Status Color | BLUE | RED | BLUE | BLUE | RED |
- the rerun count and the pass or fail status of test cases in the initial run
- the rerun count and the pass or fail status of test cases in the final run
For the parallel test case execution, the pipeline status also depends
on another parameter, "Fetch_Log_Upon_Failure," which is given in the
build with parameters page. If the parameter
Fetch_Log_Upon_Failure is not there, its default value is
considered "NO".
Table 2-6 Pipeline Status When Fetch_Log_Upon_Failure = NO
| Rerun Values | Rerun set to zero | Rerun set to non-zero | |||
|---|---|---|---|---|---|
| Passed/Failed | All Passed in Initial Run | Some Failed in Initial Run | All Passed in Initial Run | Some Passed in Initial Run, Rest Passed in Rerun | Some Passed in Initial Run, Some Failed Even After Rerun |
| Status | SUCCESS | FAILURE | SUCCESS | SUCCESS | FAILURE |
Table 2-7 Pipeline Status When Fetch_Log_Upon_Failure = YES
| Rerun Values | Rerun set to zero | Rerun set to non-zero | ||||
|---|---|---|---|---|---|---|
| Passed/Failed | All Passed in Initial Run | Some Failed in Initial Run and Failed in Rerun | Some Failed in Initial Run and Passed in Rerun | All Passed in Initial Run | Some Passed in Initial Run, Rest Passed in Rerun | Some Passed in Initial Run, Some Failed Even After Rerun |
| Status | SUCCESS | FAILURE | SUCCESS | SUCCESS | SUCCESS | FAILURE |
rerun_count, Fetch_Log_Upon_Failure, and
pass/fail status of test cases in initial and final run and the
corresponding build colors are as follows:
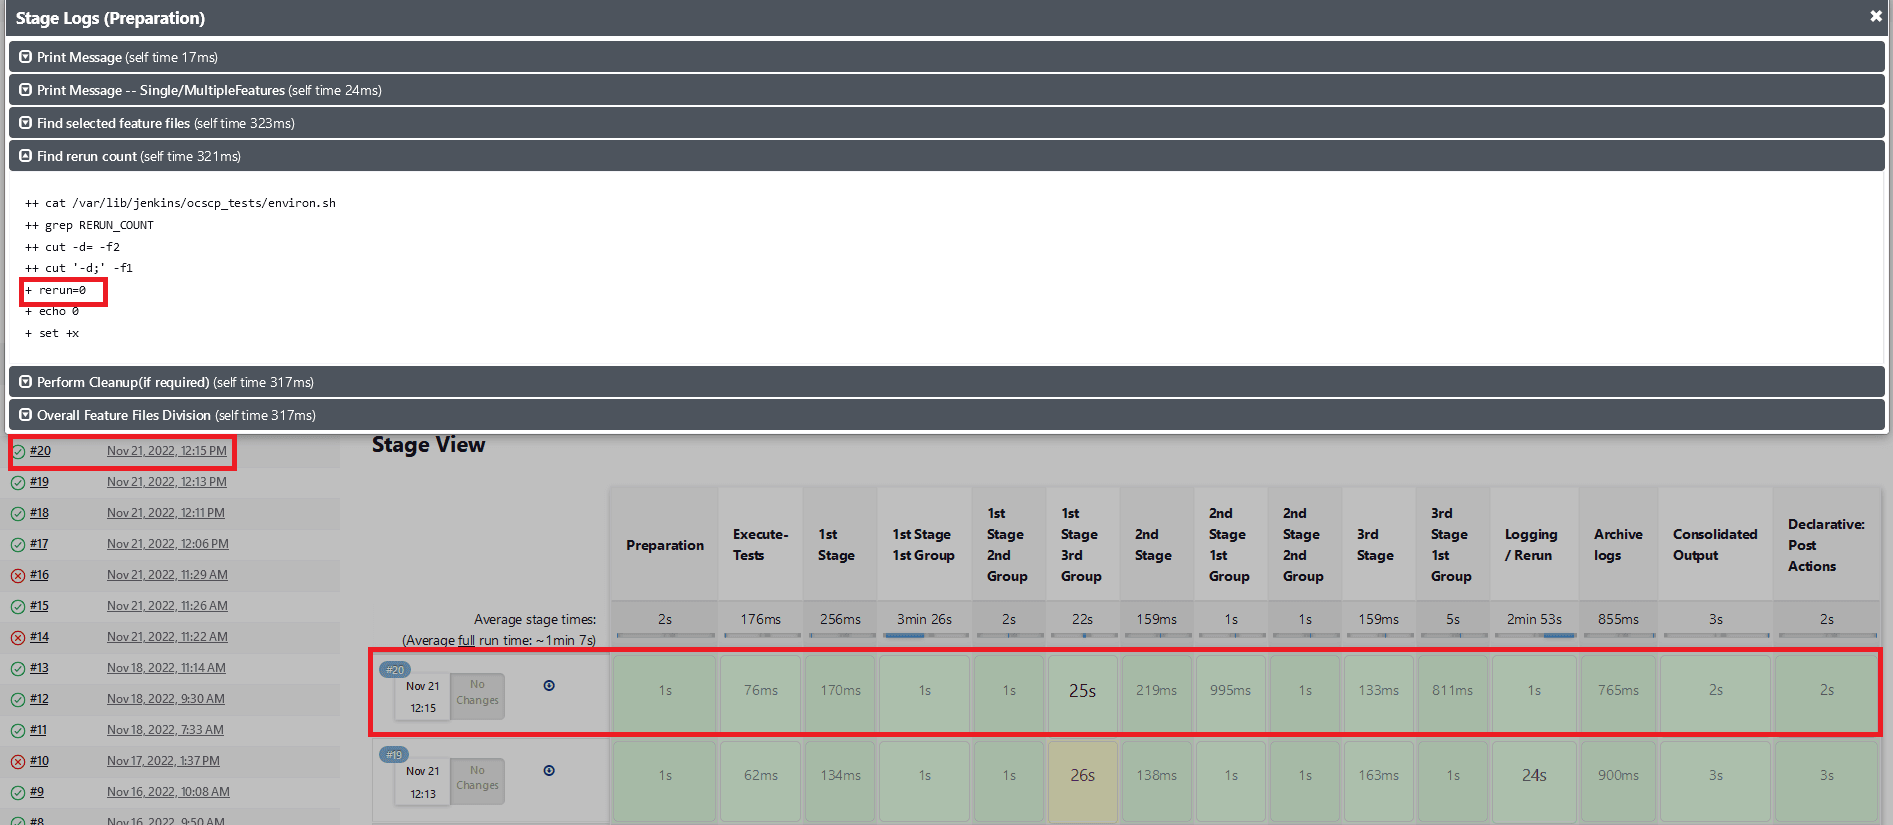
- When
Fetch_Log_Upon_Failureis set to YES andrerun_countis set to 0, test cases pass in the initial run. The pipeline will be green, and its status will show as blue.Figure 2-34 Fetch_Log_Upon_Failure is set to YES and rerun_count is set to 0, test cases pass
- When
Fetch_Log_Upon_Failureis set to YES andrerun_countis set to 0, test cases fail on the initial run but pass during the rerun. The initial execution stage is yellow and all subsequent successful stages will be green, and the status will be blue.Figure 2-35 Test Cases Fail on the Initial Run but Pass in the Rerun

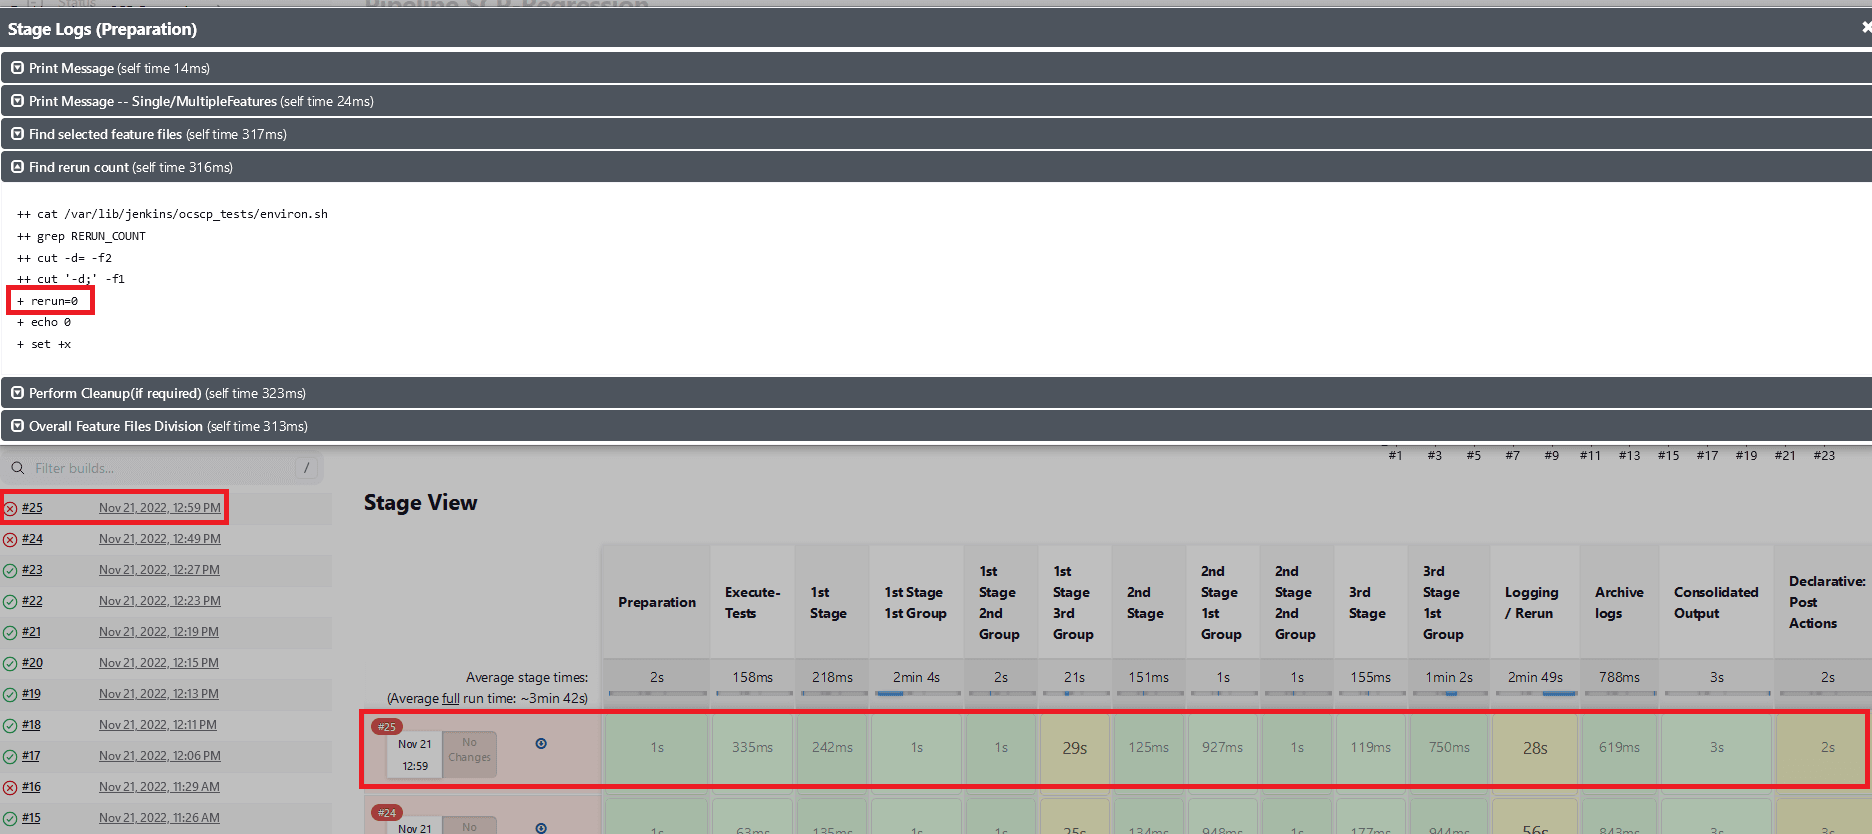
- When
Fetch_Log_Upon_Failureis set to YES andrerun_countis set to 0, test cases fail in both the initial and the rerun. Execution stages will show as yellow, all other successful stages will be shown as green, and the overall pipeline status will be red.Figure 2-36 Test Cases Fail in Both the initial and the Rerun
- When
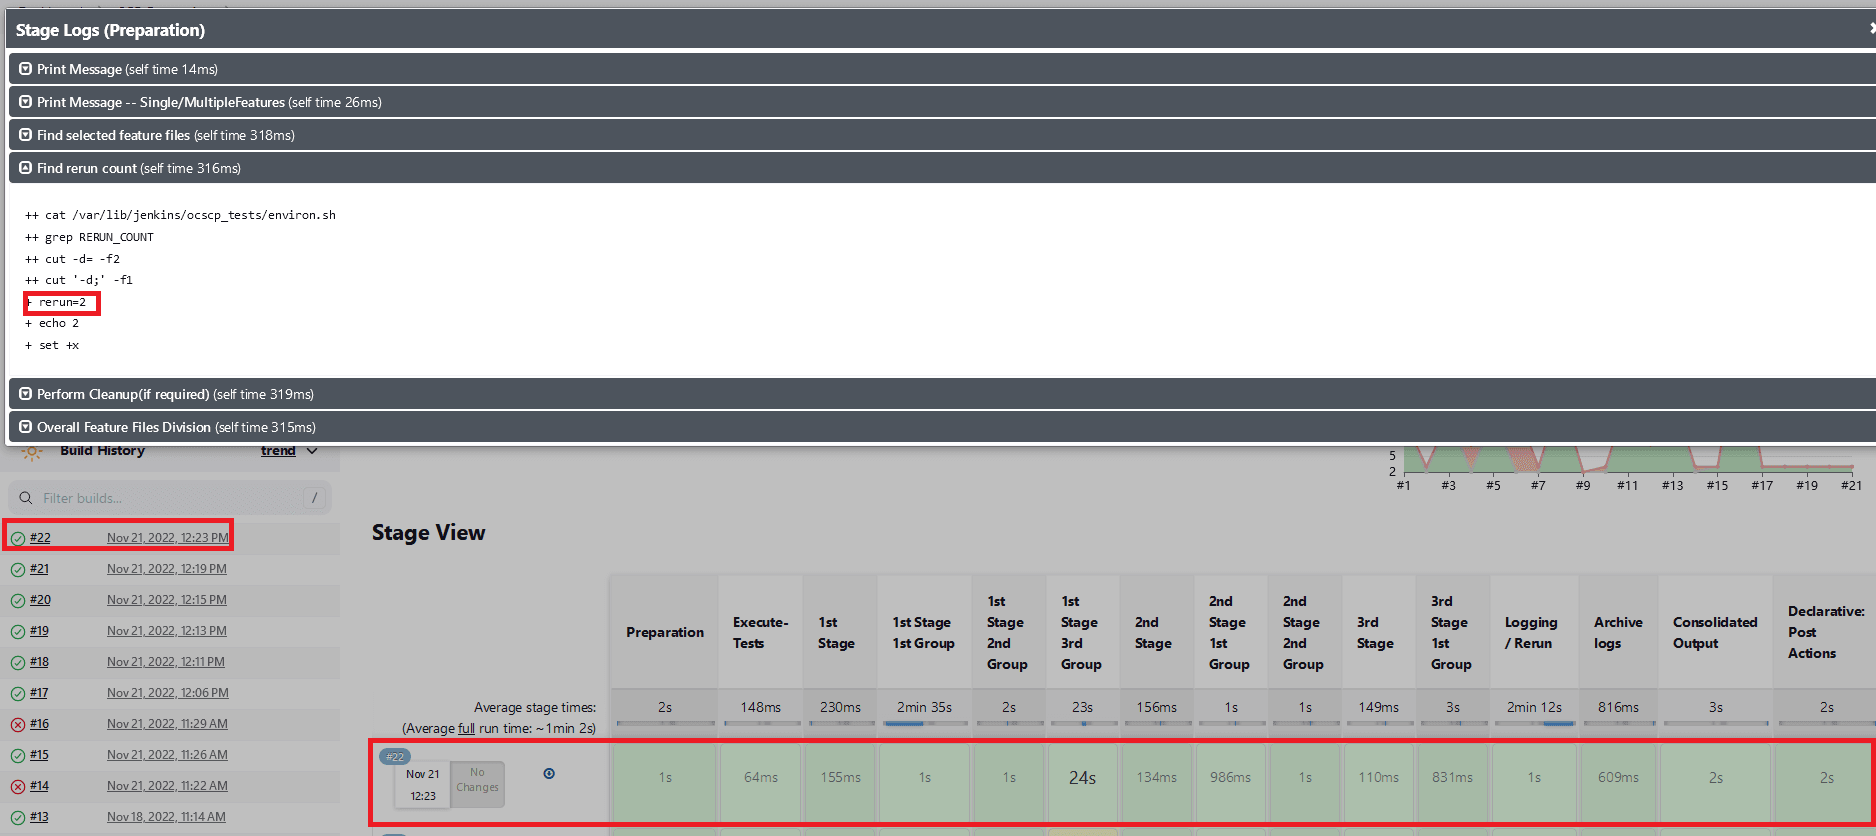
Fetch_Log_Upon_Failureis set to YES and thererun countis set to non-zero. If all of the test cases pass in the first run, no rerun will be initiated because the cases have already been passed. The pipeline will be green, and the status will be indicated in blue.Figure 2-37 All of the Test cases Pass in the Initial Run
- When
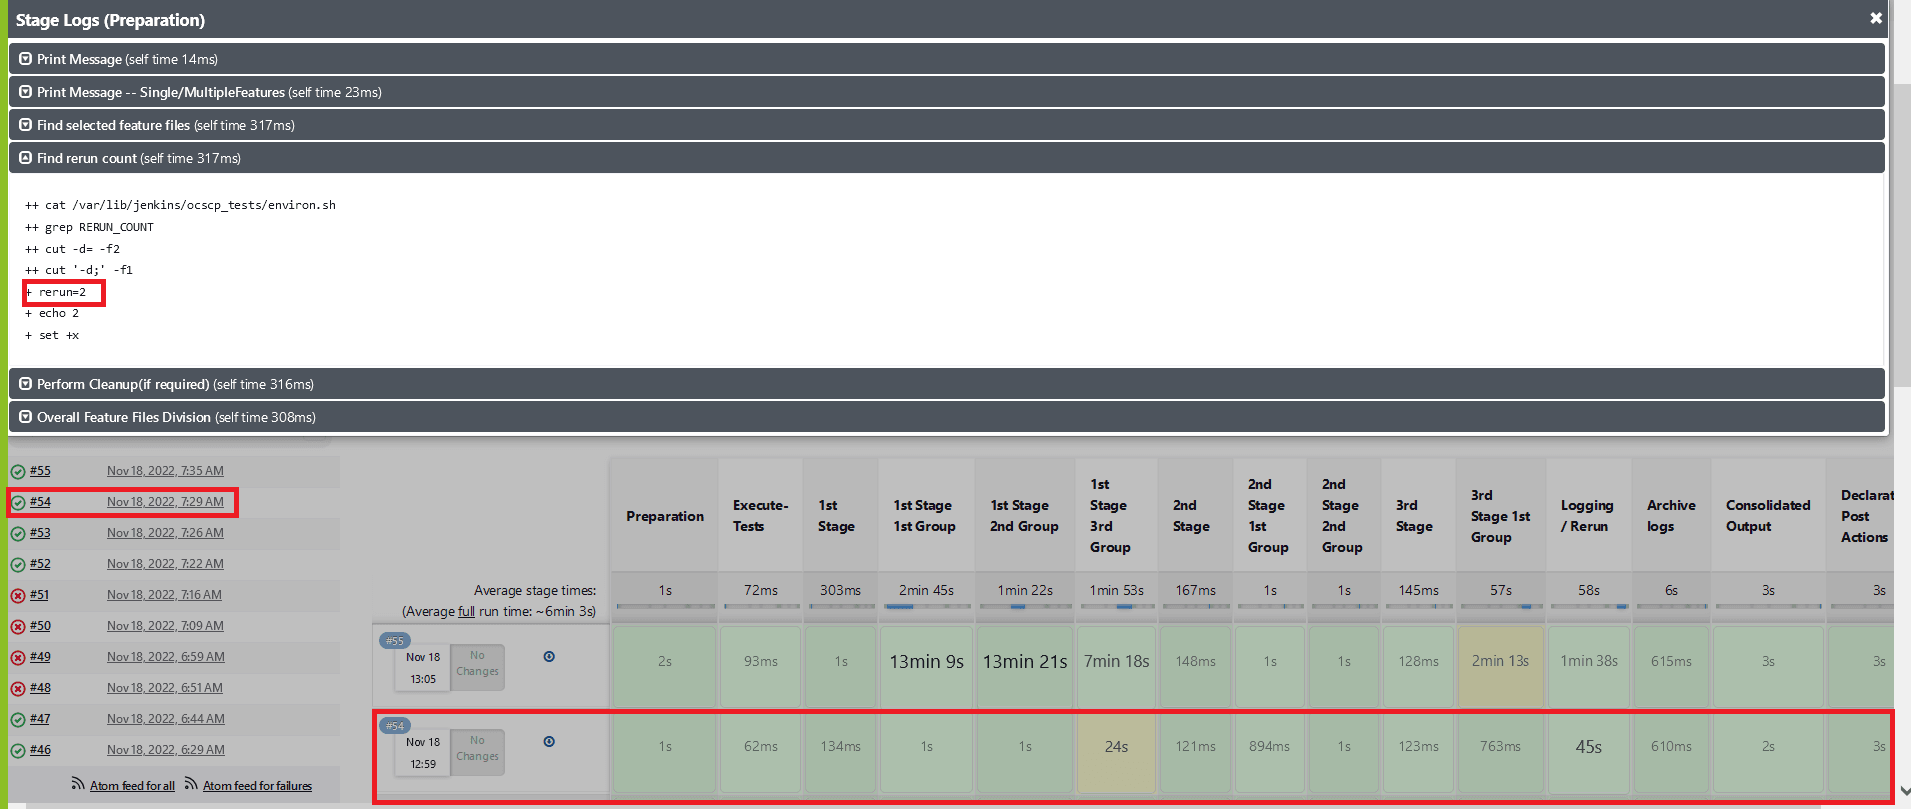
Fetch_Log_Upon_Failureis set to YES and thererun countis set to non-zero. If some of the test cases fail in the initial run and the remaining ones pass in one of the remaining reruns, then the initial test case execution stages will show as yellow, the remaining stages as green, and the overall pipeline status as blue.Figure 2-38 Test Cases Fail in the Initial Run and the Remaining Ones Pass
- When
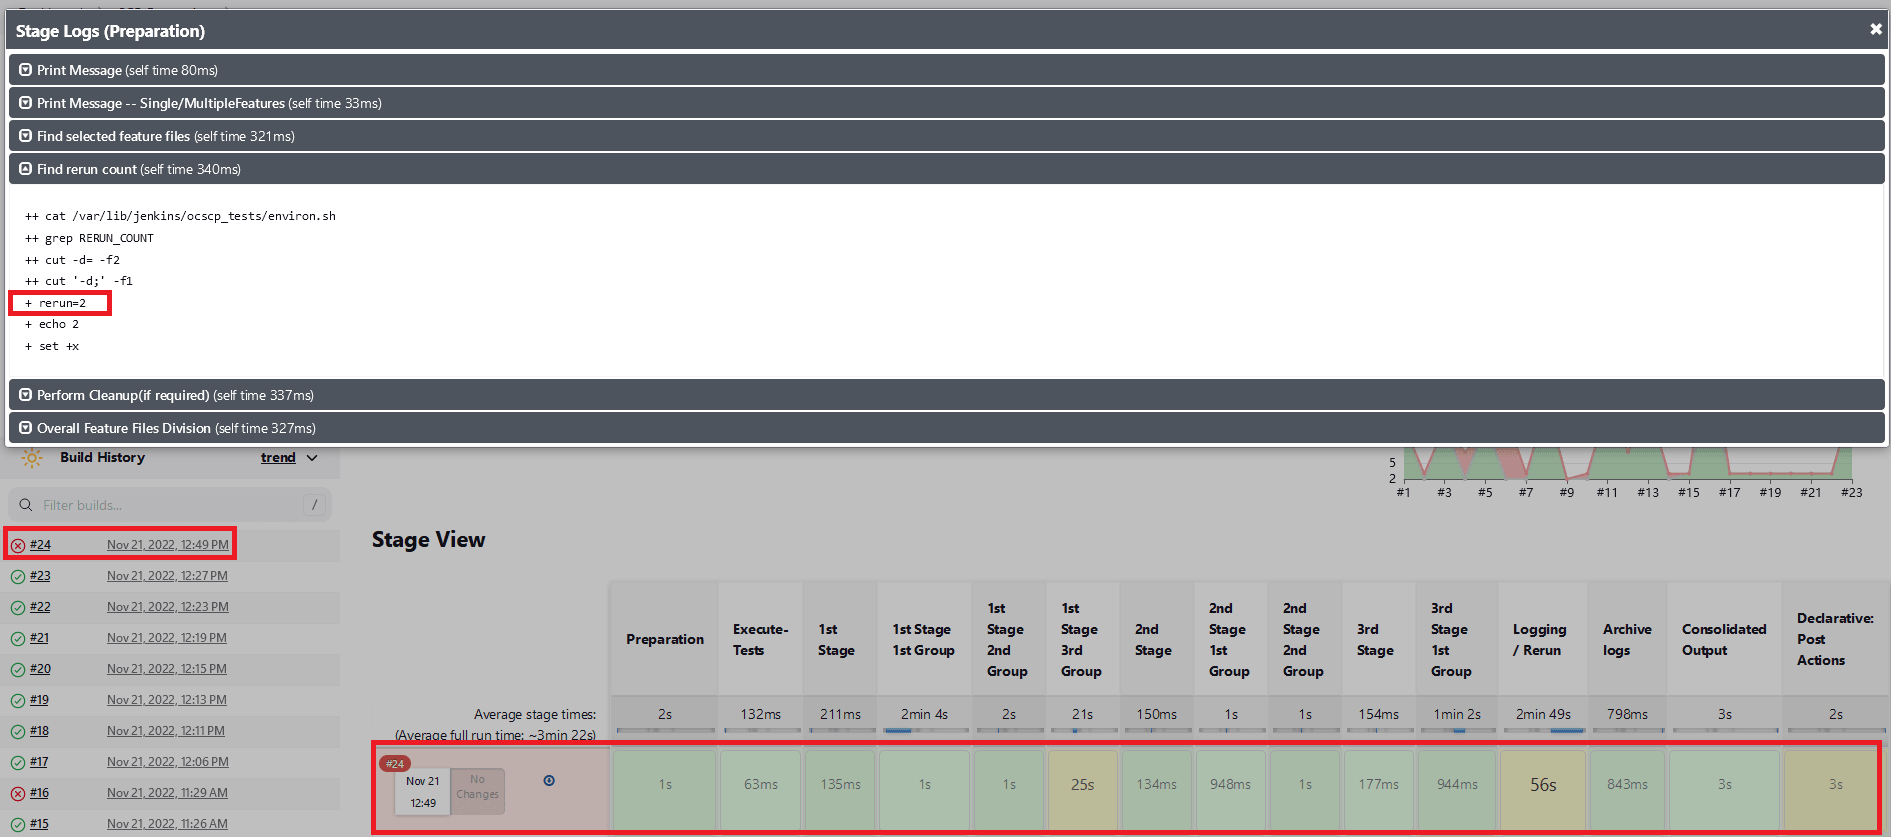
Fetch_Log_Upon_Failureis set to YES and thererun countis set to non-zero. If some of the test cases fail in the initial run and the remaining ones fail in all the remaining reruns, the stages of test case execution will be shown in yellow, the remaining stages in green, and the overall pipeline status in red.Figure 2-39 Test Cases Fail in the Initial and Remaining Reruns
- Whenever any of the multiple Behave processes that are running
in the ATS are exited without completion, the stage in which the process
exited and the consolidated output stage are shown as yellow, and the
overall pipeline status will be yellow. Also in the consolidated output
stage, near the respective stage result, the exact run in which the Behave
processes exited without completion will be printed.
Figure 2-40 Stage View When Behave Process is Incomplete

Figure 2-41 Consolidated Report for a Group When a Behave Process was Incomplete

Implementing Application Log
ATS automatically fetches the SUT Debug logs during the rerun cycle if it encounters any failures and saves them in the same location as the build console logs. The logs are fetched for the rerun time duration only using the timestamps. If, for some microservices, there are no log entries in that time duration, it does not capture them. Therefore, the logs are fetched only for the microservices that have an impact or are associated with the failed test cases.
Location of SUT Logs:
/var/lib/jenkins/.jenkins/jobs/PARTICULAR-JOB-NAME/builds/BUILD-NUMBER/date-timestamp-BUILD-N.txt
Note:
The file name of the SUT log is added as a suffix with the date, timestamp, and build number (for which the logs are fetched). These logs share the same retention period as build console logs, set in the ATS configuration. It is recommended to set the retention period to optimal owing to the Persistent Volume Claim (PVC) storage space availability.
.2.11 Lightweight Performance
The Lightweight Performance feature allows you to run performance test cases. In ATS, a new pipeline known as "<NF>-Performance", where NF stands for Network Function, is introduced, for example, SLF-Performance.
Figure 2-42 Sample Screen: UDR Home Page
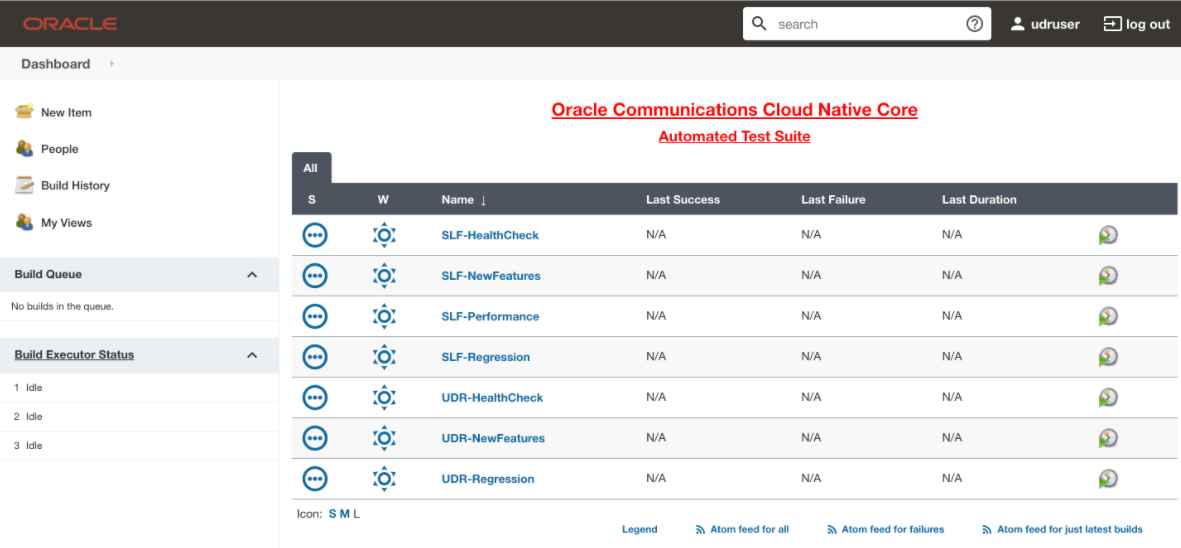
The <NF>-Performance pipeline verifies from 500 to 1k TPS (Transactions per Second) of traffic using the http-go tool, a tool used to run the traffic on the backend. It also helps to monitor the CPU and memory of microservices while running lightweight traffic.
The duration of the traffic run can be configured on the pipeline.
2.11.1 Configure <NF>-Performance Pipeline
- On the NF home page, click <NF>-Performance pipeline,
and then click Configure.
The General tab appears. The user must wait for the page to load completely.
- Click the Advanced Project Options tab.
Scroll down to reach the Pipeline configuration
section.
Figure 2-43 Advanced Project Options
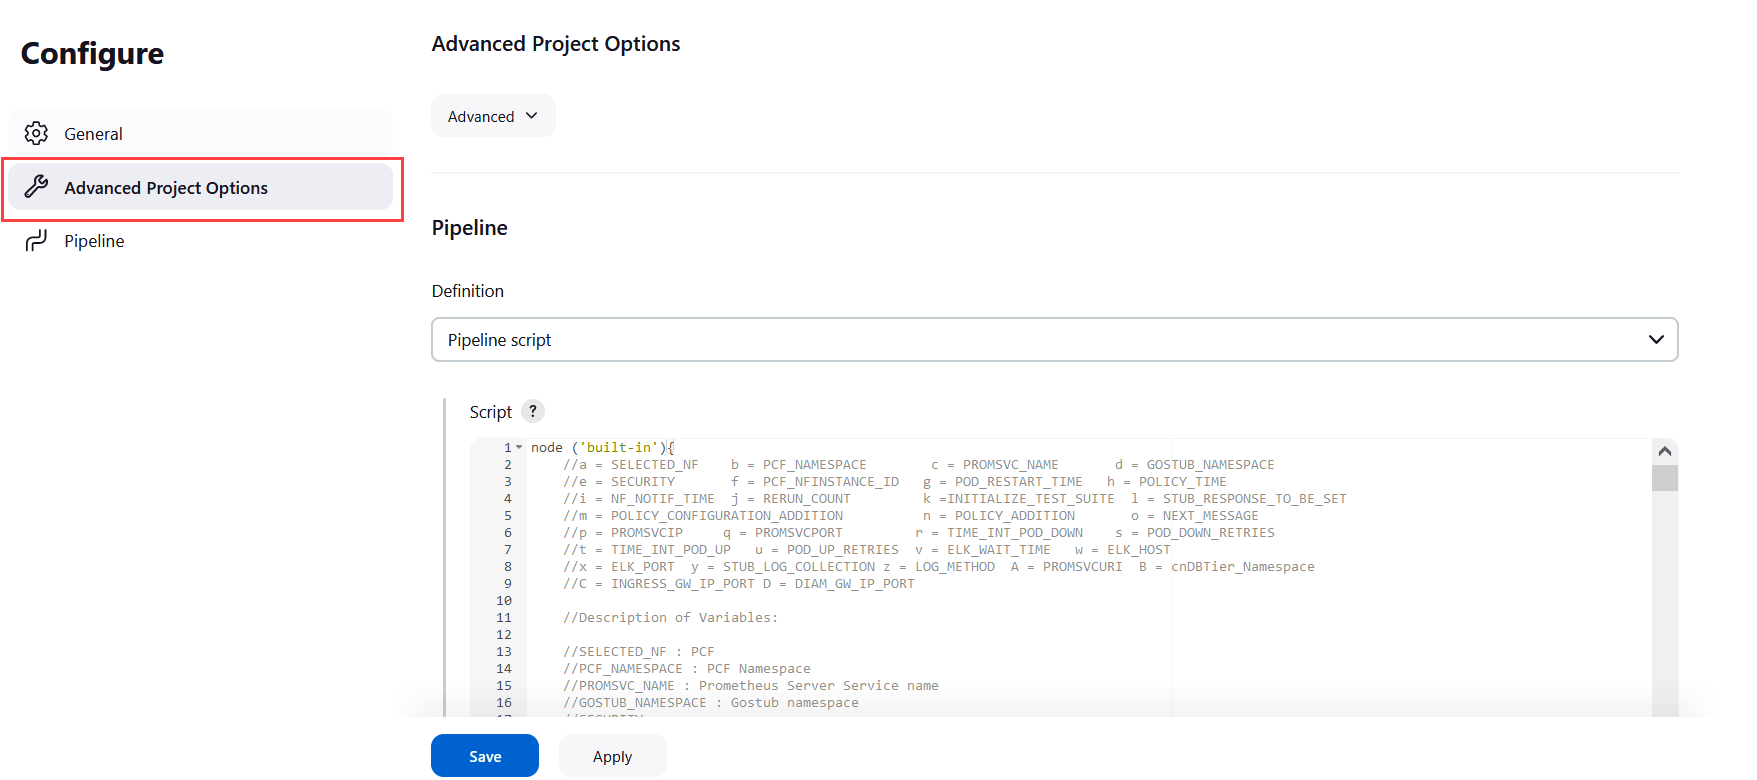
- Update the configurations as per your NF requirements and click Save. The Pipeline <NF>-Performance page appears.
- Click Build Now. This triggers lightweight traffic for the respective network function.
2.12 Modifying Login Password
You can log in to the ATS application using the default login credentials. The default login credentials are shared for each NF in the respective chapter of this guide.
- Log in to the ATS application using the default login credentials.
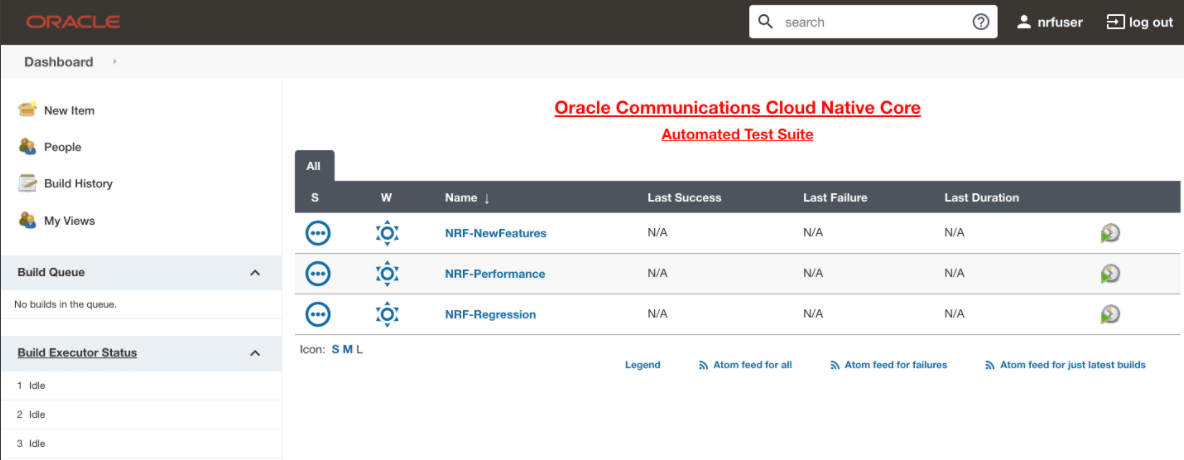
The home page of the respective NF appears with its preconfigured pipelines as
follows:
Figure 2-44 Sample Screen: NRF Home Page
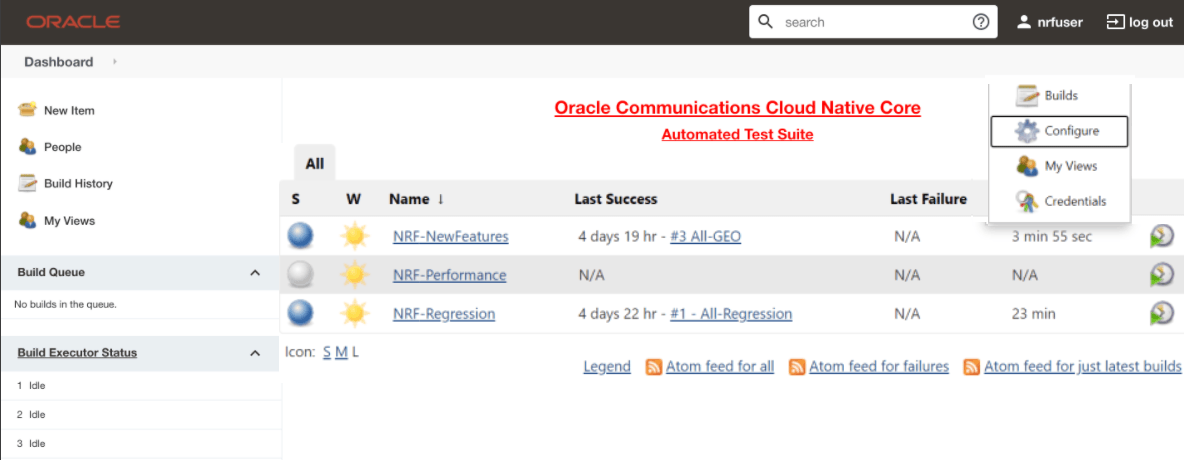
- Hover over the user name and click the down arrow.
- Click Configure.
Figure 2-45 Configure Option
The following page appears:
Figure 2-46 Logged-in User Details
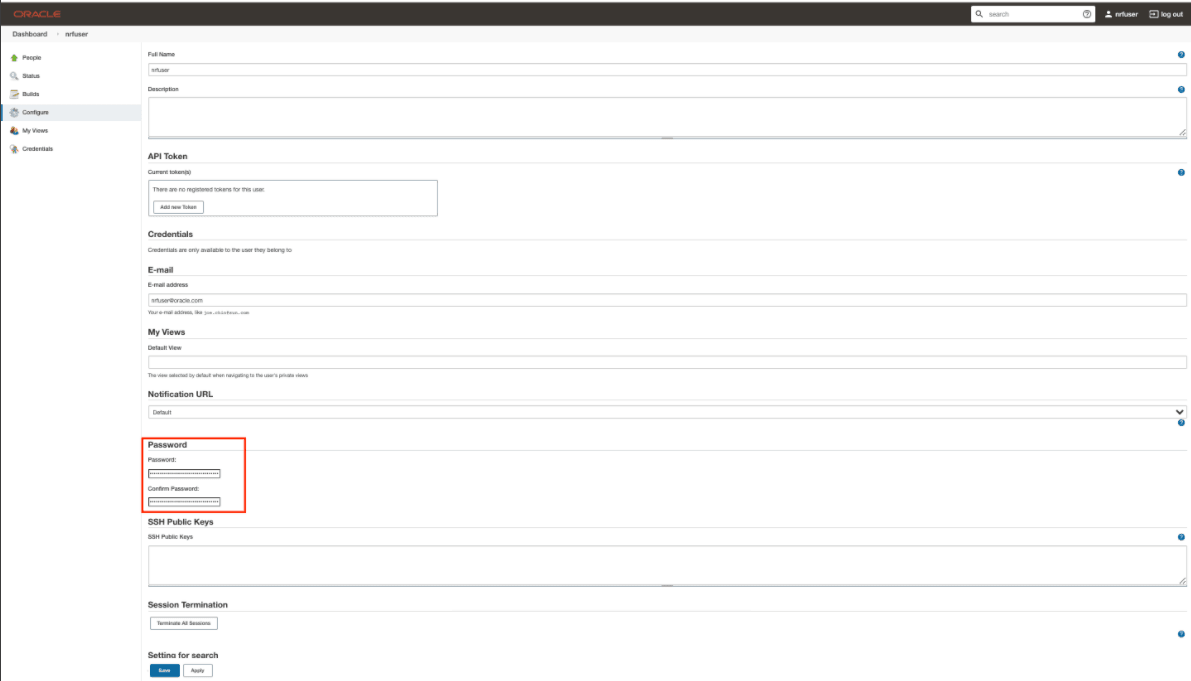
- In the Password section, enter the new password in the Password and Confirm Password fields.
- Click Save.
A new password is set for you.
2.13 Parallel Test Execution
Parallel test execution allows you to perform multiple logically grouped tests simultaneously on the same System Under Test (SUT) to reduce the overall execution time of ATS.
ATS currently runs all its tests in a sequential manner, which is time-consuming. With parallel test execution, tests can be run concurrently rather than sequentially or one at a time. Test cases or feature files are now separated into different folders, such as stages and groups, for concurrent test execution. Different stages, such as stage 1, stage 2, and stage 3, run the test cases in a sequential order, and each stage has its own set of groups. Test cases or feature files available in different groups operate in parallel. When all the groups within one stage have completed their execution, only then the next stage will start the execution.
Pipeline Stage View
The pipeline stage view appears as follows:
Figure 2-47 Pipeline Stage View

Pipeline Blue Ocean View
Figure 2-48 Pipeline Blue Ocean View

Impact on Other Framework Features
2.13.1 ATS GUI Page Changes
This section describes the changes to the ATS GUI page to trigger a build.
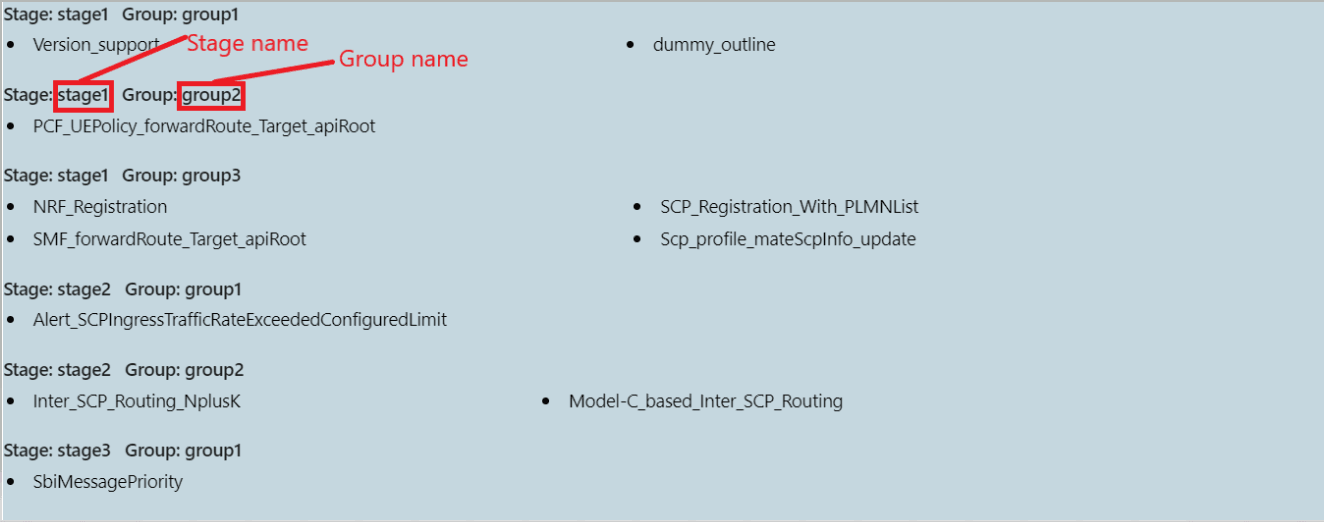
Changes in ATS GUI Page to Trigger a Build
The feature name, file name, and test case name are displayed under their stage and group names.
Figure 2-49 To Trigger a Build
2.13.2 ATS Console Log Changes
- A test case's stage and group names are listed in the logger
statements for that test case.
Figure 2-50 Logger Statement

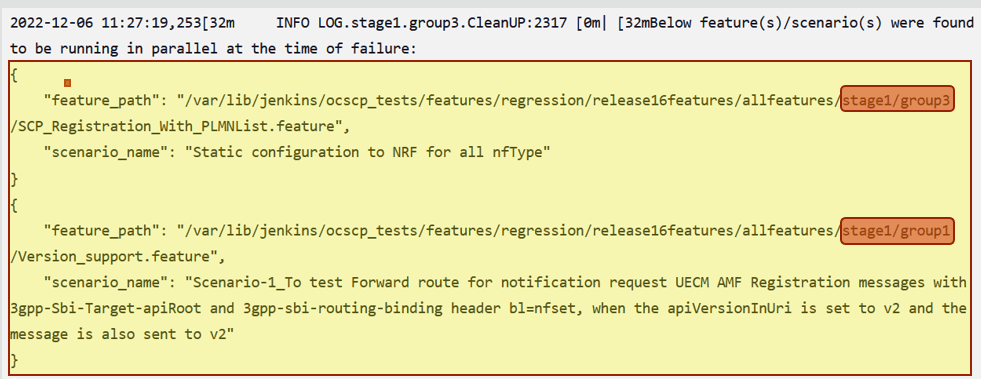
- When a test case fails, a list of test cases running in parallel
gets printed to make the debugging easier. The name of the test case and the
absolute path to the feature file it belongs to are listed in this list.
Figure 2-51 Absolute Path of Feature File
- The test result summary contains a summary for each group and an overall summary, along with the details of failing scenarios (stage-groupwise) and the total time taken by any pipeline execution. For further information, see the Managing Final Summary Report, Build Color, and Application Log.
2.13.3 Downloading or Viewing Individual Group Logs
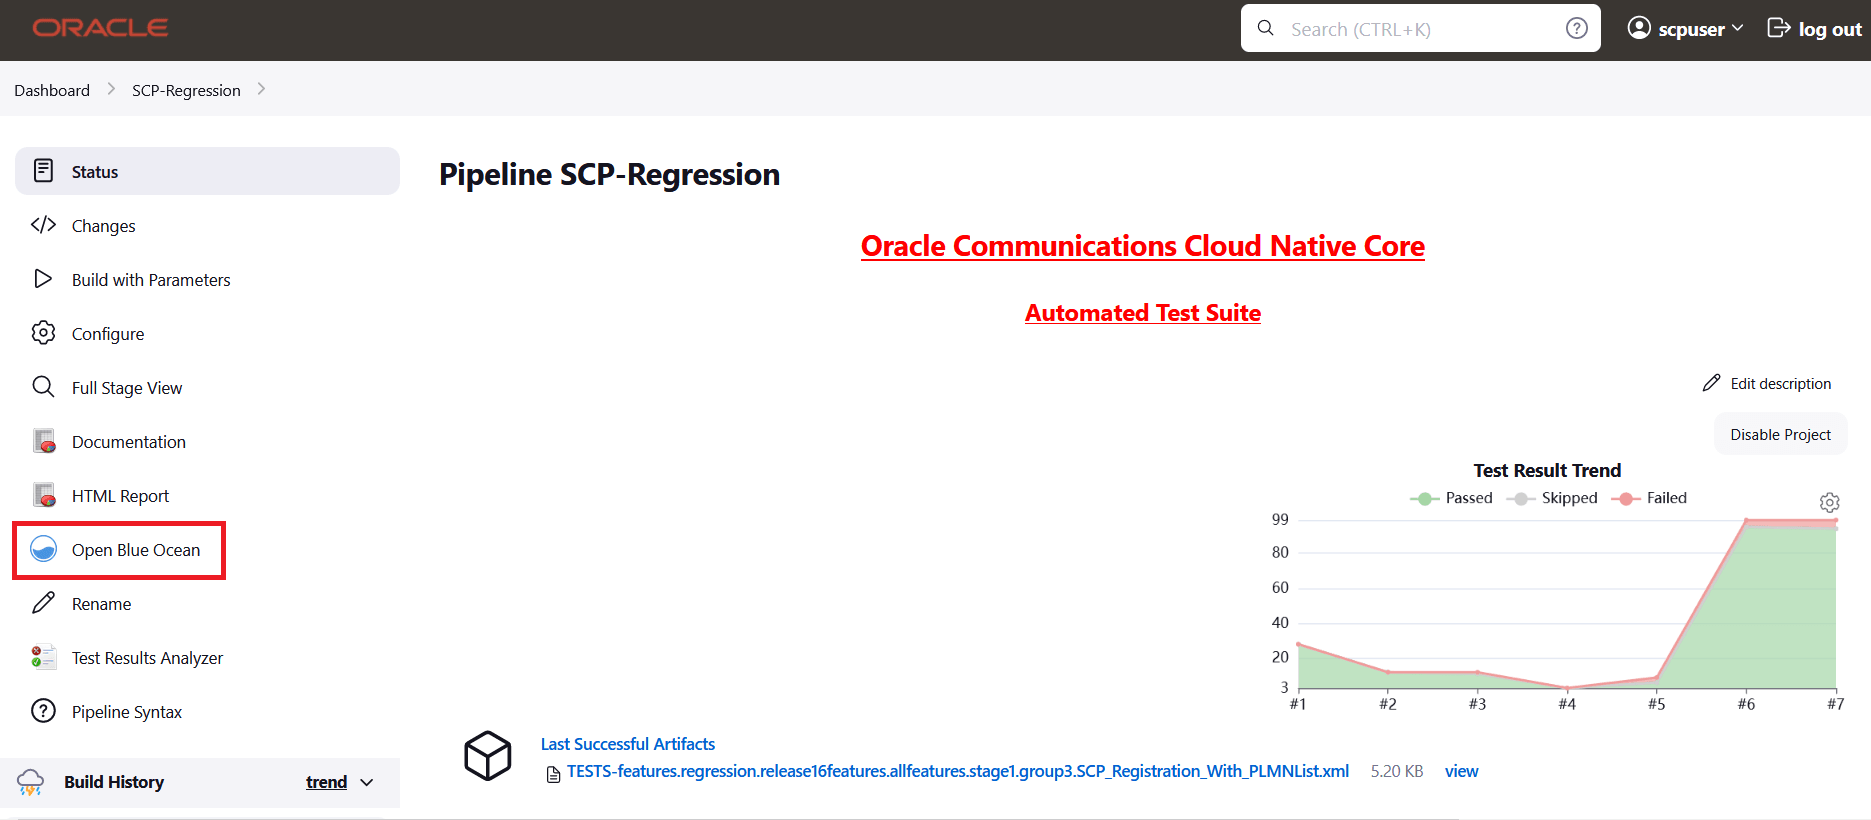
- On the Jenkins pipeline page, click Open Blue Ocean in the left
navigation pane.
Figure 2-52 Jenkins Pipeline Page
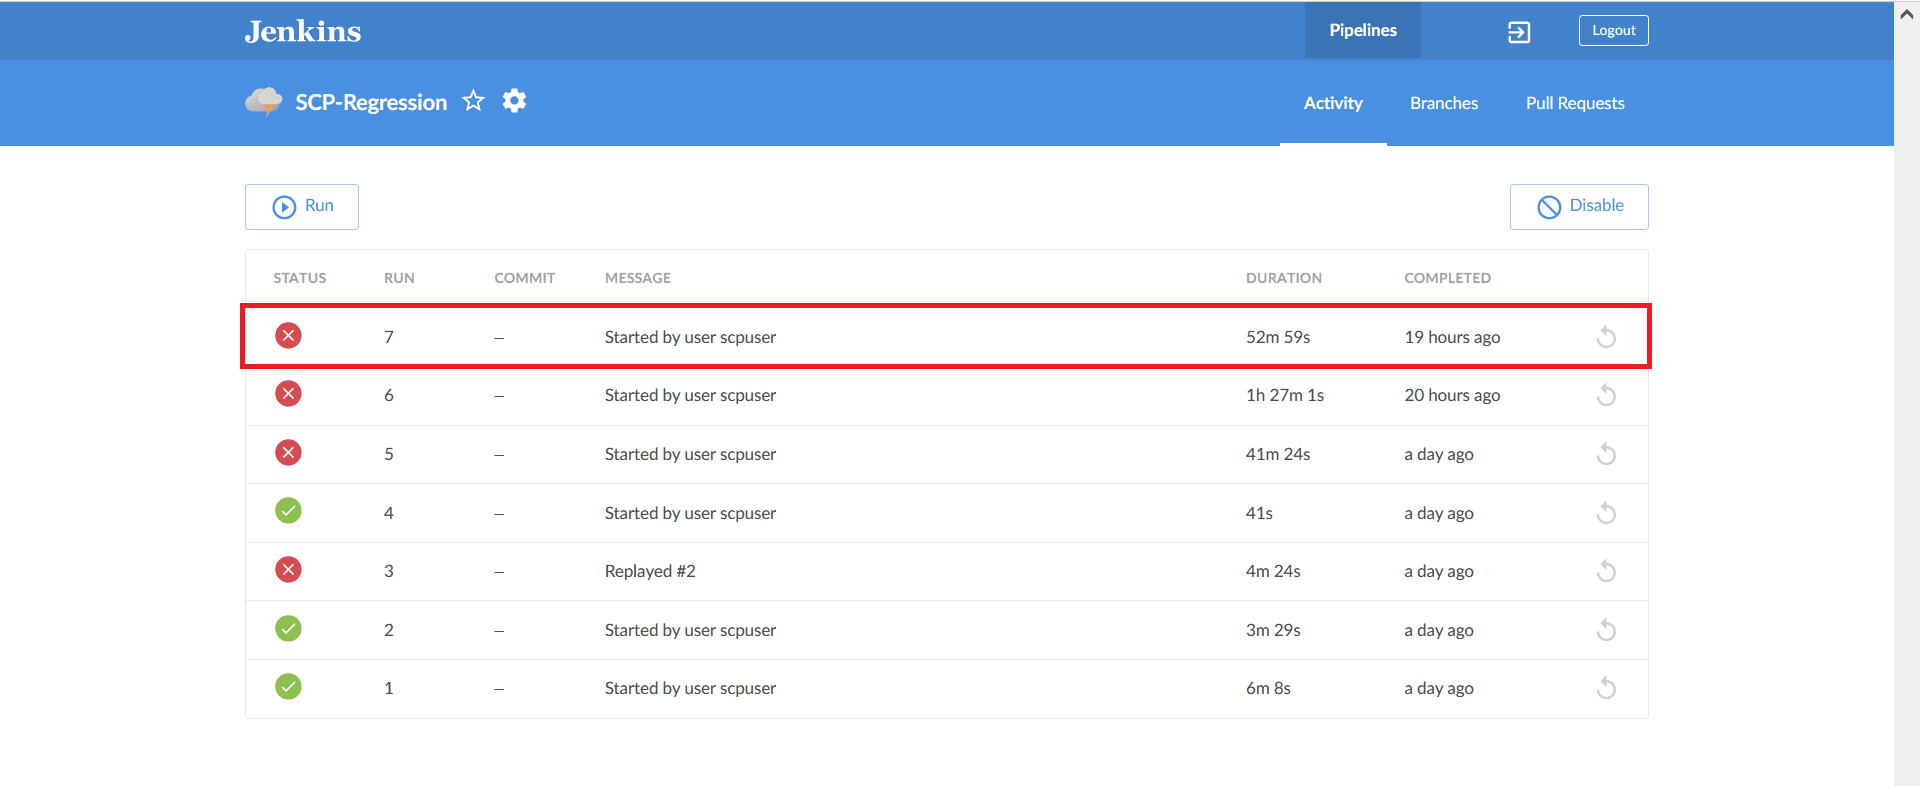
- Click the desired build row on the Blue Ocean page.
Figure 2-53 Run the Build
- The selected build appears. The diagram displays the order in which the
different stages, or groups, are executed.
Figure 2-54 Stage Execution

- Click the desired group to download the logs.
Figure 2-55 Executed Groups
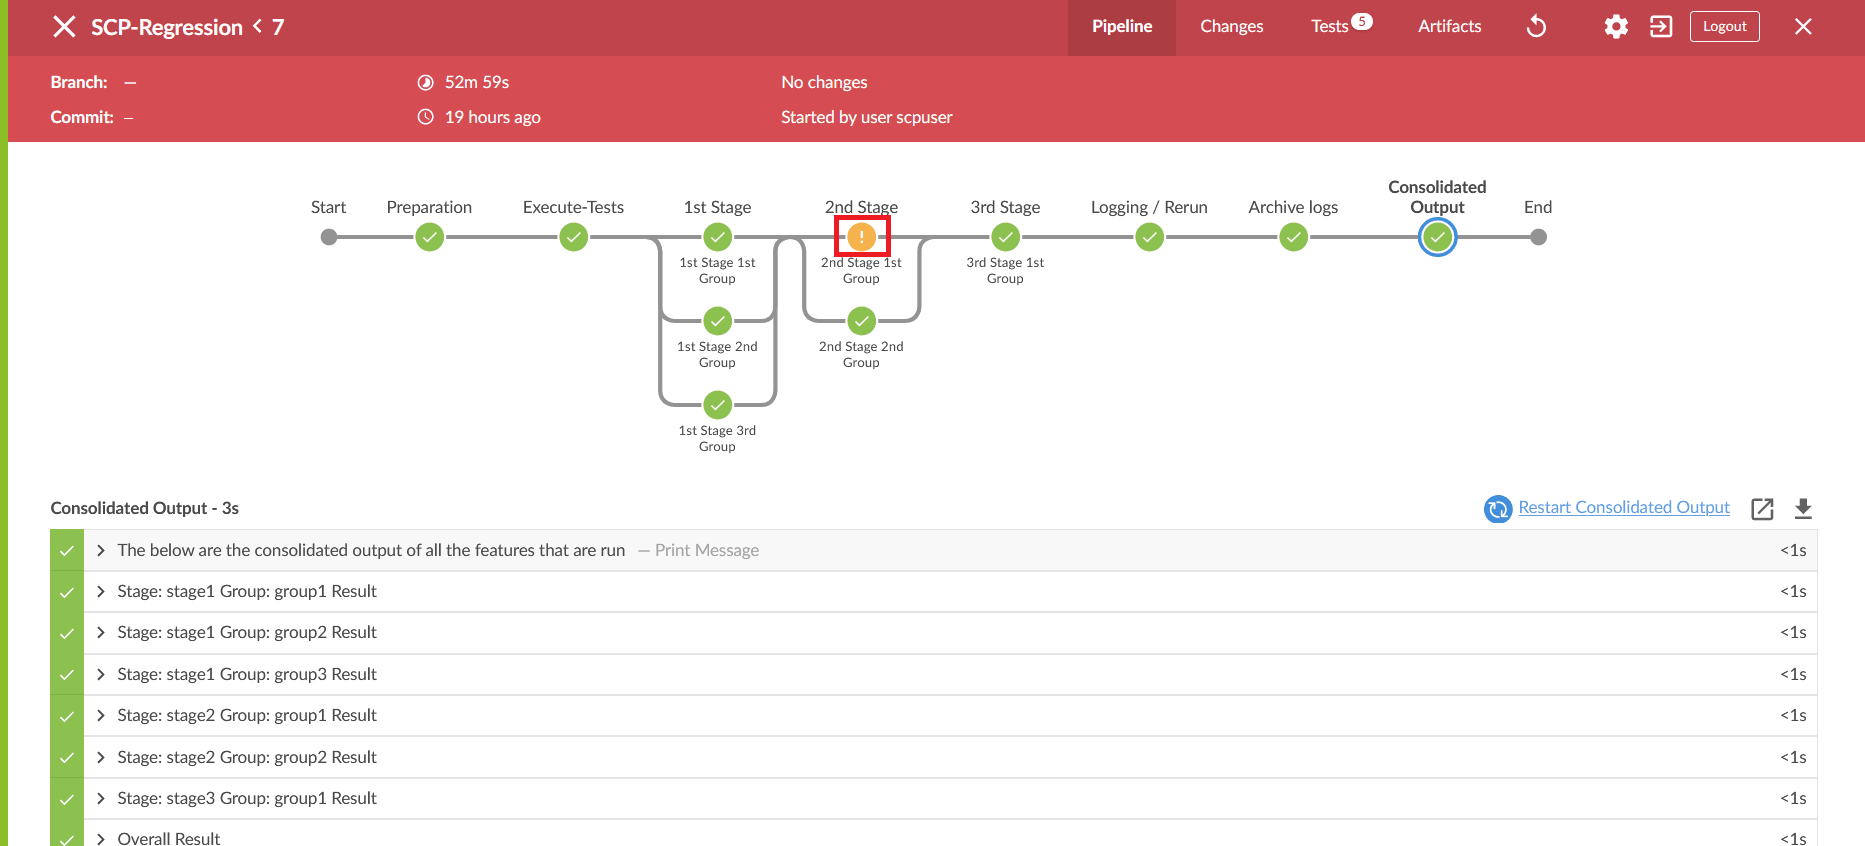
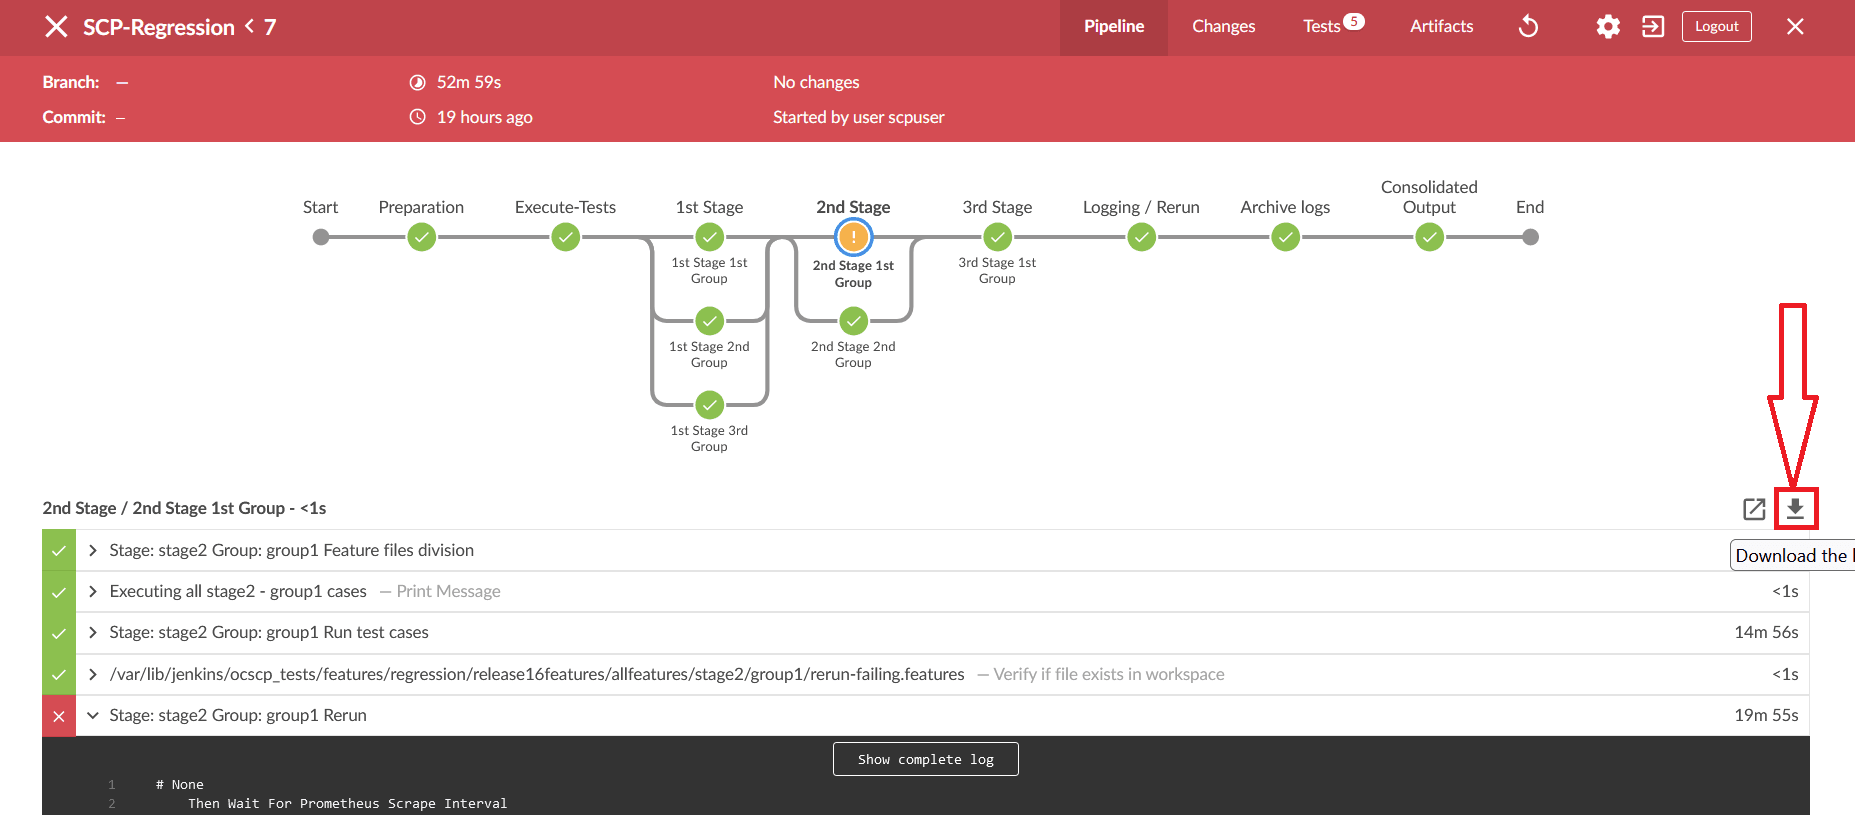
- Click the Download icon on the bottom right of the pipeline. The log for
the selected group is downloaded to the local system.
Figure 2-56 Download Logs
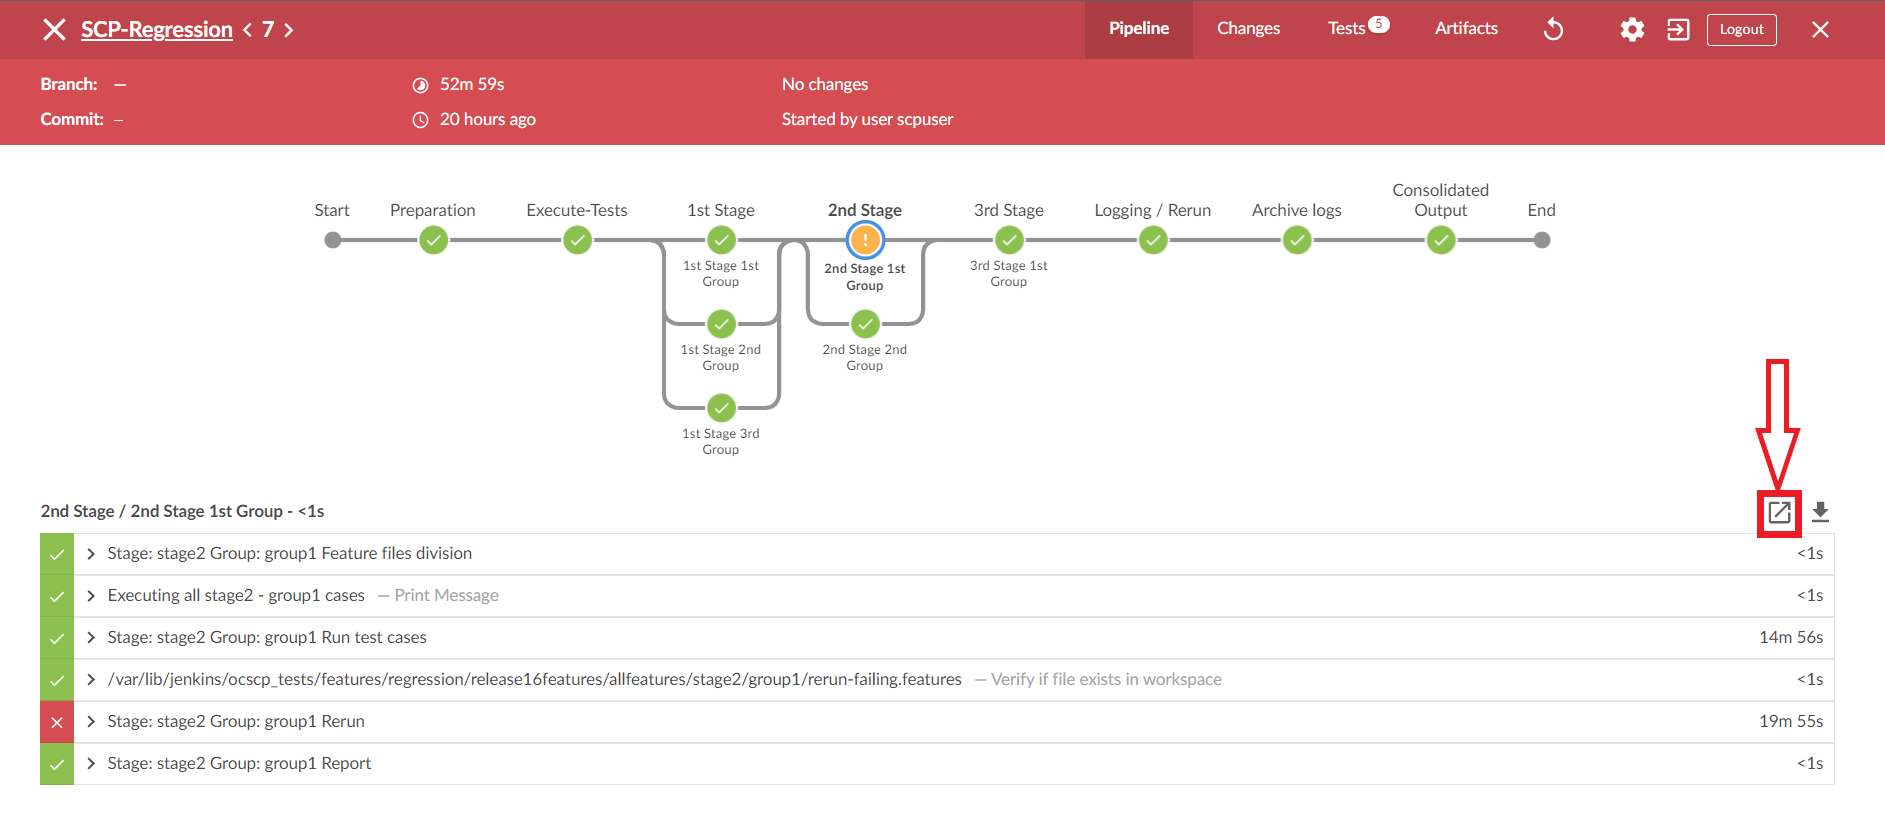
- To view the log, click the Display Log icon. The logs are displayed in a
new window.
Figure 2-57 Display Logs
Viewing Individual Group Logs without using Blue Ocean
- Using Stage View
- On the Jenkins pipeline page, hover the cursor over the group in stage view to view the logs.
- A pop-up with the label "Logs" will appear. Click on it.
- There will be a new pop-up window.It contains many rows, where each row corresponds to the execution of one Jenkins step.
- Click on the row labelled Stage: stage_name>."Group: <group_name> Run test cases to view the log for this group's execution.
- Click on the row labelled Stage: stage_name>." "group_name> Rerun to display the re-run logs.
- Using Pipeline Steps Page
- On the Jenkins pipeline page, under the Build History dropdown, click on the desired build number.
- Click the Pipeline Steps button on the left pane.
- A table with columns for step, arguments, and status appears.
- Under the Arguments column, find the label for the desired stage and group.
- Click on the step with the label Stage: <stage_name> Group: <group_name> Run test cases under it or click the Console output icon near the status to view the log for this group execution.
- To see rerun logs, find the step with the label Stage: <stage_name> Group: <group_name> Rerun under it.
2.14 Parameterization
This feature allows you to provide or adjust values for the input and output
parameters needed for the test cases to be compatible with the SUT configuration. You
can update or adjust the key-value pair values in the global.yaml
and feature.yaml files for each of the feature files so that they
are compatible with SUT configuration. In addition to the existing custom test case
folders (Cust New Features, Cust Regression, and Cust Performance), this feature enables
folders to accommodate custom data, default product configuration, and custom
configuration. You can maintain multiple versions or copies of the custom data folder to
suit varied or custom SUT configurations. With this feature, the ATS GUI has the option
to either execute test cases with the default product configuration or with a custom
configuration.
- Define parameters and assign or adjust values to make them compatible with SUT configuration.
- Execute test cases either with default product configurations or custom configurations and multiple custom configurations to match varied SUT configurations.
- Assign or adjust values for input or output parameters through custom or default configuration yaml files (key-value pair files).
- Define or adjust the input or output parameters for each feature file with its corresponding configuration.
- Create and maintain multiple configuration files to match multiple SUT configurations.
Figure 2-58 SUT Design Summary

- The Product Config folder contains default product configuration files (feature-wise yaml per key-value pair), which are compatible with default product configuration.
- New features, Regression and Performance, Data folder, and Product Config folders are replicated or copied into custom folders and delivered as part of the ATS package in every release.
- You can customize custom folders by:
- Removing test cases not needed or as appropriate for your use.
- Adding new test cases as needed or as appropriate for your use.
- Removing or adding data files in the cust_data folder or as appropriate for your use.
- Adjusting the parameters or values in the key-value pair per yaml file in the custom config folder for test cases to run or pass with a custom configured SUT.
- The product folders are always intact (unchanged) and you can update the Custom folders
- You can maintain multiple copies of Custom Configurations and bring them to use as needed or as appropriate for the SUT configuration.
Figure 2-59 Folder Structure

2.14.1 Running Test Cases
Enable
Rename or copy the Cust Config [1/2/3/N] folder to the Cust Config folder in order for ATS to run the test cases with a specific custom configuration. When the option to run test cases with custom configuration is chosen, it always points to the Cust Config folder.
To Run ATS Test Cases
- If custom configuration is selected, then test cases from custom folders are populated on the ATS UI, and custom configuration is applied to them through the key-value pair per yaml file defined or present in the "Cust Config" folder.
- If product configuration is selected, then the test cases from product folders are populated on the ATS UI, and product configuration is applied to them through key-value pairs per yaml file defined or present in the Product Config folder.
Figure 2-60 ATS Execution Flow
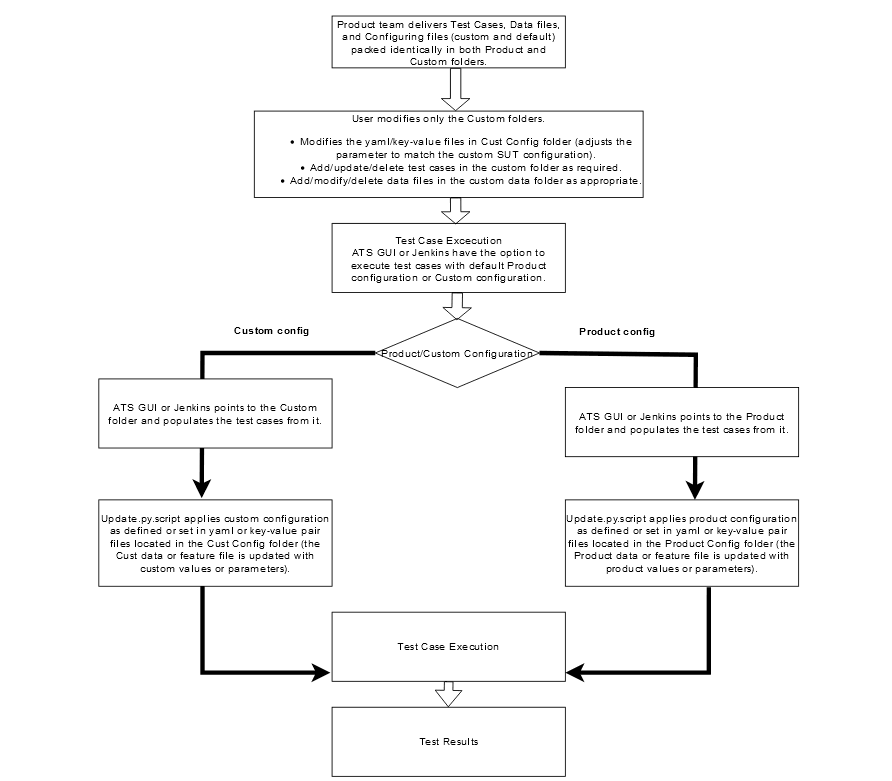
Figure 2-61 Sample: Configuration_Type

2.15 PCAP Log Collection
PCAP Log Collection allows collecting the NF, SUT, or PCAP logs from the debug tool sidecar container. This feature can be integrated and delivered as a standalone or along with the Application Log Collection feature. For information, see Application Log Collection.
PCAP Log Integration
- The Debug tool should be enabled on SUT Pods while deploying the NF. The
name of the Debug container must be "tools".
For example, in SCP, the debug tool should be enabled for all the SCP microservice pods.
- Update the following parameters in the values.yaml file, under the
resource section, with ATS minimum resource requirements:
- CPU: 3
- memory: 3Gi
- On the home page, click any new feature or regression pipeline.
- In the left navigation pane, click Build with Parameters.
- Select YES from the drop-down menu of Fetch_Log_Upon_Failure.
- If option Log_Type is available, select value PcapLog [Debug Container Should be Running] for it.
- Select PcapLog [Debug Container Should be
Running] to activate PCAP Log Collection in ATS-NF.
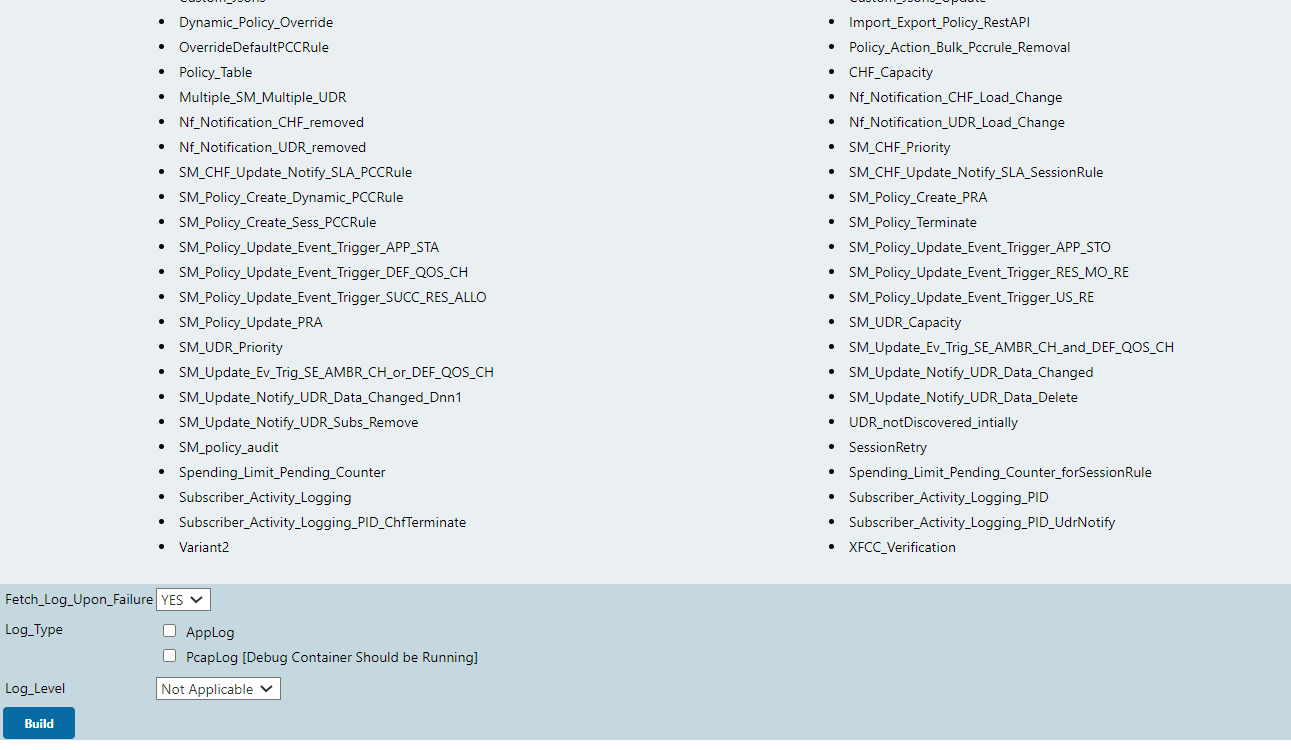
The following Build with Parameters page appears when only the PCAP logs feature has been integrated.
Figure 2-62 PCAP Logs Selection Option

- After the build execution is complete, go into the ATS pod, then
navigate to below path to find the pcaplogs:
.jenkins/jobs/<Pipeline
                    Name>/builds/<build number>/
For example,
.jenkins/jobs/SCP-Regression/builds/5/Pcaplogs is present in zip form. Unzip it to get the log files.
Figure 2-63 Both Application Logs and PCAP Logs Selection
2.15.1 Application Log Collection and Parallel Test Execution Integration
A new stage,"Logging/Rerun", has been added at the end of the Execute-Tests stage to collect rerun logs, such as applog and PCAP logs, by running the failed test cases in a sequence.
Figure 2-64 Logging/Rerun new stage

Fetch_Log_Upon_Failure parameter is set to YES and if any
test case fails in the initial run, then:
- The failed test case reruns and log collection start in the Logging/Rerun stage after the initial run is completed for all the test cases.
- The logs from the initial execution are collected, but they might be incorrect.
- Even if the
rerunparameter is set to 0, the failed test case reruns in the Logging/Rerun stage and the log is collected. - If the
Fetch_Log_Upon_Failureparameter is set to NO and if any test case fails in the initial run, then the failed test case rerun starts in the same stage after the initial execution is over for all the test cases in its group.
2.16 Persistent Volume for 5G ATS
The Persistent Volume (PV) feature allows ATS to retain historical build execution data, test cases, and ATS environment configurations.
ATS Packaging When Using Persistent Volume
- Without the Persistent Volume option: ATS package includes an ATS image with test cases.
- With Persistent Volume option: ATS package includes the ATS
image and test cases separately. The new test cases are provided between the
releases.
To support both with and without Persistent Volume options, test cases and execution job data are packaged in the ATS image as well as a tar file.
2.16.1 Processing Flow
First Time Deployment
Initially, when you deploy ATS, for example, the PI-A ATS pod, you use PVC-A, which is provisioned and mounted to the PI-A ATS pod. By default, PVC-A is empty. So, you have to copy the data (ocslf_tests and jobs folders) from the PI-A tar file to the pod after the pod is up and running. Then restart the PI-A pod. At this point, you can change the number of build logs to maintain in the ATS GUI.
Subsequent Deployments
When you deploy ATS for the subsequent time, for example, in a PI-B ATS pod, you use PVC-B, which is provisioned and mounted to the PI-B ATS pod. By default, the PVC-B is empty, and you have to copy the data (ocslf_tests and jobs folders) from the PI-B tar file to the pod after the pod is up and running. At this point, copy all the necessary changes to the PI-B pod from the PI-A pod and restart the PI-B pod. You can change the number of build logs to maintain in the ATS GUI. After updating the number of builds, you can delete the PI-A pod and continue to retain the PVC-A. If you do not want backward porting, you can delete PVC-A.
2.16.2 Deploying Persistent Volume
- Before deploying Persistent Volume, create a PVC in the same
namespace where you have deployed ATS. You have to provide values for the
following parameters to create a PVC:
- PVC Name
- Namespace
- Storage Class Name
- Size of the PV
- Run the following command to create a
PVC:
kubectl apply -f - <<EOF

apiVersion: v1
kind: PersistentVolumeClaim
metadata:
  name: <Please Provide the PVC Name>
  namespace: <Please Provide the namespace>
  annotations:
spec:
  storageClassName: <Please Provide the Storage Class Name>
  accessModes:
    - ReadWriteOnce
  resources:
    requests:
      storage: <Please Provide the size of the PV>
EOF
Note:
It is recommended to suffix the PVC name with the release version to avoid confusion during subsequent releases. For example: ocats-slf-pvc-1.9.0 - The output of the above command with parameters is as
follows:
The persistentvolumeclaim/ocats-slf-1.9.0-pvc is created.[cloud-user@atscne-bastion-1 templates]$ kubectl apply -f - <<EOF > > apiVersion: v1 > kind: PersistentVolumeClaim > metadata: > name: ocats-slf-1.9.0-pvc > namespace: ocslf > annotations: > spec: > storageClassName: standard > accessModes: > - ReadWriteOnce > resources: > requests: > storage: 1Gi > EOF - To verify whether PVC is bound to PV and is available for use,
run the following
command:
kubectl get pvc -n <namespace used for pvc creation>The output of the above command is as follows:Figure 2-65 Verifying PVC
 Check that the STATUS is Bound and that the rest of the parameters, such as NAME, CAPACITY, ACCESS MODES, STORAGECLASS, and so on, are the same as specified in the PVC creation command.
Note:
Do not proceed further if there is any issue with PVC creation. Contact your administrator to create a PV. - After creating persistent volume, change the following
parameters in the values.yaml file to deploy persistent volume.
- Set the PVEnabled parameter to "true".
- Provide the value for the PVClaimName parameter. The PVClaimName value should be the same as the value used to create a PVC.
- After deploying ATS, copy the <nf_main_folder> and
<jenkins jobs> folders from the tar file to their ATS pod, and then
restart the pod as a one-time activity.
- Run the following command to extract the tar
file:
ocats-<nf_name>-data-<release-number>.tgzNote:
The ats_data.tar file is the name of the tar file containing <nf_main_folder> and jobs folders. It can be different for different NFs. - Run the following set of commands to copy the required
folders:
kubectl cp ats_data/jobs <namespace>/<pod-name>:/var/lib/jenkins/.jenkins/kubectl cp ats_data/<nf_main_folder> <namespace>/<pod-name>:/var/lib/jenkins/ - Run the following command to restart the pods as one-time
activity:
kubectl delete po <pod-name> -n <namespace>Note:
Before running the following command, copy the changes done on the new release pod from the old release pod using thekubectl cpcommand. [Applicable in the case of subsequent deployment only]
- Run the following command to extract the tar
file:
- When the pod is up and running, log in to the ATS GUI and go to
your NF specific pipeline. Click Configure in the left navigation
pane. The General tab appears. Configure the Discard old
Builds option. This option allows you to configure the number of
builds you want to retain in the persistent volume.
Figure 2-66 Discard Old Builds

Note:
It is recommended to configure this option. If you do not input a value for this option, the application will take into account all builds, which could be a large number, and will completely consume the Persistent Volume.
2.16.3 Backward Porting
The following deployment steps apply to the old release of PVC-supported ATS Pod.
Note:
This procedure is for backward porting purposes only and should not be considered a subsequent release of the POD deployment procedure.- Change the PVEnabled parameter to "true".
- Provide the name of the old PVC as the value for parameter PVClaimName.
2.17 Test Results Analyzer
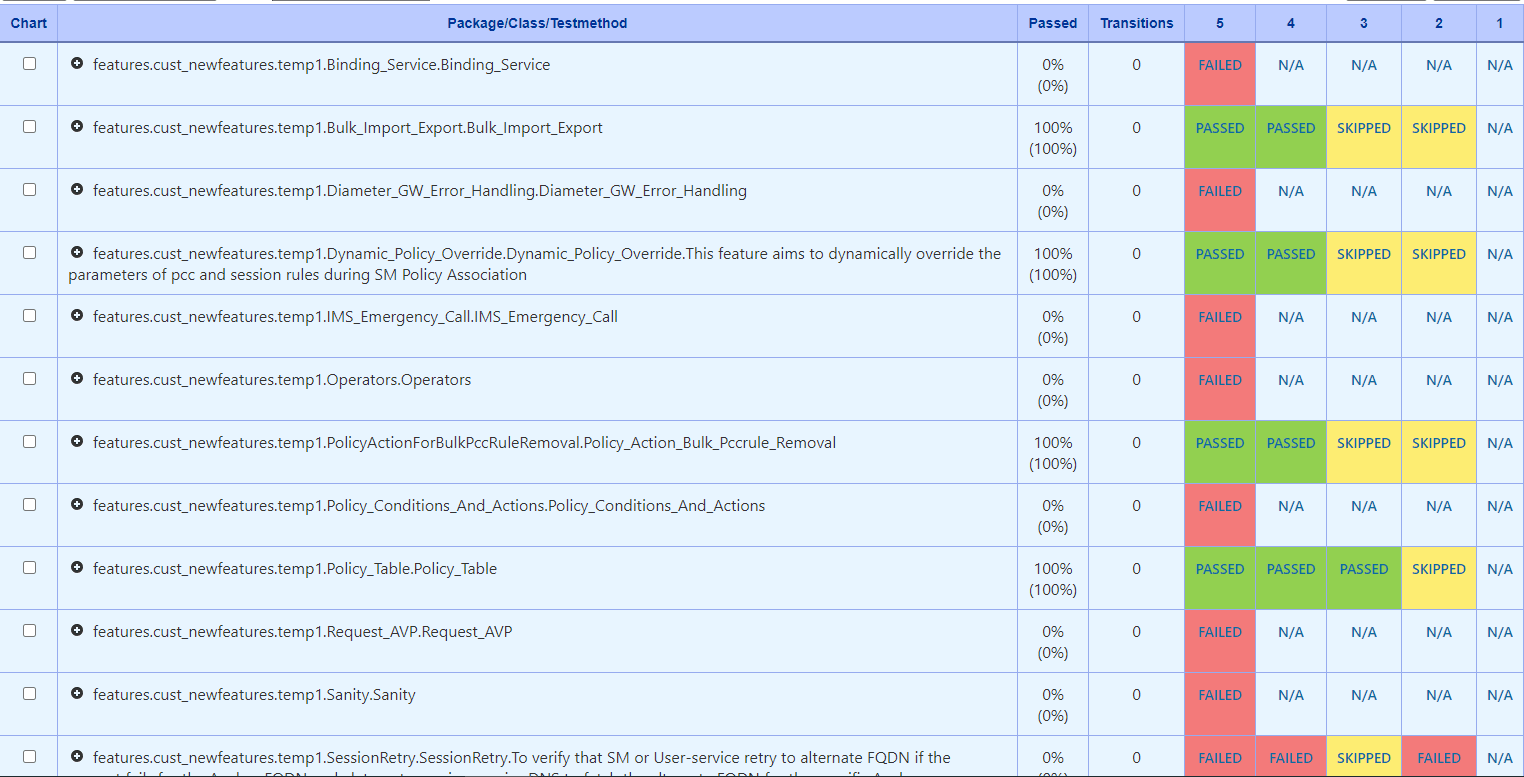
The Test Results Analyzer is a plugin available in ATS to view pipeline test results based on XML reports. It provides the test results report in a graphical format, which includes consolidated and detailed stack trace results in case of any failures. It allows you to navigate to each and every test.
- PASSED: If the test case passes.
- FAILED: If the test case fails.
- SKIPPED: If the test case is skipped.
- N/A: If the test cases are not executed in the current build.
2.17.1 Accessing Test Results Analyzer Feature
- From the NF home page, click any new feature pipeline or regression pipeline where you want to run this plugin.
- In the left navigation pane, click Test Results
Analyzer.
When the build completes, the test result report appears. A sample test result report is shown below:
Figure 2-67 Test Results Analyzer Option
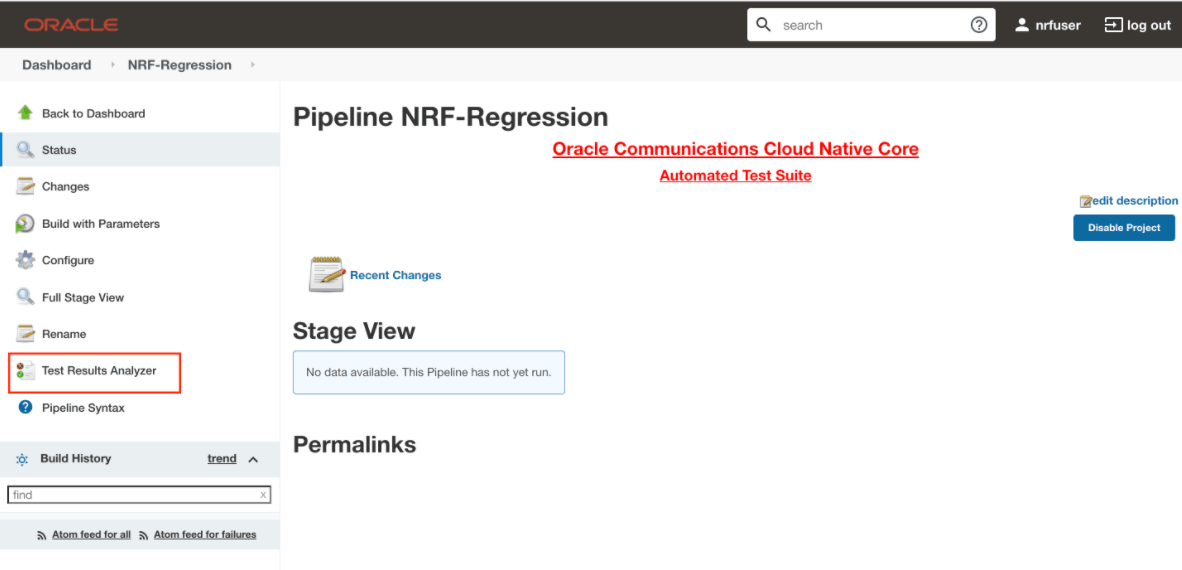
Figure 2-68 Sample Test Result Report
- Click any one of the statuses (PASSED, FAILED, SKIPPED) to view the
respective feature detail status report.
Note:
For N/A status, a detailed status report is not available.Figure 2-69 Test Result

Figure 2-70 Test Result

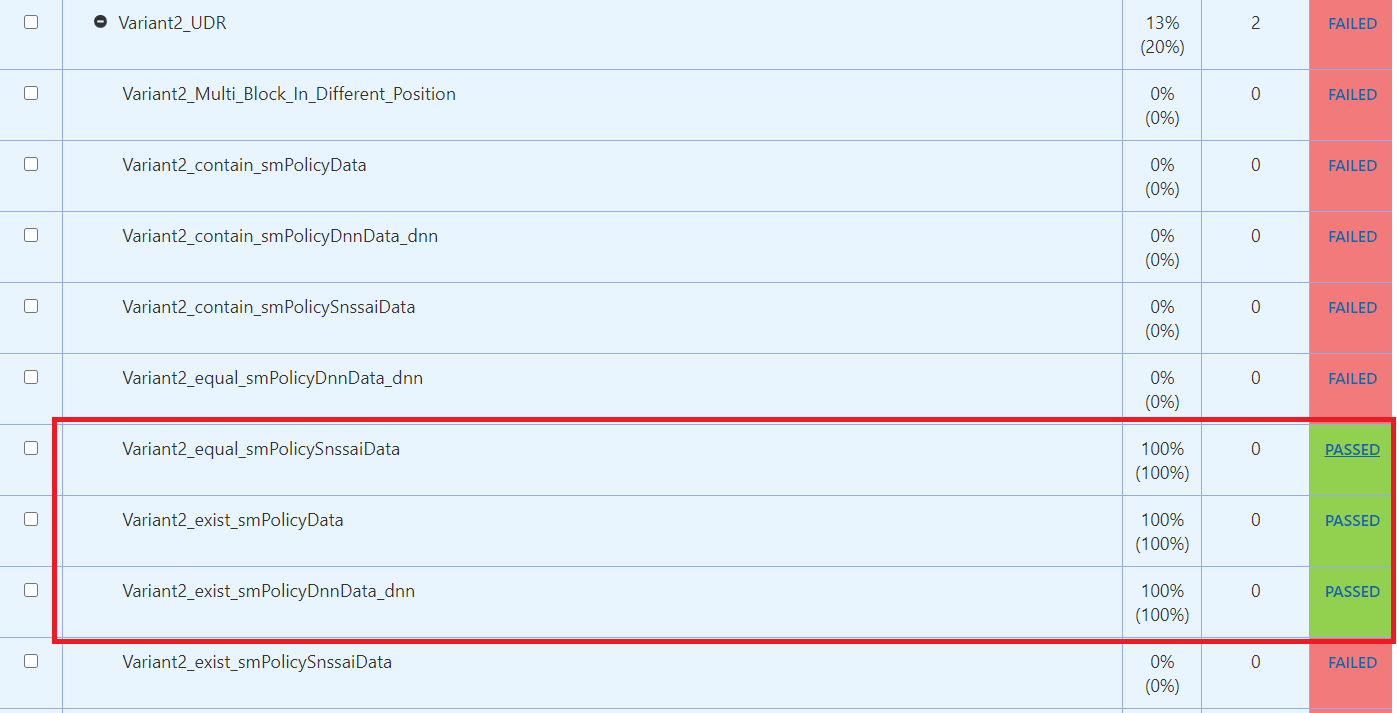
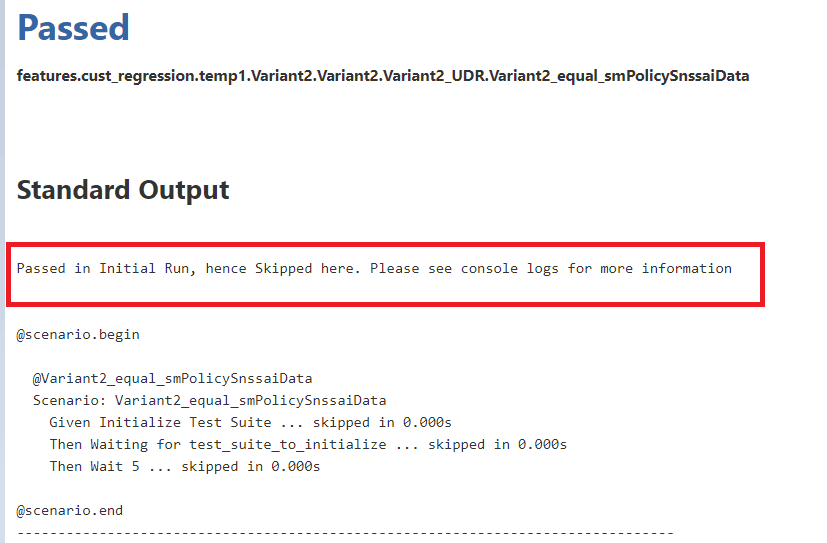
- In the case of a rerun, the test cases that passed in the initial
run but were skipped in the rerun are considered "passed" in the Test Results
Analyzer Report. The following screenshot depicts the scenario:
"Variant2_equal_smPolicySnssaiData,Variant2_exist_smPolicyData,Variant2_exist_smPolicyDnnData_dnn"
where the test cases passed in the initial run but skipped in the rerun are
considered "passed" in general.
Figure 2-71 Test Results
- Click PASSED. The following highlighted
message means the test case was passed in the main run but skipped in the
rerun.
Figure 2-72 Test Result Info
2.18 Support for Test Case Mapping and Count
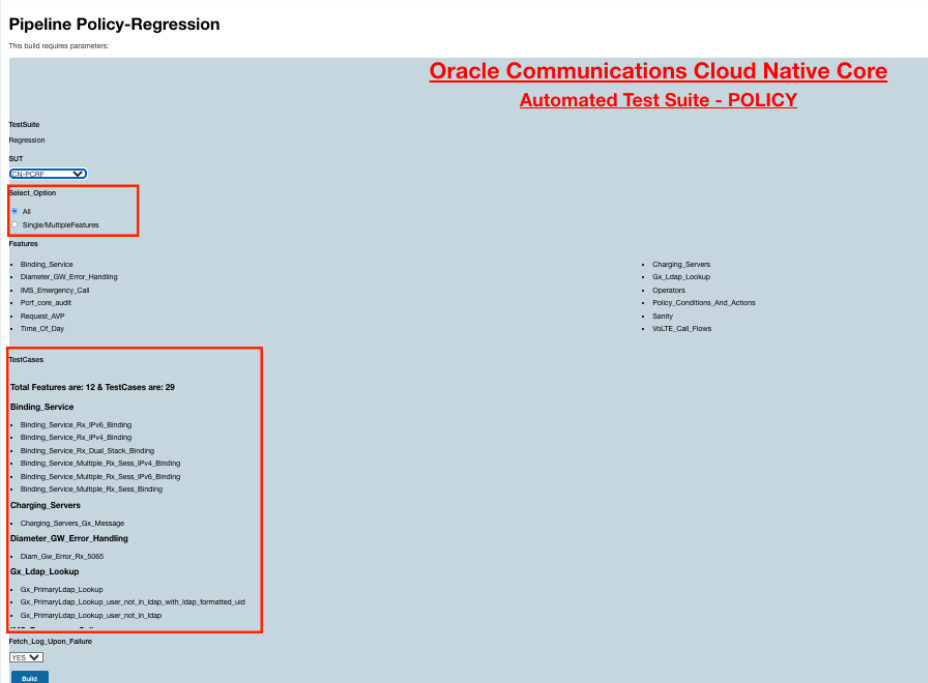
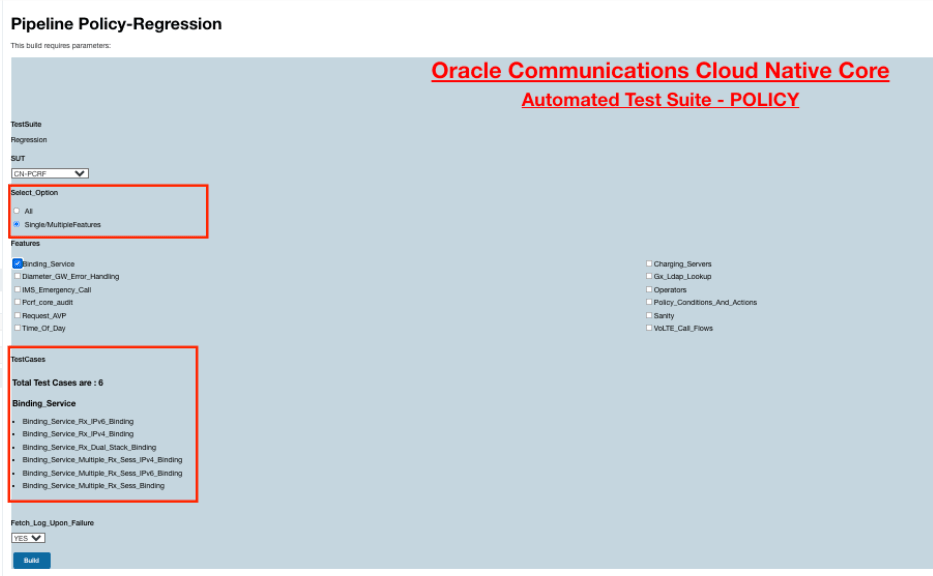
The Test Case Mapping and Count feature displays the total number of features, test cases, or scenarios and their mapping to each feature in the ATS GUI.
2.18.1 Access Test Case Mapping and Count Feature
- On the NF home page, click any new feature or regression pipeline where you want to use this feature.
- In the left navigation pane, click Build with Parameters.
- Select All from the Select_Option to view the TestCases
details mapped to each feature.
Figure 2-73 Test Case Mapping
- Select Single/MultipleFeatures from the Select_Option to view
the the test cases details.
Figure 2-74 Test Cases Details When Select_Option is Single/MultipleFeatures
2.19 Support for Transport Layer Security
Currently, ATS is accessible through HTTP, which can raise security risks.
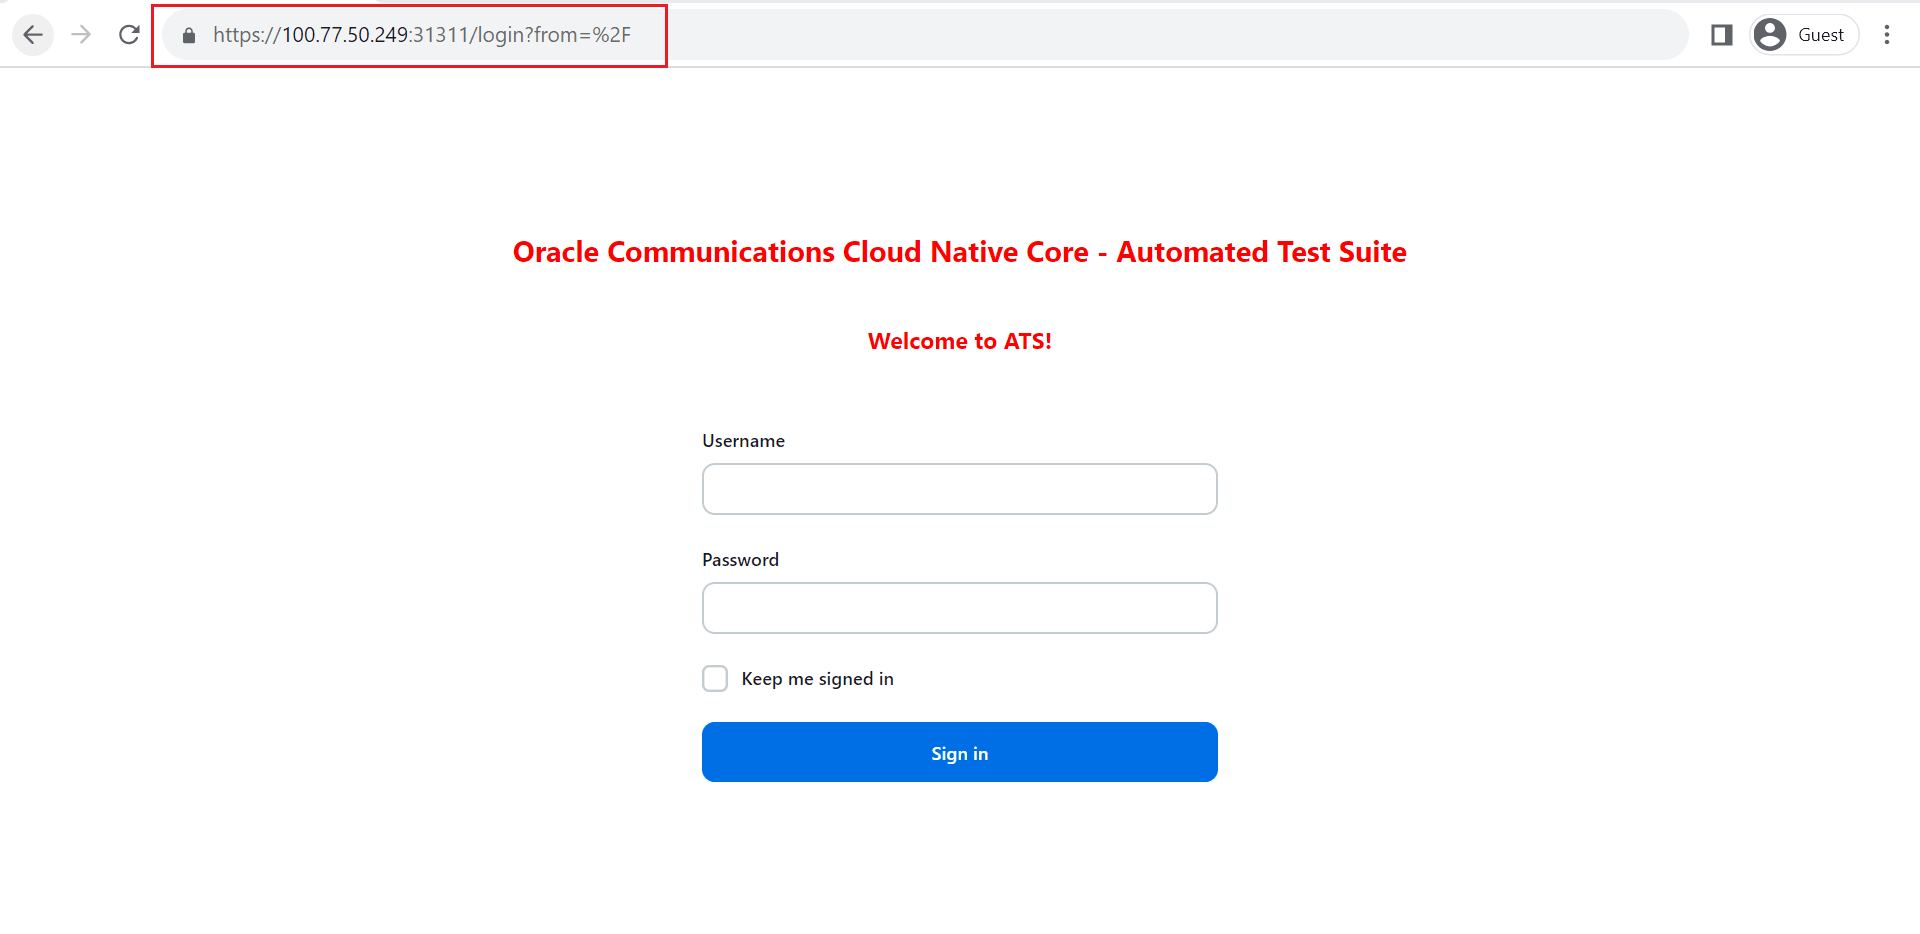
With the support of the TLS feature, Jenkins servers have been upgraded to support HTTPS, ensuring a secure and encrypted connection when accessing the ATS dashboard.
To provide encryption, HTTPS uses an encryption protocol known as Transport Layer Security (TLS), which is a widely accepted standard protocol that provides authentication, privacy, and data integrity between two communicating computer applications.
Figure 2-75 Access with TLS
Note:
If this feature is not enabled before installation, HTTP will continue to operate.