Devices
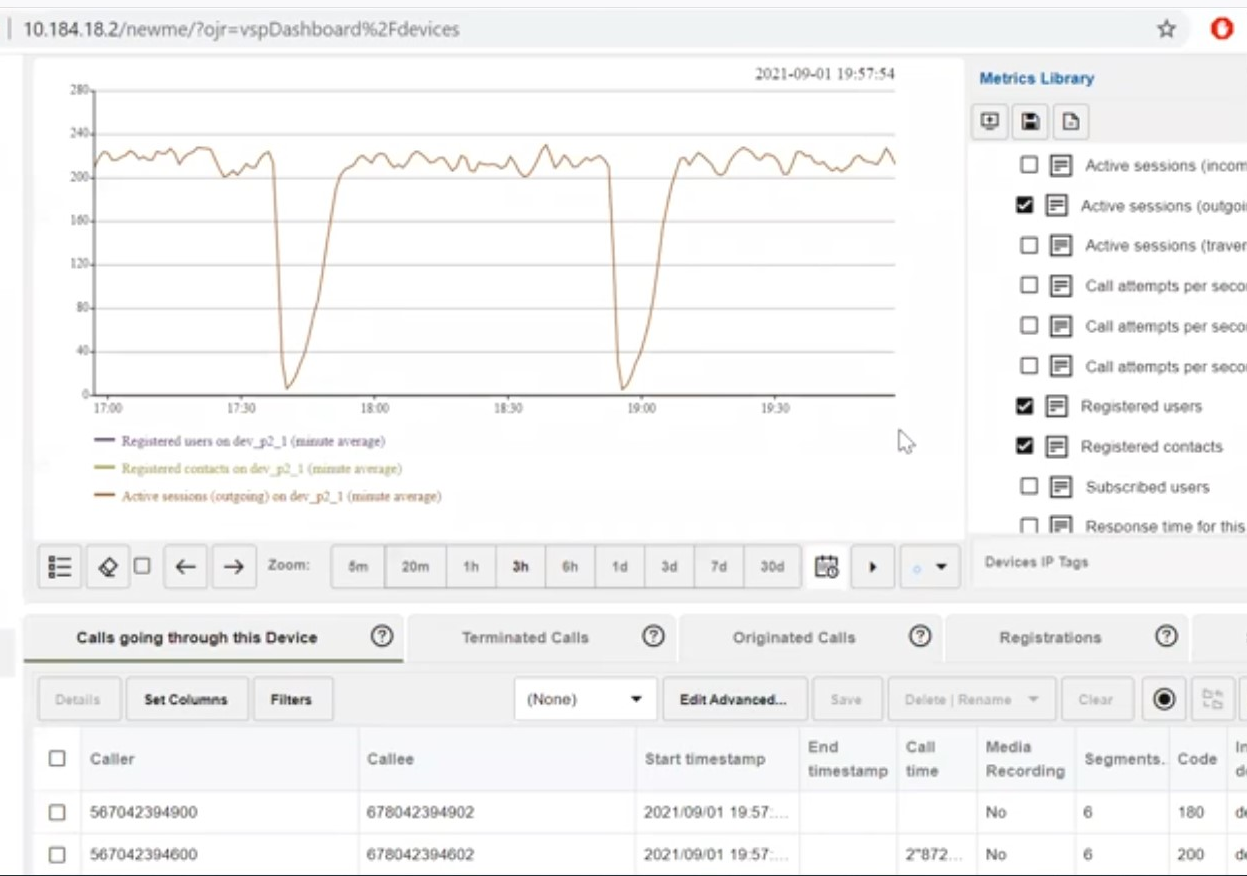
The Devices page shows not only an overview of all configured platform devices, but it also aggregates information about each individual platform device. To use it, the platform devices (or trunks) have to be configured in the platform settings. For more information, see "Platform Devices". This page contains a device selection drop-down menu, a device metrics chart, and a tab panel providing details about calls, registrations, and voice quality for the selected device.
Figure 4-76 Devices Page
Device Map
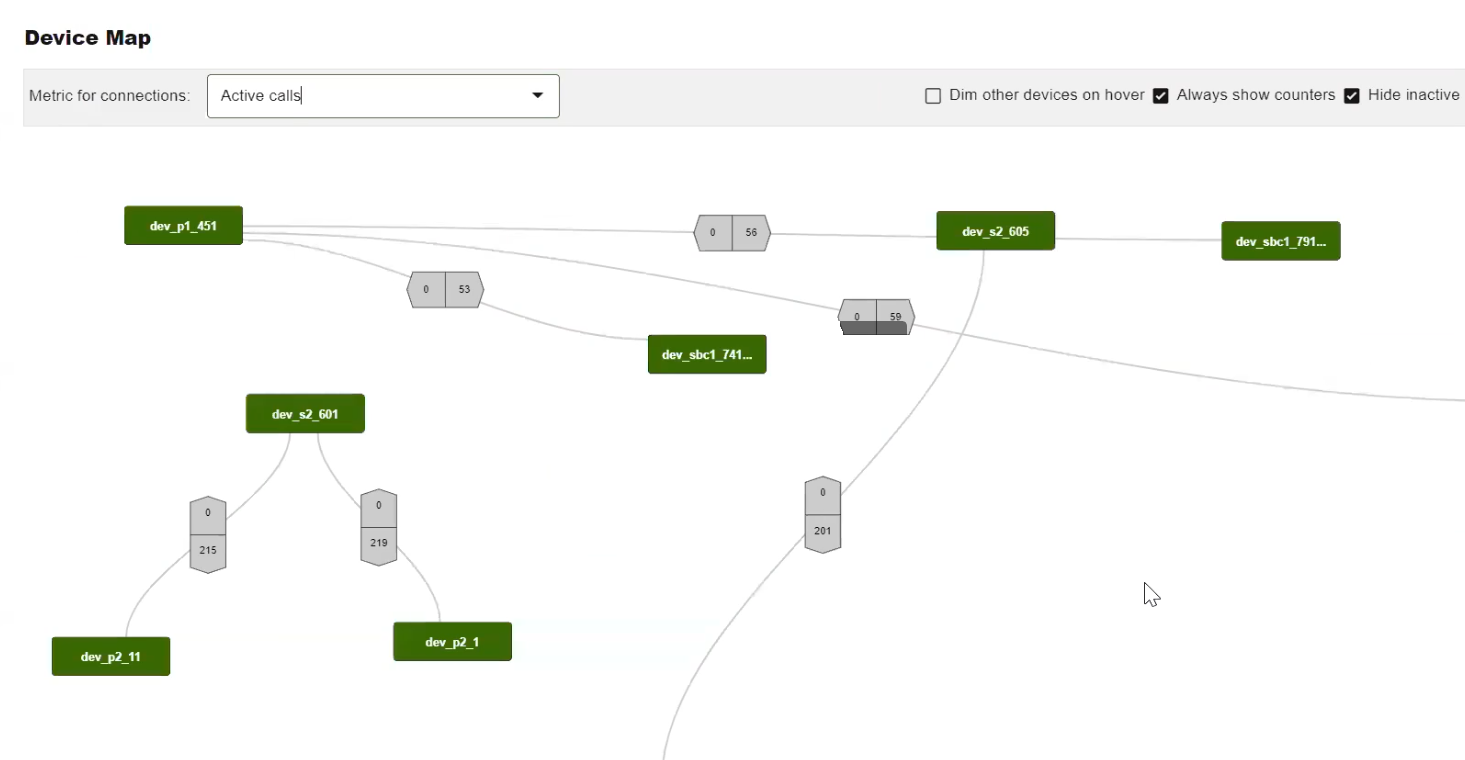
You can display a map of devices by clicking on Device Map button. It shows an overview of the status and activity for all configured devices on the monitored platform. The devices are displayed as nodes on a topological graph; activity between nodes is shown in the lines connecting them. From this page it is easy to monitor platform activity and status.
Figure 4-77 Device Map
Note:
With 4.4 enables the displays of Trunk Devices on the Device Map page.Once added, you can drag and drop devices around the page to best represent the local network topology. There is a Reset Layout button on the toolbar to reset the page.
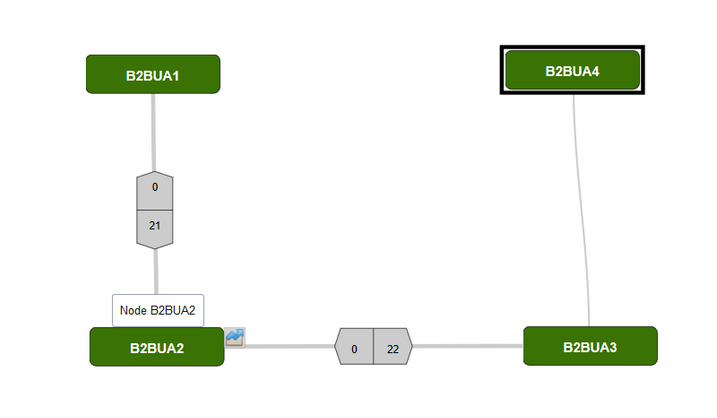
Hover over the node with the mouse cursor to show the inbound and outbound value of the displayed metric of a node.
Figure 4-78 Hovering Over a Device to Display the Active Metric
Note:
A maximum of 50 devices can be enabled for the Device Map.Device Map Toolbar
The Devices page has view display options, which are configurable through controls on the toolbar.
shows the display options that are available on the Device page toolbar.
Figure 4-79 Device Map Toolbar

The display options are as follows:
-
Metric for Connections
Select the metric to be displayed.
- Dim other devices on hover
Select this option to dim other devices when you hover over a specific device.
-
Always show counters
Select the Always show counters check box to change the above device hovering behavior so that Operations Monitor always shows metric data.
-
Hide inactive
Select the Hide inactive check box to hide devices that are not interacting with others. This can often help de-clutter the display. When the page data is refreshed all devices are checked to see whether they have become active.
-
Reset layout
Applies the default layout if the configuration by the user via dragging and dropping becomes unmanageable.
-
Refresher
The Devices page features a Refresh button to control the update interval for the metric data contained in the page. For more information, see " Refresh Button ".
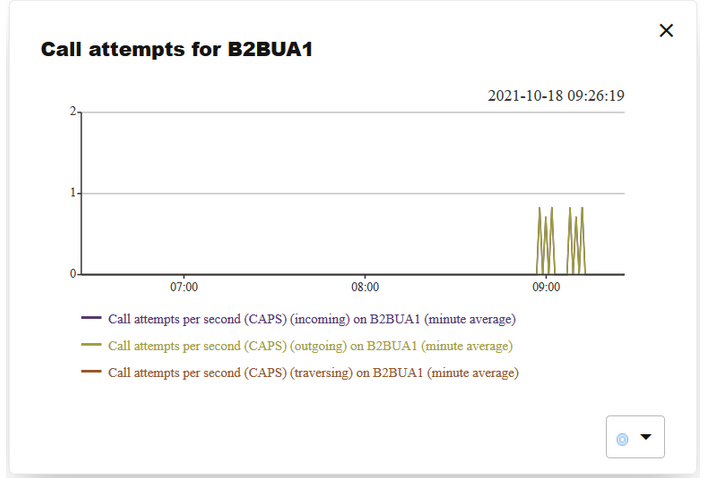
More detailed information about the selected metric can be displayed per-device by clicking on the Details button that appears overlaid on a device while hovering:
Figure 4-80 Click on a Device to Display Detail Information About the Active Metric
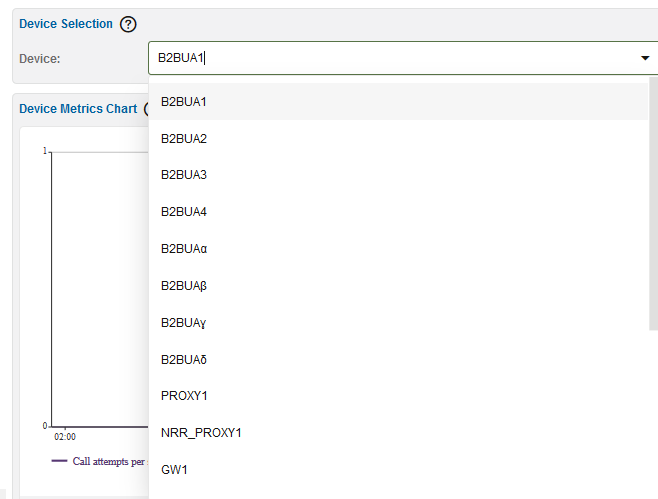
Device Selection Panel
The Device Selection panel determines the device whose details are displayed on the page. Select a device from the drop-down menu.
Figure 4-81 Device Selection Panel
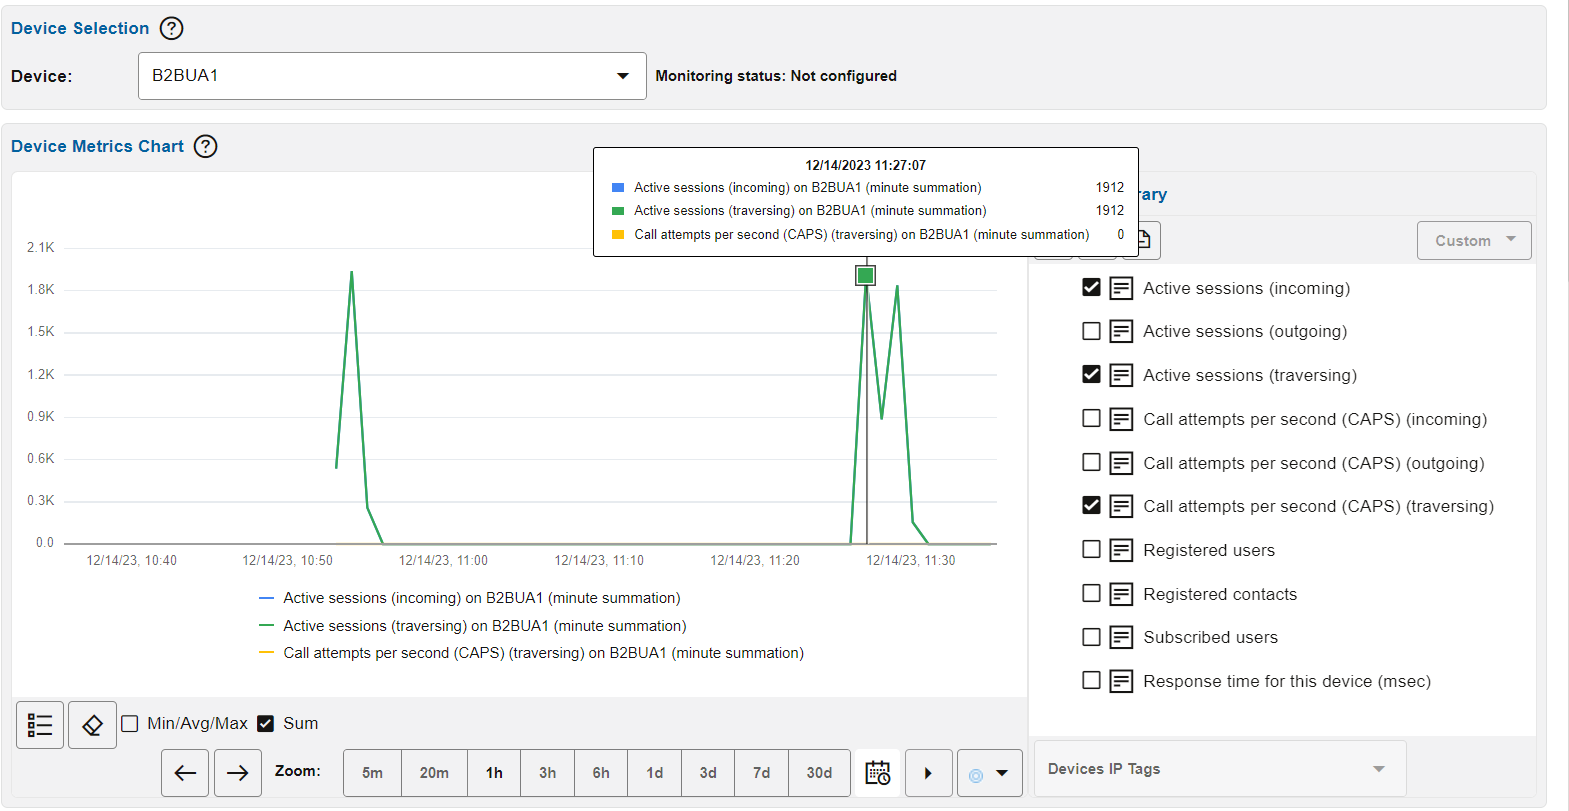
Device Monitoring Status
The Device Selection panel displays the monitoring status for the current device. This information is available only if device monitoring is configured for that specific platform device.
To configure device monitoring, refer to "Platform Devices" and "Device Monitoring".
Figure 4-82 Device Monitoring Status

Device Metrics Chart
The Device Metrics Chart displays the evolution of the selected device metrics from the Metrics Library. For more information about the Metrics Library, see " KPI/Metrics ". Device metrics are special as they measure properties connected to a certain platform device.
Figure 4-83 Device Metrics Chart
Note:
You can select up to five metrics by marking the check box of the desired metric.- In the Metrics Library section:
- Click Show in Dashboard to add the Device Metrics Chart to the Dashboard by
- Click Save Selection to save the current set of selected metrics for the specific device in the Device Metrics chart.
- Click Clear Selection to clear the current set of selected metrics for the specified device in the Device Metrics chart.
- At the bottom of the Device Metrics chart:
- Click CSV Export information displayed in the chart to export the chart metrics to .CSV file.
- Click the Show Min/Avg/Max check box, this check box controls whether minute or hour minima and maxima are displayed for each selected metric.
- Click the Sum check box to view
the sum values of the selected KPI metrics. The Sum values for 1 hour, 3 hours, 6
hours, and 1 day are displayed in minutes, whereas the sum values for 3 days, 7
days, and 30 days are displayed in hours. You cannot view the sum values for 5
minutes and 20 minutes. The sum values can be exported to .CSV file using the CSV
Export option.
This table represents the states shown on the UI of the Device Metrics chart.
Table 4-21 UI States
Option Selected UI State None (Default) The average value of selected KPI is displayed in the chart. Sum check box selected The sum value of the KPI is shown on the chart. Only min/max/avg check box selected The min/max/avg value of KPI will be shown on the chart. Sum and min/max/avg check boxes are selected Both values are shown on the chart. Note:
The metric Synthetic KPI cannot be viewed as a sum value.
The other controls are described in the section on chart panels. For more information, see " Charts ".
Calls Going Through This Device Tab
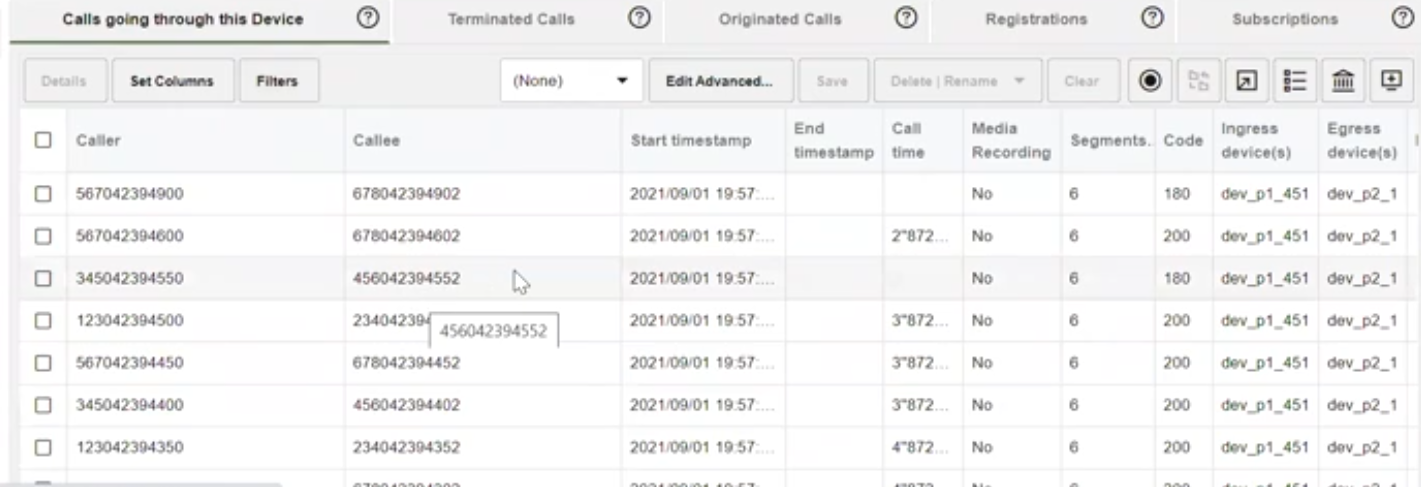
The Calls going through this device tab is similar to the Recent calls panel described in the "Calls" section. The table displays only the calls that have an inbound leg to the current device and an outbound leg from the current device.
Figure 4-84 Calls Going Through This Device Tab
Terminated Calls Tab
The Terminated calls tab is exactly like the Recent calls panel described in "Calls". The table displays only the calls which have an inbound leg to the current device. Terminated calls do not have an outbound leg from the current device.
Figure 4-85 Terminated Calls Tab

Originated Calls Tab
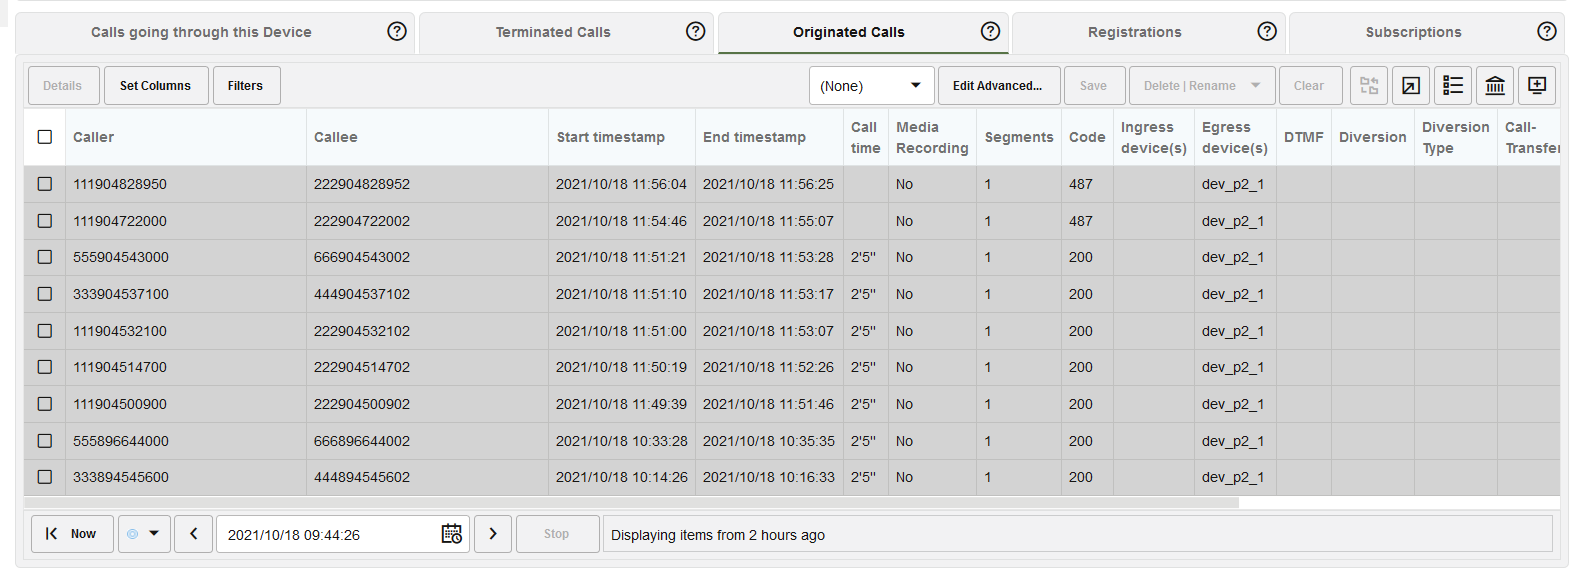
The Originated calls tab is exactly like the Recent calls panel described in "Calls". The table displays only the calls which have an outbound leg from the current device. Originated calls do not have an inbound leg to the current device.
Figure 4-86 Originated Calls Tab
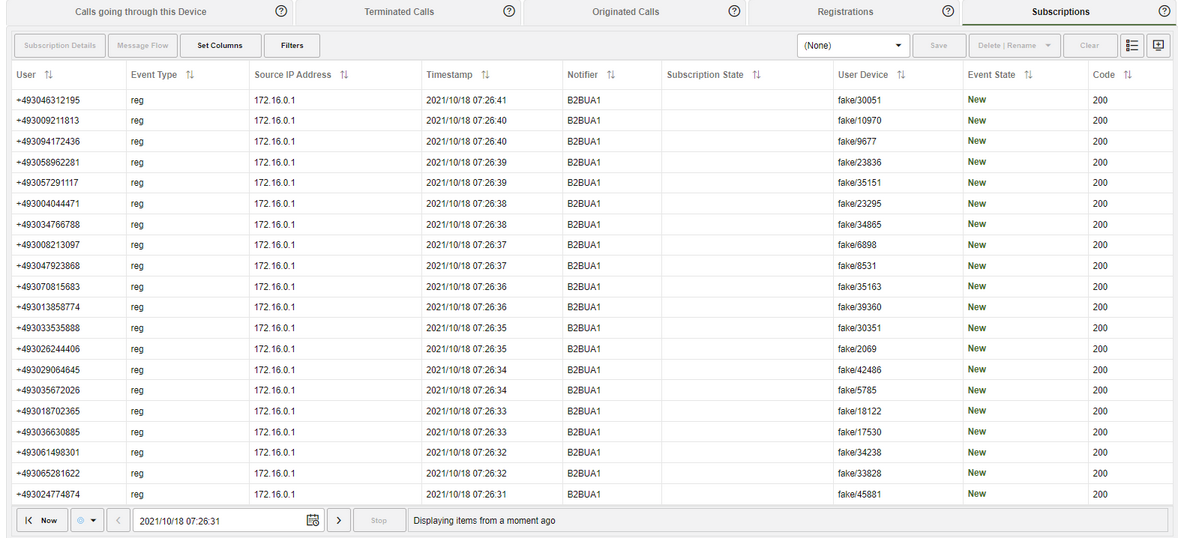
Registrations Tab
The Registrations tab is similar to the Registrations panel described in "Registrations". However, it only displays registrations which are handled by the current device.
Figure 4-87 Registrations Tab

Note:
The Registrations tab is not available for gateway devices and trunks.