KPI/Metrics
The KPI/Metrics page provides standards of measurement by which efficiency, performance, progress or quality of the platform are assessed. Such measurements are called metrics or Key Performance Indicator (KPI).
A metric is a measurement of a numeric property on the monitored platform. Operations Monitor evaluates the metric every second, and aggregates the values into minute and hour averages, minima and maxima. Additionally, it keeps a history of the following increments: one hour, minute and hour averages, and minimum and maximum values.
Operations Monitor offers a wide range of predefined metrics, and allows you to create new ones. Thus, each realm defined in Operations Monitor can have its own personalized list of defined metrics. Operations Monitor users associated to a realm are able to see and change only the metrics defined for that realm. For more information about realms, see "Realms Definitions". Operations Monitor users can save their most used metrics into a Favorites list.
You can create an average of a metric in Operations Monitor. For example, this is useful if a provider wants to be notified when the number of active calls drops below a certain threshold, but not taking into account the low number of calls during night or weekends. In this case, an average of the active calls during the working days is useful. For information on how to configure this feature, see "Average Metrics/KPIs".
A KPI is a combination of metrics, and is usually defined as ratio of other metrics. Operations Monitor supports the IETF KPIs defined in the RFC 6067, https://tools.ietf.org/html/rfc6076.
The evolution of any metrics or KPI is presented in the chart in the upper area.
KPI/Metrics Monitoring Chart
The KPI /Metrics Monitoring chart displays the evolution and history of up to five measurements, including the average values as well as minimum and maximum values.
This chart operates like others in you can zoom out to see the evolution through the past, zoom in and scroll to the present, or pan to a specific time. For more information, on how to use Operations Monitor charts, see " Charts ".
Figure 4-1 KPI/Metrics Monitoring Chart
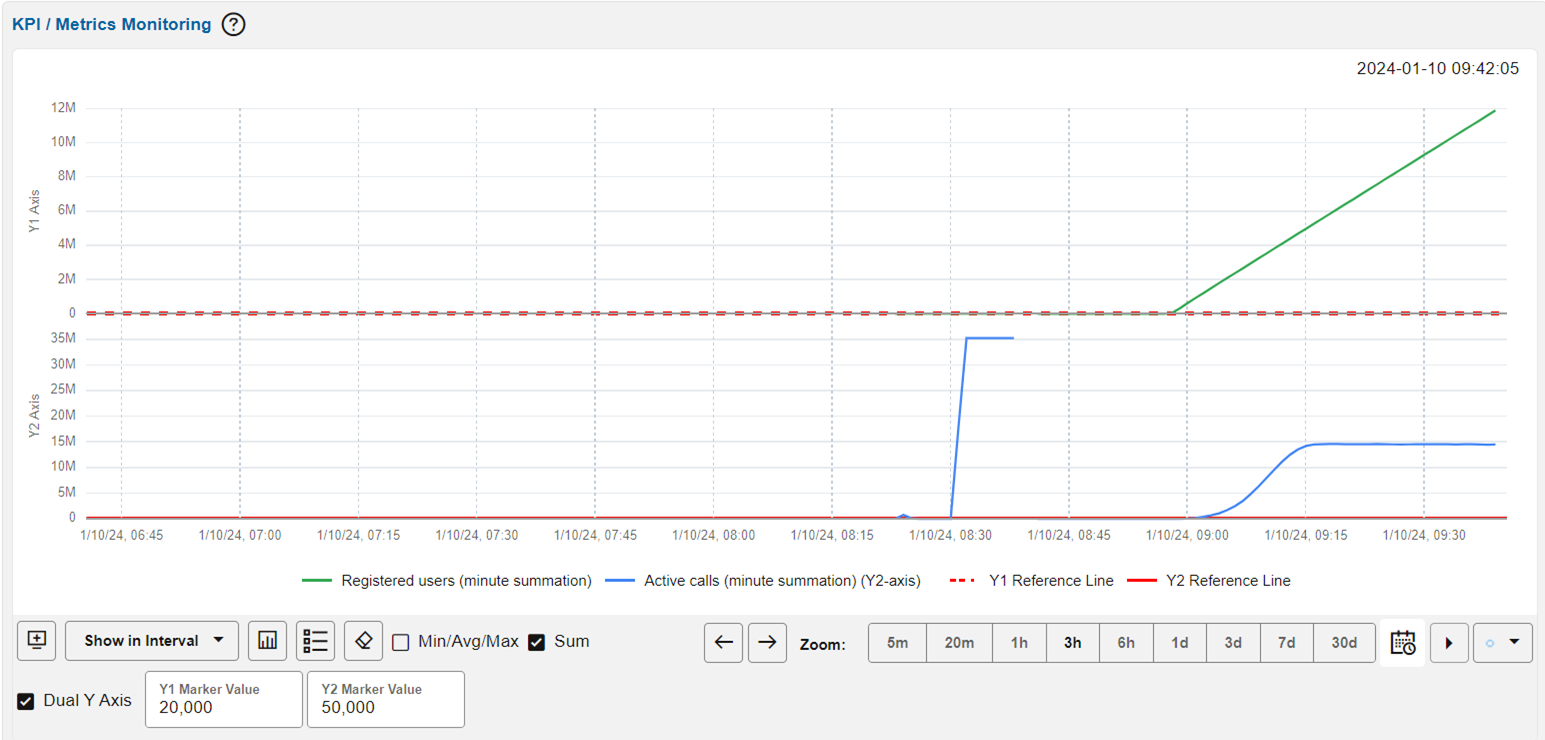
- At the bottom of the KPI Metrics chart:
- Click Show in Dashboard to add the KPI Metrics Chart to add the chart to the Dashboard.
- Click Show in Interval to chart to select Calls, or Registrations, or Subscriptions aligned to the time interval of the chart.
- Click Export Chart to export the chart as an .SVG graphic.
- Click CSV Export of information displayed in the chart to export the chart data to a .CSV file.
- Click Clear Chart to clear the chart and deselect the KPIs selected. This makes the chart area empty.
- Click the Min/Avg/Max check
box. This check box controls whether minute or hour minima and maxima are displayed
for each selected metric.
To display the minimum, average and maximum values of the metrics on the chart, mark the Show Min/Avg/Max box at the bottom of the panel. Note that min, average, and max only show meaningful differences when using larger temporal resolutions.
- Click the Sum check box to view the
sum values of the selected KPI metrics. The Sum values for 1 hour, 3 hours, 6 hours,
and 1 day are displayed in minutes, whereas the sum values for 3 days, 7 days, and
30 days are displayed in hours. You cannot view the sum values for 5 minutes and 20
minutes. This table represents the states shown on the UI of the KPI Metrics
chart.
Table 4-1 UI States
Option Selected UI State None (Default) The average value of selected KPI is displayed in the chart. Sum check box selected The sum value of the KPI is shown on the chart. Only min/max/avg check box selected The min/max/avg value of KPI will be shown on the chart. Sum and min/max/avg check boxes are selected Both values are shown on the chart. Note:
The metric Synthetic KPI cannot be viewed as a sum value. -
The sum values can be exported to .CSV file using the CSV Export option.
- While adding a panel in the dashboard, the state of the KPI/metrics chart (with the min/max/avg check box and the Sum check box option is enabled) is carried over in the Dashboard panel too. When you want to view the to the KPI/metrics graph from the Dashboard panel, and if the sum value of the KPI was already contained in the Dashboard panel, the sum value is reflected in the KPI/Metrics page also.
The other controls are described in the section on chart panels. For more information, see " Charts ".
To display the units for the KPIs for any part of the chart, hover the mouse on the chart.
To display the KPI/Metrics in the Monitoring chart, you must mark the metric in the Library: Platform-Wide Metrics and KPIs section. For more information, see " Library: Platform-Wide Metrics and KPIs ".
KPI/Metrics Monitoring Grid
The KPI/Metrics Monitoring panel contains a Favorites list created by the Operations Monitor user that displays the metrics they are most interested. The Library provides available metrics and KPIs to select, view, mark as favorite and customize.
Figure 4-2 KPI/Metrics Monitoring Library and Favorites

Library: Platform-Wide Metrics and KPIs
The metrics measured on the entire platform are presented in the Platform-wide tree under the following three sections:
-
Defined metrics is the first, unnamed section and where the most common metrics appear.
-
IETF KPIs and metrics contains the KPIs as defined in the RFC 6067 (https://tools.ietf.org/html/rfc6076).
-
Advanced metrics is the section where you can configure customized metrics.
Pre-Defined Metrics
Operations Monitor adds the most frequently used metrics at the top of the list:
-
Active calls.
-
Registered users.
-
Registered contacts.
-
Call attempts.
-
Call established.
-
Closed calls per second.
To view a metric from the library in the chart above, you must mark the check box. By default, the Active calls metric is displayed.
IETF KPIs and Metrics
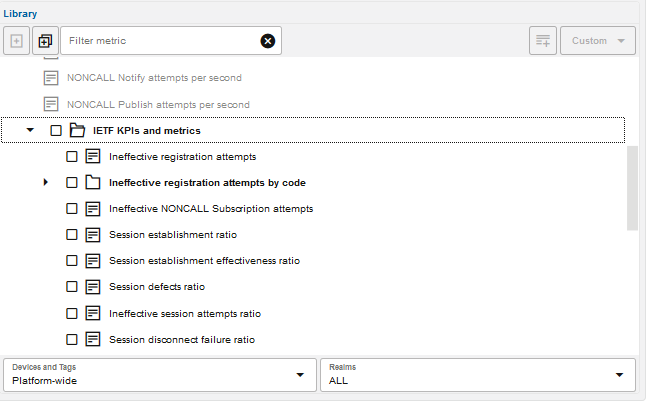
In the IETF KPIs and metrics section are the KPIs defined in the RFC 6067, https://tools.ietf.org/html/rfc6076. A list of IETF KPIs is shown.
Figure 4-3 IETF KPIs
Note:
Two KPIs are calculated only on ingress legs.
For example, the IETF KPIs, Session Duration Time and Session Disconnect delay are calculated only on ingress call segments. An ingress call segment is the one where the call enters the system (the destination is a configured platform device but the source is not).
Enabling Metrics
The metrics displayed in gray text are inactive. Operations Monitor measures these metrics when you activate them. To enable a metric, click on the gray metric. The Inactive Metric window appears. Click Yes to confirm.
After a metric is activated, the metric text is displayed in black. This signifies that Operations Monitor is providing values for this metric, and you can view its evolution in the chart by marking its check box.
Some KPIs will not provide values for users in a realm. These KPIs are calculated on the transport level when the Ethernet frame is decoded. It is not possible to provide these values for users in a realm. These KPIs are:
-
Bandwidth of the UDP packets
-
Bandwidth of the TCP packets
-
Bandwidth of the SCTP packets
These KPIs appear as disabled. Enabling them does not provide any value to a user in a realm.
Configuring KPIs
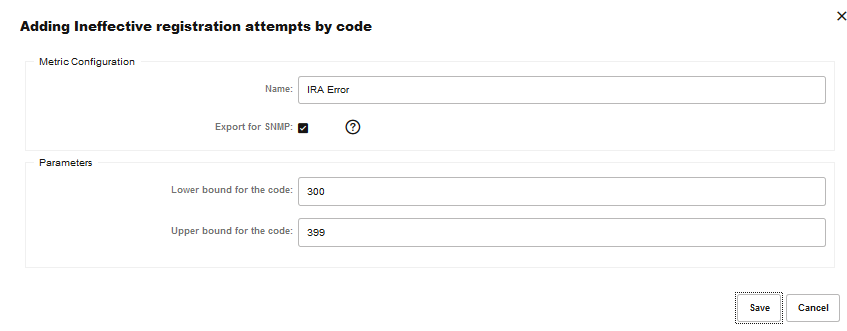
The Ineffective registration attempts by code KPI is configurable. It requires an interval of codes to be specified in order to be activated. Thus, you can customize its own KPI by adding the lower code, the upper code and the name of the new created metric as shown.
Figure 4-4 Define Ineffective Registration Attempts (IRA)KPI
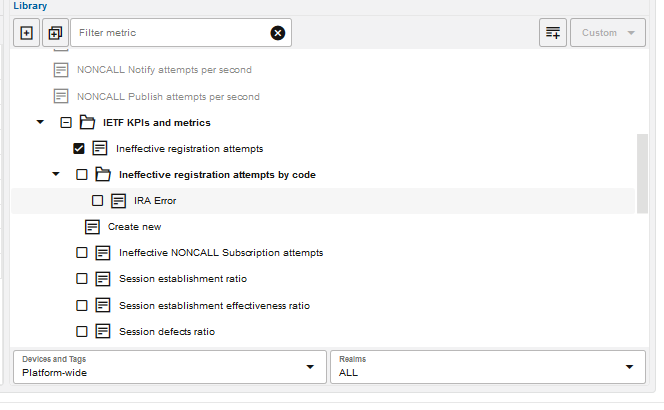
The newly defined KPI is added in the Ineffective registration attempts by code folder as shown.
Figure 4-5 Personalized IETF KPI
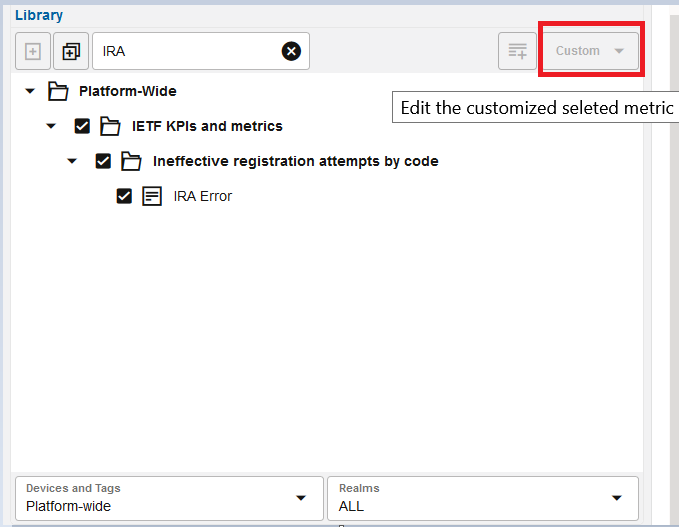
The user defined metrics can be later edited or deleted by clicking on the Custom button as shown.
Figure 4-6 Edit the Customized Selected Metric
Exporting to SNMP
You can access each core metric through an external application via SNMP. To enable exporting to SNMP, select the metric in the library and click the Custom button. Select Edit custom and mark the Export to SNMP check box. For so-called compound metrics, an export is not possible and the check box is not available.
Advanced Metrics
Metric types are grouped into the following categories:
-
Number of ISUP Q.850 cause codes
Measures the sniffed ISUP traffic with certain Q.850 cause codes.
-
Network
Measures transport layer properties, such as the number of TCP streams or the number of SCTP packets.
-
SIP traffic
Measures the sniffed SIP traffic, such as the number of SIP requests or the number of certain SIP replies.
-
Megaco/H.248
Measures the amount of Megaco legs that are active, created, or finished.
-
MGCP
Measures the amount of MGCP legs that are active, finished, or completed.
-
SIP transactions
Measures the SIP transactions with certain properties like the number of INVITE transactions that end with an error or the number of failed registrations.
- SIP NonCall transactionsMeasures the SIP NONCALL transactions with properties such as the number of NONCALL transactions with a given method name and the response code or the number of timedout transactions.
Note:
The number of completed NONCALL SUBSCRIBE transactions are not directly proportional to the number of Subscribed Users. That is, for a particular user, there could be several completed NONCALL SUBSCRIBE transactions. So, the number of completed NONCALL SUBSCRIBE transactions could be more than the number of Subscribed Users. -
Calls
Measures the calls with special properties, such as the number of calls with a call length smaller than 30 seconds.
-
Registrations
Measures the registrations with certain properties, such as the number of unauthorized registrations in the last second.
- NONCALL
Measures the failed notifications with special properties, such as the number of failed subscriptions in the last second and number of failed notifications due to timeout or error response.
-
RTCP
Measures the amount of RTCP or RTCP-XR packets and their jitter, delay, and MoScq values.
-
RTCP Usage
Measures the RTCP or RTCP-XR streams.
Library: Per-Device Metrics and KPIs
Operations Monitor can measure metrics for a platform device or specified trunk. In order to enable this feature, you must configure the platform devices (or trunks) in the platform settings. For more information, see "Platform Devices".
In the Library section of the KPI/Metrics page, you must select the device or trunk from the Devices field below the tree of metrics as shown.
Figure 4-7 Selecting a Device
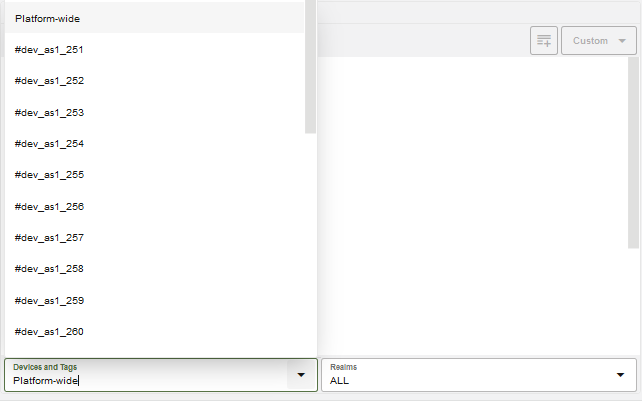
Once you select a device, the metrics are presented in the Library tree.
Note:
Synthetic KPIs appear only when the user selects Platform-wide. This is because Synthetic KPIs are not associated with a specific device.
When you are creating a metric for a device, you must specify whether the metric represents incoming traffic, outgoing traffic, or traversing. For each of the calls metrics, three values are stored:
-
Incoming counts the call legs which have the IP address of the selected device as a destination.
-
Outgoing counts the call legs which have the IP address of the selected device as the source.
-
Traversing counts the calls that are relayed by the selected device. In other words, the calls that have one incoming and one outgoing call leg to/from the device.
If the device is a trunk, incoming is replaced by egress, and outgoing is replaced by ingress, as trunks are always viewed from the platform point of view. For more information, see "Trunks/Prefixes".
Pre-Defined Metrics
Operations Monitor adds the most commonly used metrics at the top of the list:
-
Active calls (incoming).
-
Active calls (outgoing).
-
Active calls (traversing).
-
Call attempts (incoming).
-
Call attempts (outgoing).
-
Call attempts (traversing).
-
Registered users.
-
Registered contacts.
-
Response time (msec).
-
Transit time (msec).
Click the check box from the front of metrics name to see the evolution of one of these metrics in the chart.
-
Transit time
The time difference, in milliseconds, between the first INVITE message from the incoming call leg and the first INVITE message from the outgoing call leg. Only the calls that are relayed by the selected device are counted. To represent these values over time, if more calls are relayed in the same second, the maximum transit time is saved as value for that second. The web interface can then display average and maximum values per minute and per hour.
-
Response time
The time difference, in milliseconds, between the initial request of a non-INVITE transaction and the final answer. Only the transactions, in which the destination IP address is one of the selected device's addresses, are counted.
Note:
The INVITE transactions are not considered here. The INVITE -> 100 time is always small, while the INVITE ->200 time is irrelevant, because it depends on when the callee answers.
IETF Metrics
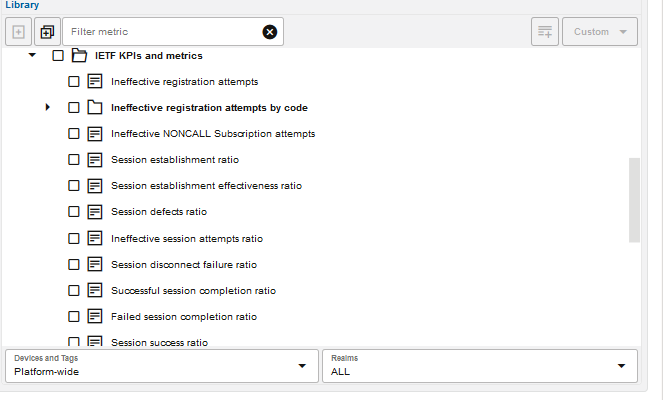
A list of per device performance metrics (KPIs) is displayed in the IETF Metrics section of the library as shown.
Figure 4-8 IETF Device KPIs
Advanced Metrics
The web user can customize his own metrics under the categories presented in the advanced metrics tree.
Metrics displayed in a gray color are inactive and can be activated by clicking on them to bring up a window, as shown.
Once activated, their color becomes black and Operations Monitor starts providing measurements for them.
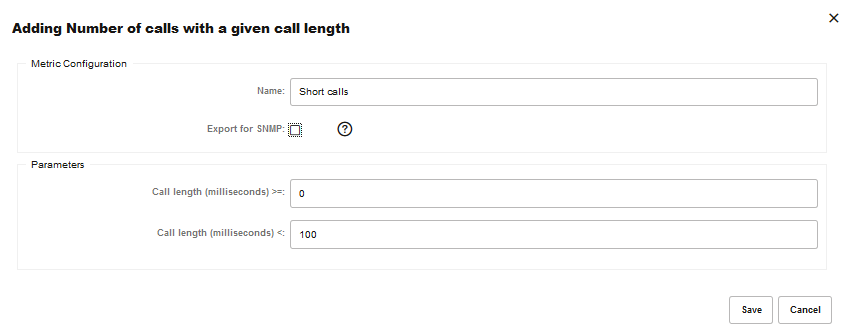
The metrics that share the same properties are grouped in folders and can be easily customized by clicking on the Create new link from the folder. An example of this group might be Number of calls with a given call length. This metric requires a couple of parameters to be configured, such as name, if it is exported via SNMP, direction of the call and the interval of the reply codes.
Figure 4-9 Configure a New Metric
The user defined metrics can be edited or deleted by clicking on the Custom button, as shown in the Custom menu.
The same tree of metrics is displayed under the Devices page as they are configurable for a platform device (or trunk). For more information, see "Devices".
Filtering in the Metrics/KPIs List
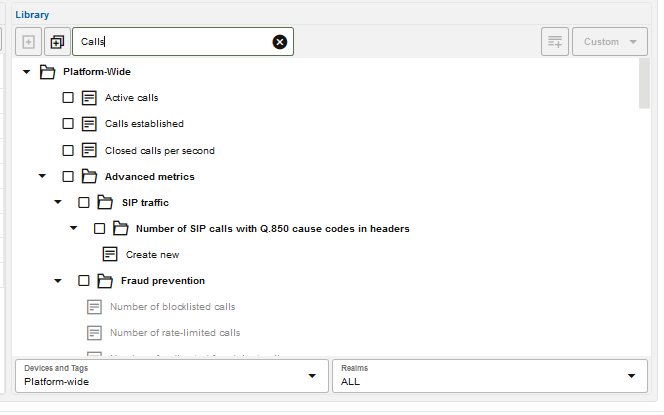
Operations Monitor offers a search box for filtering the metrics by name. For example, if you want to filter the metrics for those that contain 'calls', enter calls into the search box as shown.
Figure 4-10 Filter the Metrics
Restricting the Scope of Metrics/KPIs
You can restrict metrics/KPIs to a subset of the subscriber base using Realms. User based KPIs are enabled per user and are only visible for the user that has created them. Users in the same realm will not be able to see other users KPIs even they share the same realm. For more information, see "Realms Definitions".
The exception to this rule is the admin user who is able to see all metrics defined for each realm. The admin user can select a realm from the Realms list below the metrics tree, as shown.
Figure 4-11 Selecting a Realm
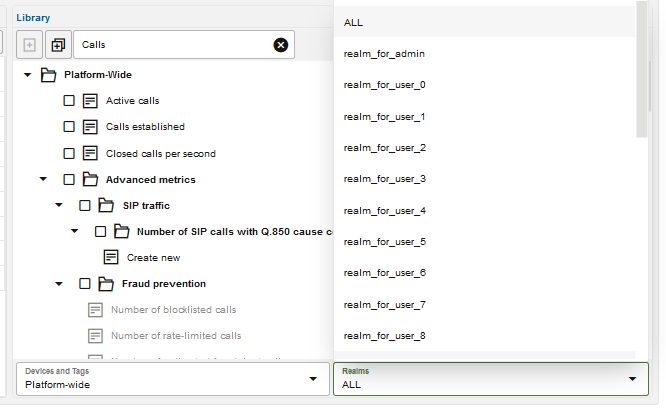
After choosing a realm, the admin user is able to see the metrics tree defined for that realm in the Library panel.
Note:
The default Metrics/KPIs for a realm is created first when a user belonging to that realm logs in. For example, a realm bound user that logs in for the first time might be able to see old calls, but the Active calls metric only has data from the time the user first logged in and onwards.
Average Metrics/KPIs
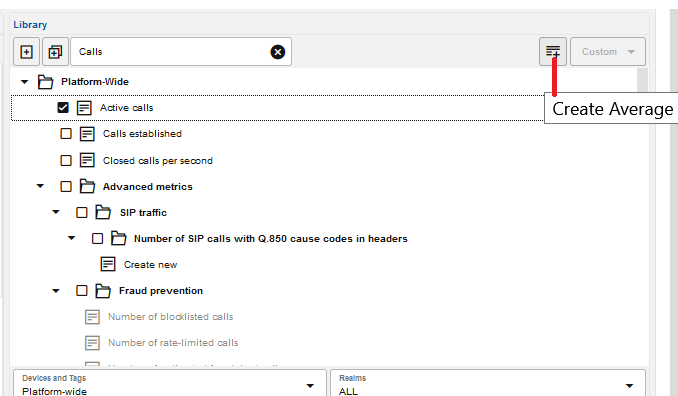
An average metric or KPI can be created from any metric or KPI from the Library panel. In order to generate the average metric, first select the metric or KPI in the Library panel and then click on the Create Avg button.
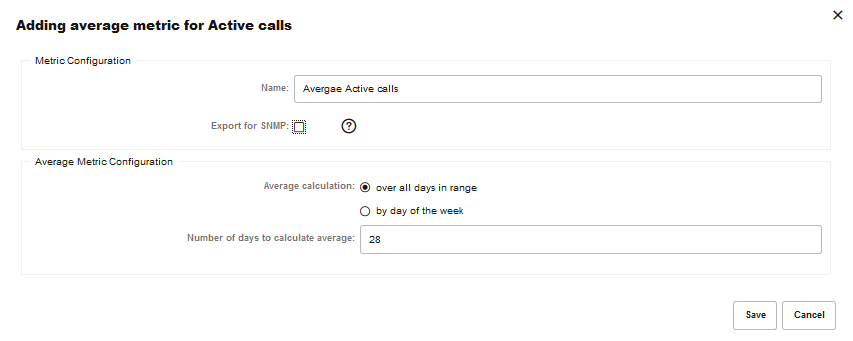
Average metrics require configuration parameters such as a name, specifying if it is exported as SNMP, and the period it is calculated.
Figure 4-12 Configure an Average Metric/KPI
As the traffic during the weekends might be significantly lower than during the working days, Operations Monitor offers the ability to calculate the average only for working days as shows. The period of time for which the average has been calculated is given in number of days.
Figure 4-13 Configuring Average
After the average metric/KPI is created, it is added under the metric or KPI to which it belongs.
Note:
The maximum supported limit for the average KPIs is 100.
Favorite Metrics/KPIs
Any metric or KPI from the Library can be dragged to the favorites list for an at-a-glance view of a small set of metrics. Each Operations Monitor user has their own personalized Favorites list as it is saved by user, as shown.
Figure 4-14 Favorite List of Metrics/KPIs
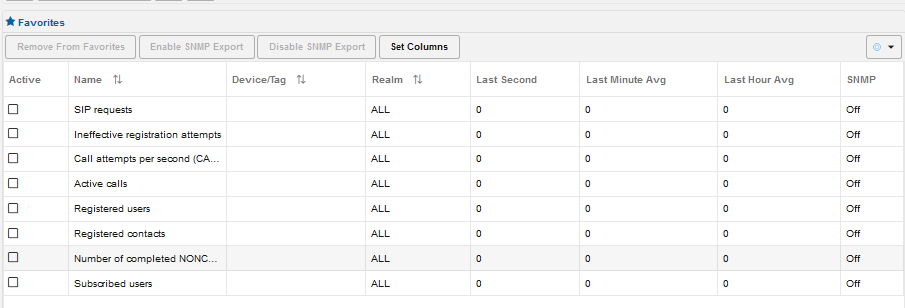
Table 4-2 Favourites in the KPI Metrics screen
| Column | Description |
|---|---|
| Name | Name of the metric. |
| Device/Tag | Device it is measured on. |
| Realm | Realm it belongs to |
| Last second | Value in the last second. |
| Last minute avg | Average on the last minute. |
| Last hour avg | Average on the last hour. |
| SNMP | Is On if the metric is exported with SNMP. Else it is Off. |
Metrics in the Favorites list are displayed with the following information:
Note:
In case of a platform-wide metric, the Device field is empty.
To remove a metric/KPI from the favorites list, first select the metric/KPI, and then click on the Remove from Favorites button. In case you want to enable/disable exporting the selected metric/KPI via SNMP click on the Enable SNMP Export or Disable SNMP Export button.