Devices
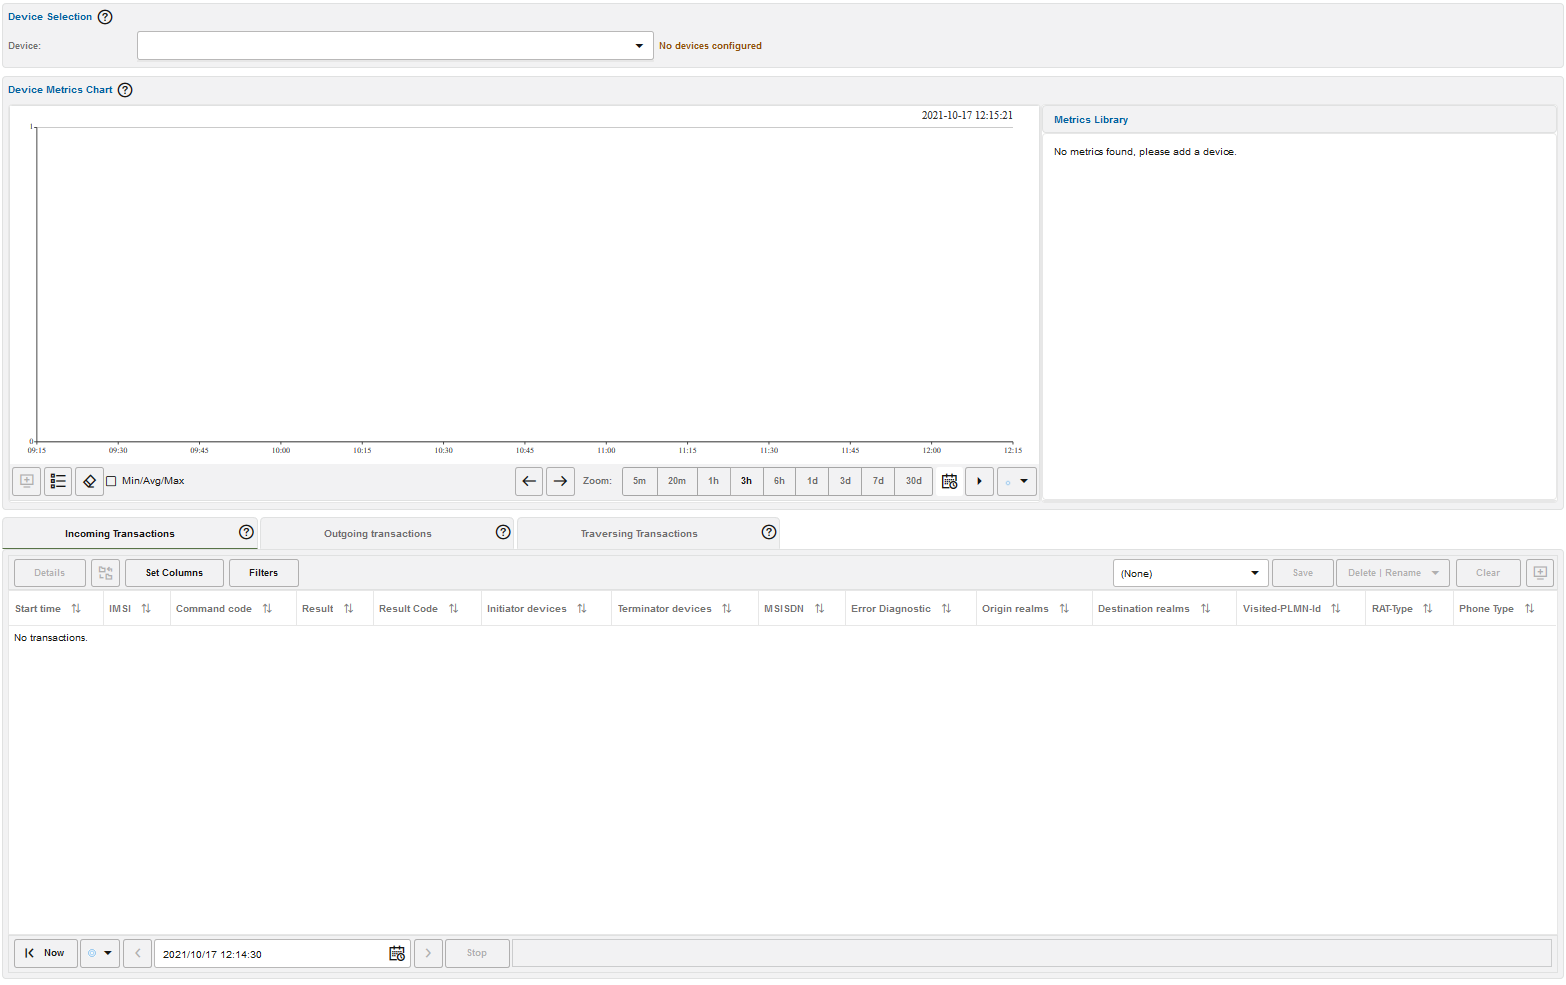
The Devices page offers a device centric view of the Diameter transaction and KPIs.
Figure 6-5 Control Plane Monitor Devices Page

The Device Selection panel determines the device whose details are displayed on the page. Only configured diameter devices are available in this drop down. For example, HSS, Diameter agent, and Diameter proxy. For more information on the diameter devices, see Table 7-5.
The Device Metrics Chart displays the evolution of the selected device metrics from the Metrics Library.
You can add the Device Metrics Chart to the Dashboard by clicking the Show in Dashboard icon button.
At the bottom of the chart, the Show Min/Avg/Max check box controls whether minute or hour minima and maxima are displayed for each selected metric. For more information on the chart panel controls, see " Charts ".
Incoming Transactions
The Incoming Transactions tab is similar with the Recent S6/S13 Transactions panel, which is described in "Transactions". The table displays only the transactions which have an inbound leg to the current device.
Outgoing Transactions
The Outgoing Transactions tab is similar with the Recent S6/S13 Transactions panel, which is described in "Transactions". The table displays only the transactions which have an outbound leg from the current device.