Transactions
The Transaction page is the central repository for transaction analysis in Control Plane Monitor. You can analyze the transaction traversing the platform in real-time or historically. Control Plane Monitor automatically correlates the transactions into End-to-End transactions.
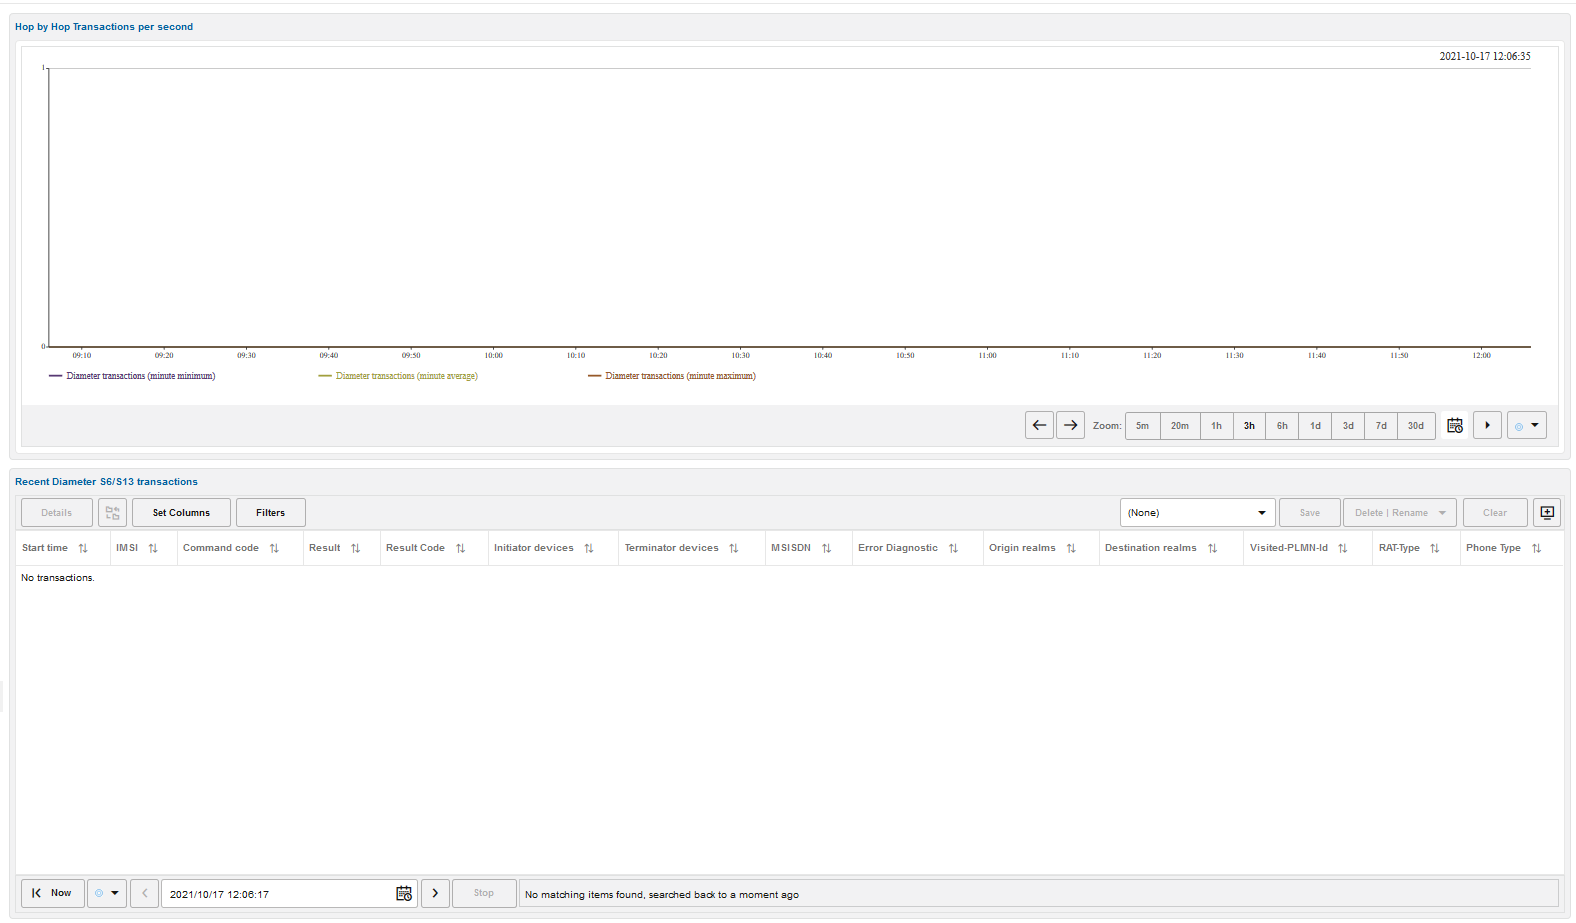
This page contains two panels: the top one shows the Diameter transactions KPI while the bottom one contains the recent S6/S13 transactions.
Figure 6-2 Control Plane Monitor Transactions Page

Filtering Columns
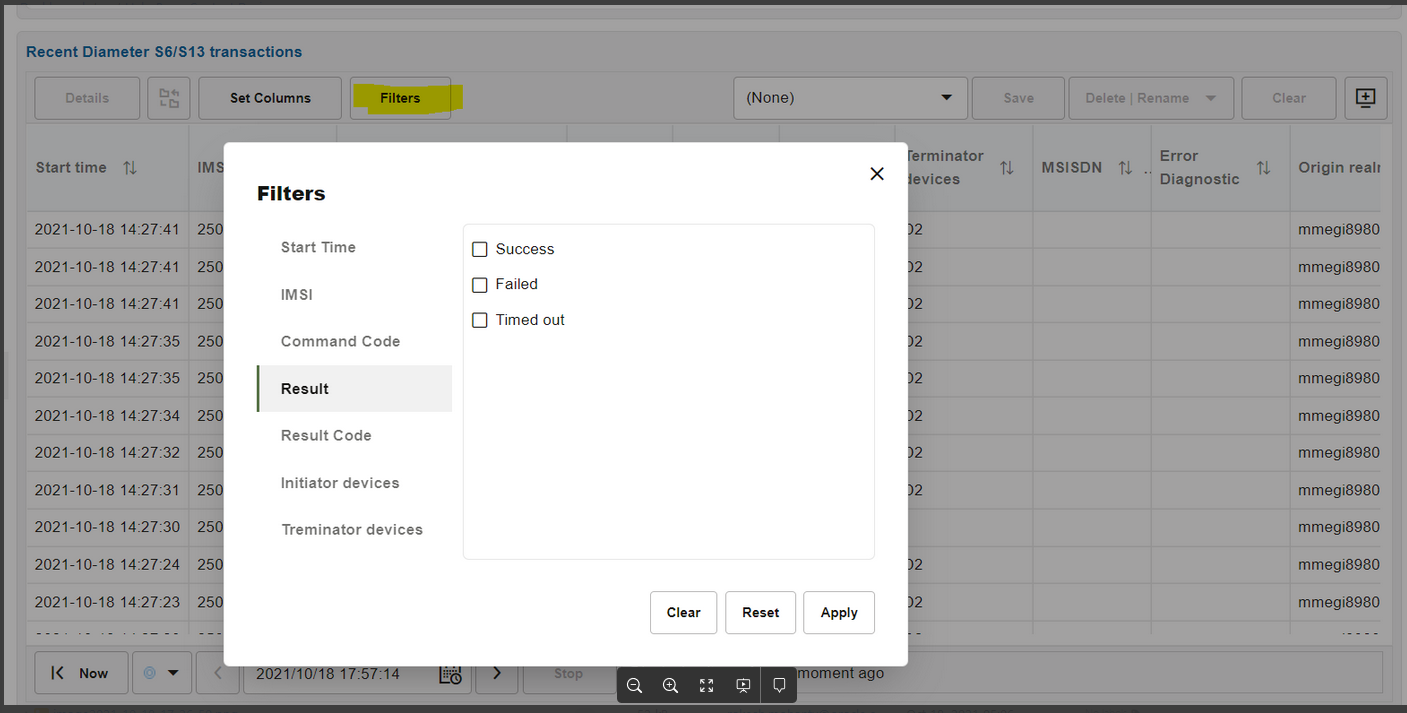
The Transactions table supports Filtering for all columns. For more information, see Filtering
Figure 6-3 Control Plane Monitor Filtering

Transaction Details
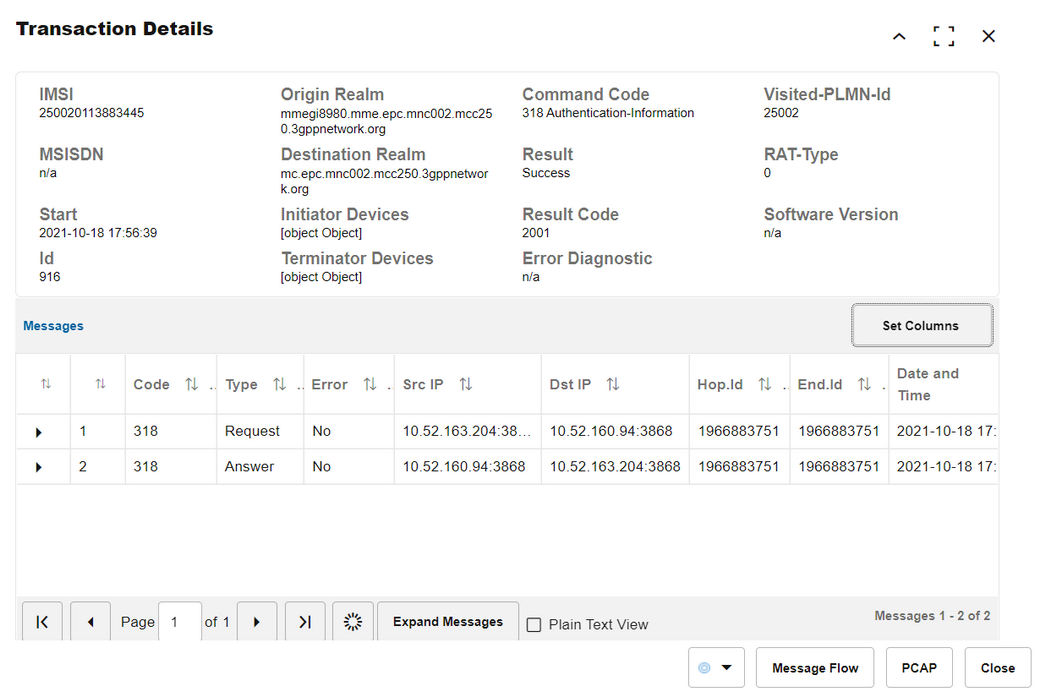
To open the Transaction details window, double-click on a row from the Recent S6/S13 transactions table or select the transaction and click the Details button.
The upper portion for the window contains brief identification information of the transaction: the IMSI, the Diameter realms, the MSISDN and so on.
The bottom portion of the window contains the list of messages composing the transaction. You can drill down in the details of each message by expanding the tree.
Click the Message flow button to open a message flow diagram with the messages involved in this transaction.
To save the raw messages of the transaction into a PCAP file, click the PCAP button.
Figure 6-4 Transaction Details

Message Flow
You can generate a message flow diagram by two means:
-
Select one or more transactions from the Recent S6/S13 Transaction list and click the Draw Diagram button from the top toolbar. To select more transactions, hold the Shift key while selecting.
-
Open the Transaction details window for a given transaction and click the Message Flow window.