3 Getting Started with UTIA
UTIA helps you with a pictorial representation of the topology information that you collect from UIM. You can customize the layouts and other display settings according to your choice. You can customize your search, view and analyze each topology component, its associated resources, and its capacity consumed.
Accessing UTIA
- Use the UTIA application's URL that is generated after configuring
the UTIA microservice in a Kubernetes environment. See Unified Inventory and
Topology Deployment Guide for more information.
Note:
You require SSO credentials to access UTIA. If you have already logged into UIM using SSO credentials, you do not have to log in again to access UTIA. - On the UIM home page, in the left navigation pane, click Topology. This opens the UTIA application's home page in a new tab or browser window. See UIM Online Help for more information.
- Within UIM, open the summary page of a network, and then navigate to the Associated Resources tab. Click View Topology for a resource. This opens the UTIA application and displays the topology graph for the corresponding resource. See UIM Online Help for more information.
- Within UIM, click Topology on the corresponding summary page
of any of the following entities:
- Pipe
- Connectivity
- Equipment
- Physical Device
- Logical Device
- Service
About the UTIA Home Page
On the top-right corner of the UTIA home page, you can find a user profile drop-down list with some options. You can use these options for:
- Opening the UTIA user's guide using Help.
- Logging out of UTIA using Sign Out. This action logs you out of the application and displays the UTIA login page.
You can also access UIM from the General Information tab of a topology component's summary page. See "Accessing UIM from UTIA" for more information.
About the Topology Graph
On the home page, you can search for a topology graph and view it.
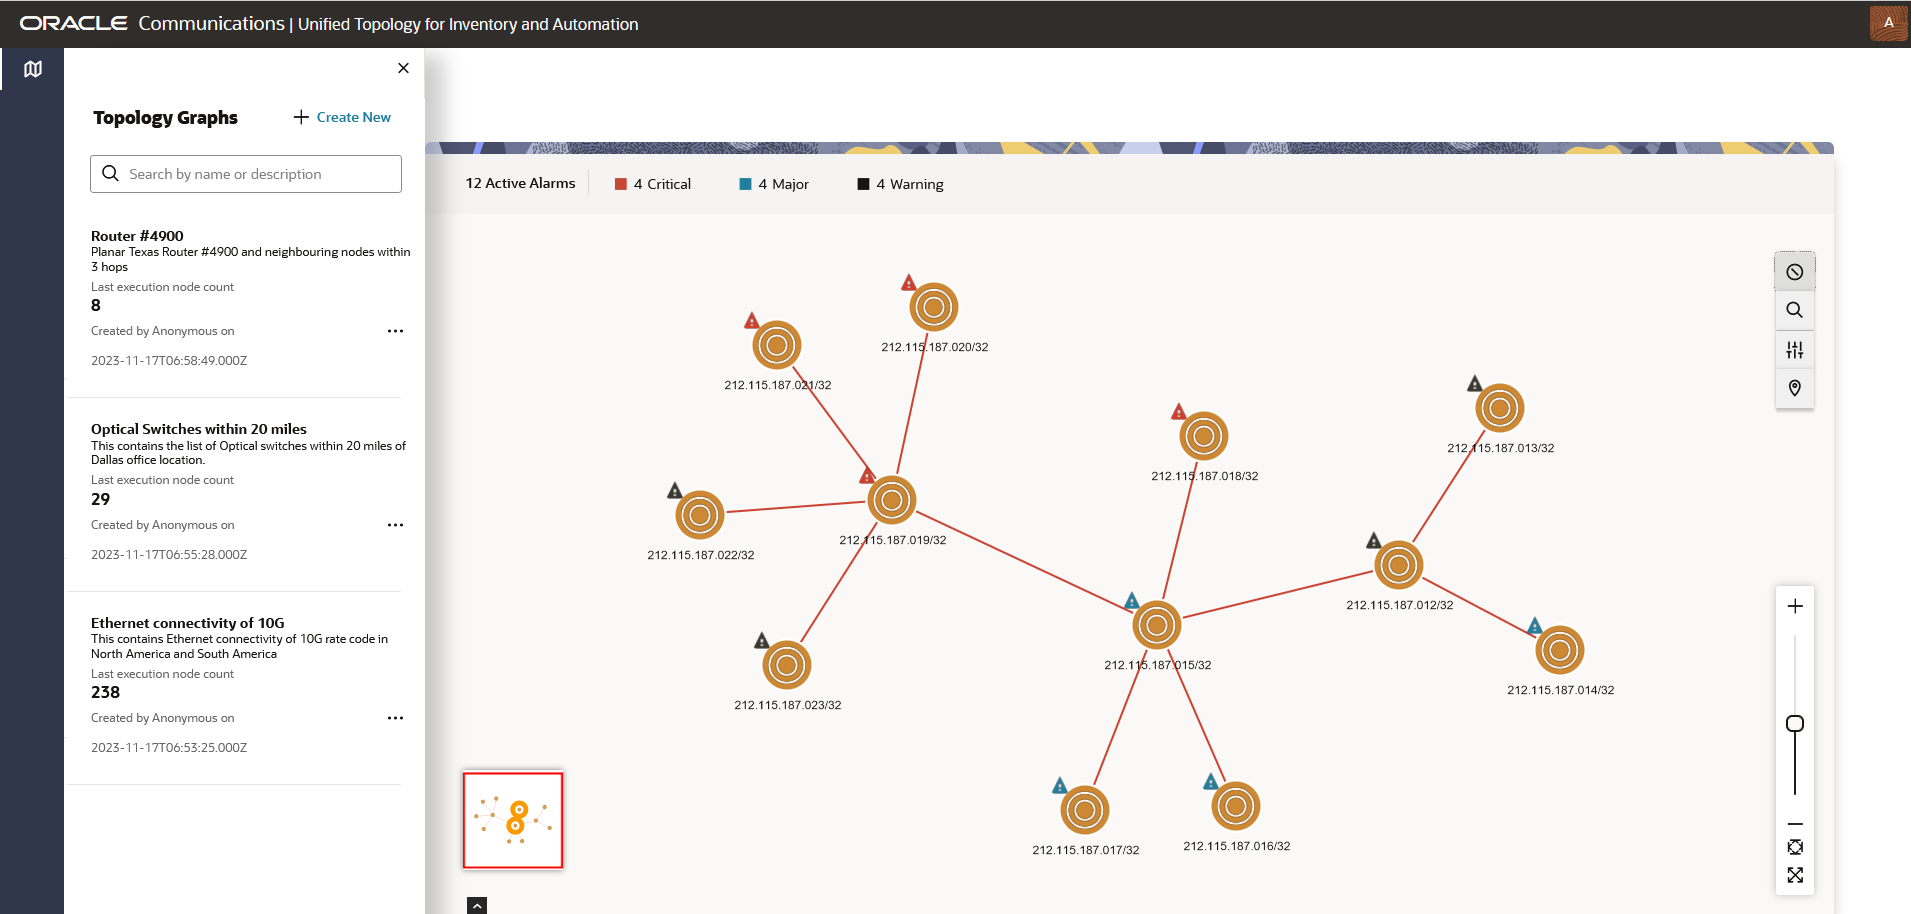
Figure 3-1 below shows the UTIA home page with the topology graph of a network.
The topology graph shows the following:
Figure 3-1 UTIA Home Page showing the topology graph of a network
- The diagram canvas on which all the topology components are depicted.
- The Alarm Details pane that shows the number of active alarms.
- An Overview pane that shows the overview information of a node or edge of any selected topology component within the topology graph.
- A legend in the left-bottom corner (below the Overview pane) that opens when clicked. It describes the colors and icons that represent the corresponding specifications in the topology graph.
- A zoom scroll bar on the right-end corner that helps you to change the zoom settings. You can change the zoom settings by scrolling the mouse or by using these controls.
- A Settings icon that opens the Settings pane to change the display and advanced settings to customize the graph as per your choice. See "Changing the Topology Graph Settings" for more information.
- A Search text box to search for a specific topology component within the topology graph.
On the topology graph, you can select a topology component, and view its details. A topology component can be a node or an edge. If the selected component is a node, you can isolate, expand, or collapse the node by right-clicking on the node and selecting the corresponding option. See "Viewing the Details of Topology Components" for more information.
