Dashboards
In this section you can change settings related to dashboards in Vision. The following steps should be followed, in order, when creating a dashboard:
-
Upload Custom Dashboard image, if needed for a logical dashboard
-
Create the Dashboard
-
Add links to the Dashboard via the Links Menu
Note that the links must be created before they are available to be added to the dashboard, refer to Links for more information.
Viewing Existing Dashboards
In this tab you can view and edit all existing dashboards in Vision. The following path shows you how to navigate in the UI:
- Dashboards -> View
The following figure shows the view for all added dashboards in Vision.
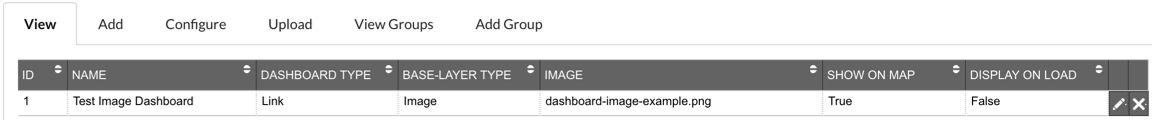
Description of illustration dashboards-view.png
You can edit the following columns:
-
Name: Name of the dashboard.
-
Dashboard Type: Type of information the dashboard displays.
-
Base-layer Type: Type of dashboard.
-
Image: Image used if it is a logical dashboard.
-
Show on Map: Flag to show if dashboard is available to view on map.
-
Display on Load: Set to true if you wish to have the dashboard displayed on map start-up.
Adding a Dashboard
Use this tab to add a new dashboard to be used in Vision. The following shows you how to navigate in the UI:
- Dashboards -> Add
The following figure shows the form for adding a dashboard to Vision.
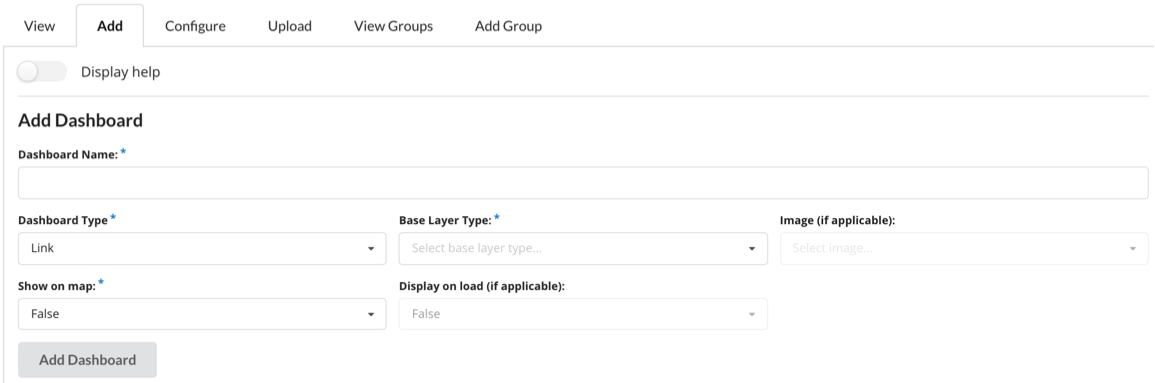
Description of illustration dashboards-form.png
Use this interface to add a dashboard in Vision.
-
Click the Display Help slider for more help on this page.
-
Mandatory fields are Dashboard Name, Dashboard Type, Base Layer Type and Show on map.
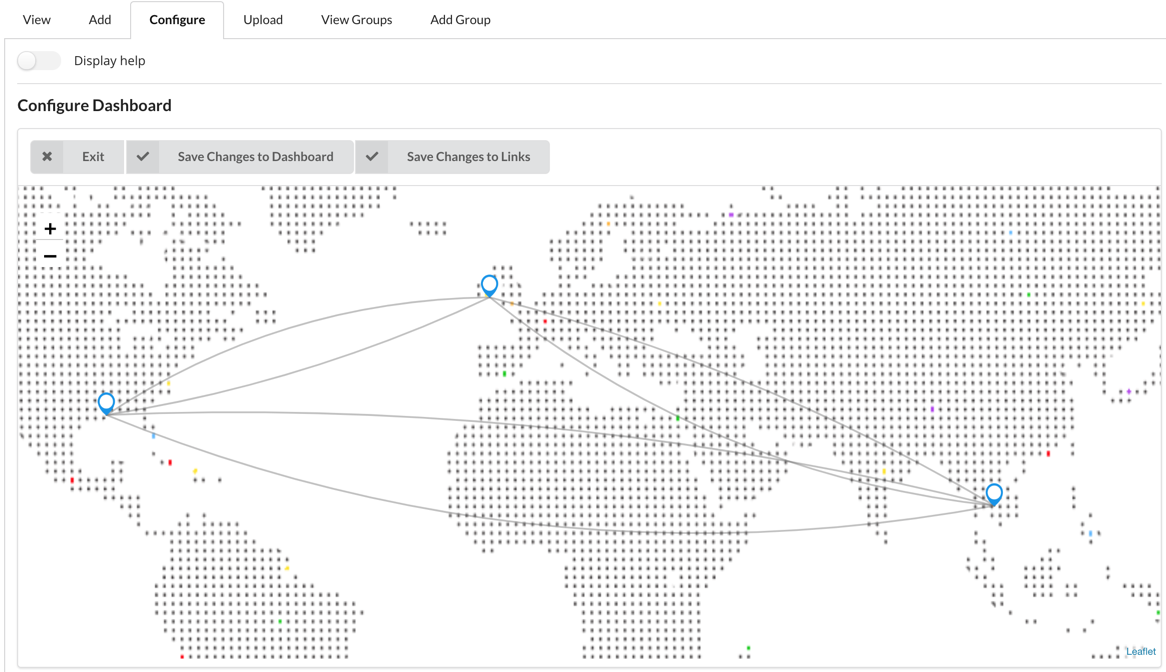
Configure a Dashboard
Use this tab to configure a dashboard to be used in Vision. The following shows you how to navigate in the UI:
- Dashboards -> Configure
The following figure shows the form for configuring the links associated with a dashboard to Vision.
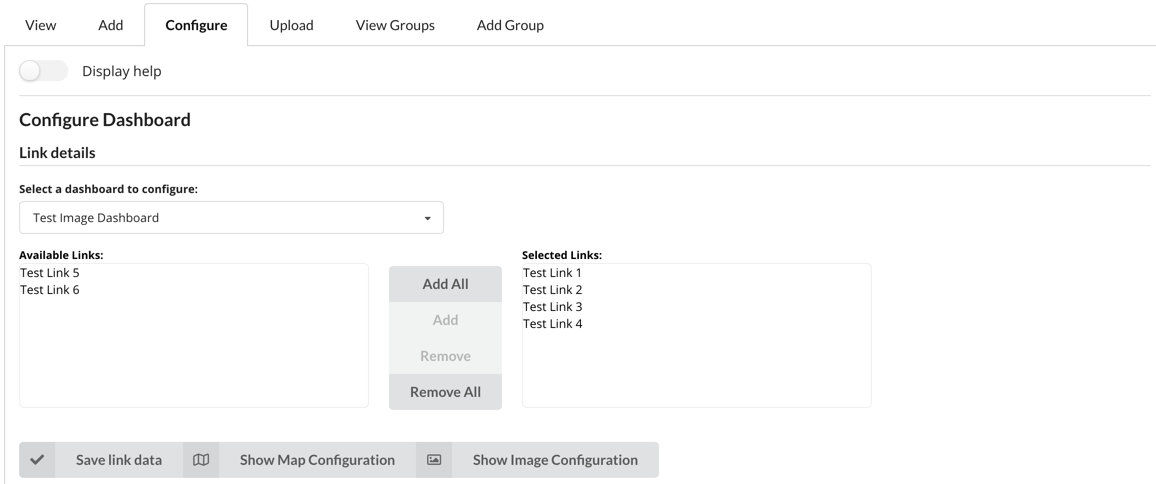
Description of illustration dashboards-configure-links.png
In this form you can choose a dashboard to configure with the first dropdown menu. Upon choosing a dashboard the picklist will be populated. You can then select any number of links to be added or removed from the dashboard.
-
Click Save Link Data to save the links to that dashboard.
-
Click Show Map Configuration to configure the Geographic View of the Dashboard.
-
Click Show Image Configuration to configure the Logical View of the Dashboard.
The following figure shows the form for configuring the geographic view of a dashboard.
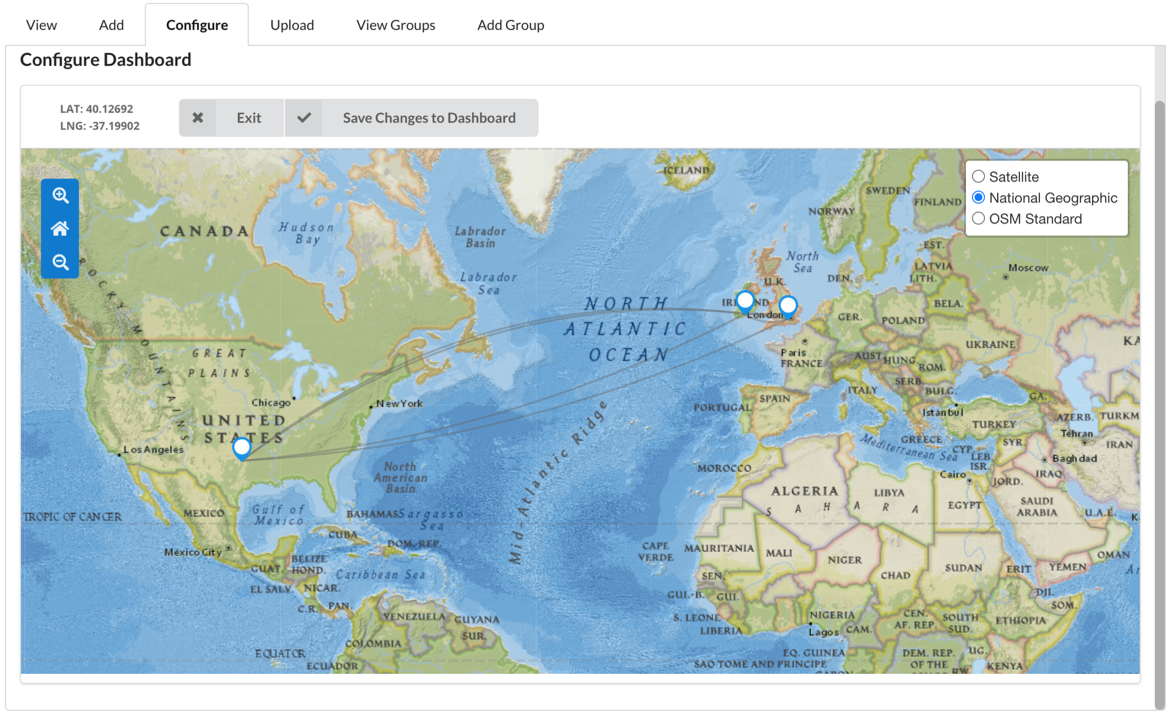
Description of illustration dashboards-configure-geographic-dashboard.png
In this configuration of the geographic view you can pan and zoom the map using the same controls as the main map. Hovering over a link will display a tooltip containing the CID and bandwidth of that marker. Hovering over a marker will display a tooltip containing the name of that entity.
There are a set of controls in the top right of the map, these can be seen in the previous figure. The first control can be used to change the basemap.
In the top left of this configuration view there are three items, the first is a display which shows the latitude and longitude of the current centre of the map. The second is a cancel button with will reset any changes and close the current menu, returning you to the configuring links section. The final button will save any changes to the basemap, latitude, longitude & zoom level for the geographic view of this dashboard.
The following figure shows the form for configuring the logical view of a dashboard.
Description of illustration dashboards-configure-image-dashboard.png
In this configuration of the logical view you can pan and zoom the map using the same controls as the main map. Hovering over a link will display a tooltip containing the CID and bandwidth of that marker. Hovering over a marker will display a tooltip containing the name of that entity.
In this configuration view the markers are movable, this allows the layout of the links to be changed. When links are displayed in this view they will either have a light blue or red marker. A light blue marker has a pixel location associated with it, a red marker does not.
In the top left of this configuration view there are three items, the first is a cancel button which will reset any changes and close the current menu, returning you to the configuring links section.
The second will save any changes to the basemap, latitude, longitude & zoom level for the logical view of this dashboard
The final button will save the location of all the markers on the dashboard.
Upload a Dashboard Image
The following path show you how to navigate in the UI:
- Dashboard -> Upload
The following figure shows the form for uploading an image for dashboards:
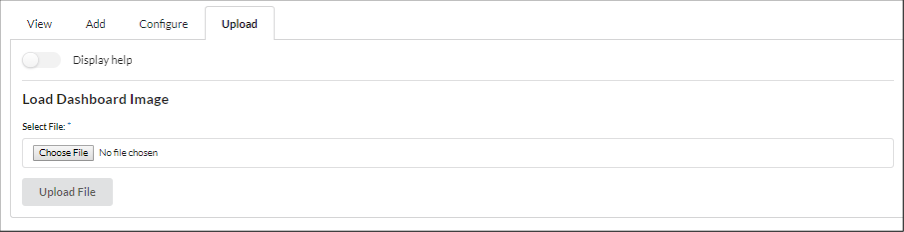
Description of illustration dashboards-upload-image-form.png
This tab allows you to upload an image so that it can be used as the background of a dashboard.
Click the display help slider for more help on this page.
The suggested format to creating an image is to create an SVG file. Once you have created a new SVG file you can insert images of each item you wish to have visible. These items could be anything you wish, countries, logos, building layouts or city maps.
To upload an image:
-
Click Choose File under the Load Dashboard Image title.
-
Browse and select your file.
-
Click Upload File to upload your file
Viewing Dashboard Groups
The following path shows how to navigate in the UI:
- Dashboard -> View Groups
The following shows the Dashboard Groups view.
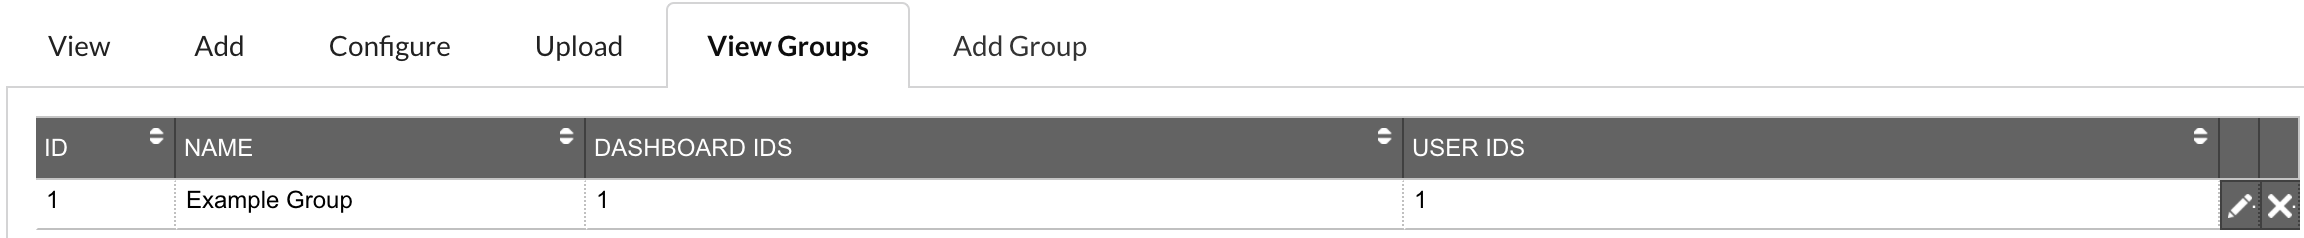
Description of illustration dashboards-groups-view.png
This tab gives a list of all dashboard groups currently in Vision. This list can be ordered by clicking on the column you wish to order by. You can edit the following columns:
-
Name: Name of the dashboard group.
-
Dashboard IDs: IDs of the dashboards that are in the group.
-
User IDs: IDs of the users that are in the group.
To edit a dashboard group, click the pencil on the end of the row. A form will be displayed to allow you to make changes, click Edit Item to confirm the changes. A popup appears asking you to confirm your edit.
Adding a Dashboard Group
The following path shows how to navigate in the UI:
- Dashboard -> Add Group
The following figure shows the form for adding a Dashboard Group.
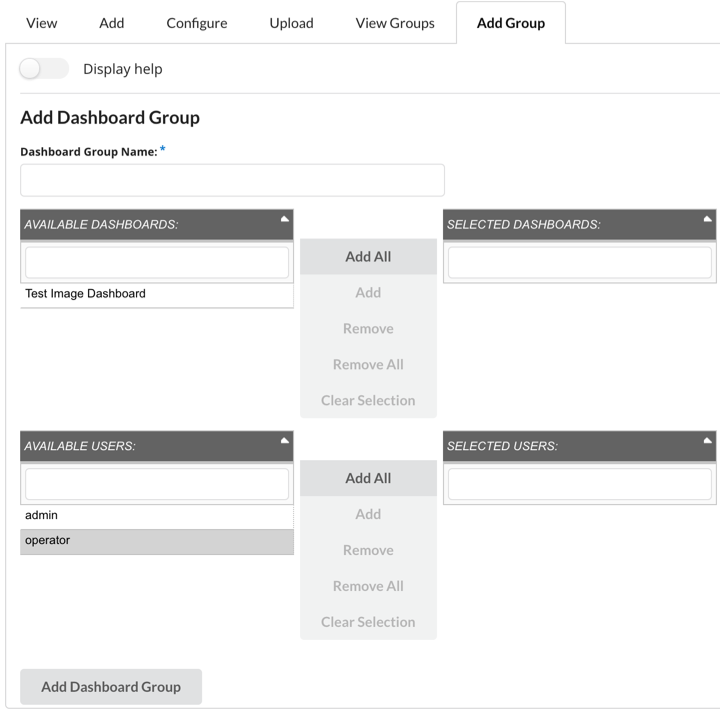
Description of illustration dashboards-group-form.png
This tab allows you to add in a single dashboard group. The only mandatory field is Name. Click Add Dashboard Group after fields are filled out to create a dashboard group.
For more information on how to interact with this form see Adding a Group.